Western University Western University
Scholarship@Western
Scholarship@Western
Electronic Thesis and Dissertation Repository
12-14-2016 12:00 AM
Modelling and Analysis of Smart Grids for Critical Data
Modelling and Analysis of Smart Grids for Critical Data
Communication
Communication
Abdulfattah Noorwali
The University of Western Ontario
Supervisor
Dr. Raveendra Rao
The University of Western Ontario Joint Supervisor Dr. Abdallah Shami
The University of Western Ontario
Graduate Program in Electrical and Computer Engineering
A thesis submitted in partial fulfillment of the requirements for the degree in Doctor of Philosophy
© Abdulfattah Noorwali 2016
Follow this and additional works at: https://ir.lib.uwo.ca/etd
Part of the Digital Communications and Networking Commons, and the Systems and Communications Commons
Recommended Citation Recommended Citation
Noorwali, Abdulfattah, "Modelling and Analysis of Smart Grids for Critical Data Communication" (2016). Electronic Thesis and Dissertation Repository. 4440.
https://ir.lib.uwo.ca/etd/4440
This Dissertation/Thesis is brought to you for free and open access by Scholarship@Western. It has been accepted for inclusion in Electronic Thesis and Dissertation Repository by an authorized administrator of
Abstract
Practical models for the subnetworks of smart grid are presented and analyzed. Critical
packet-delay bounds for these subnetworks are determined, with the overall objective of
identifying parameters that would help in the design of smart grid with least end–to–end
delay.
A single–server non-preemptive queueing model with prioritized critical packets is
presented for Home Area Network (HAN). Closed-form expressions for critical packet
delay are derived and illustrated as a function of: i) critical packet arrival rate, ii)
ser-vice rate, iii) utilization factor, and iv) rate of arrival of non-critical packets. Next,
wireless HANs using FDMA and TDMA are presented. Upper and lower bounds on
critical packet delay are derived in closed-form as functions of: i) average of
signal-to-interference-plus-noise ratio, ii) random channel scale, iii) transmitted power strength,
iv) received power strength, v) number of EDs, vi) critical packet size, vii) number of
channels, viii) path loss component, ix) distances between electrical devices and mesh
client, x) channel interference range, xi) channel capacity, xii) bandwidth of the channel,
and xiii) number of time/frequency slots. Analytical and simulation results show that
critical packet delay is smaller for TDMA compared to FDMA. Lastly, an Intelligent
Distributed Channel-Aware Medium Access Control (IDCA-MAC) protocol for wireless
HAN using Distributed Coordination Function (DCF) is presented. The protocol
elimi-nates collision and employs Multiple Input Multiple Output (MIMO) system to enhance
system performance. Simulation results show that critical packet delay can be reduced
by nearly 20% using MA-Aware protocol compared to IDCA-MAC protocol. However,
A wireless mesh backbone network model for Neighbourhood Area Network (NAN)
is presented for forwarding critical packets received from HAN to an identified
gate-way. The routing suggested is based on selected shortest path using Voronoi tessellation.
CSMA/CA and CDMA protocols are considered and closed–form upper and lower bounds
on critical packet delay are derived and examined as functions of i) signal-to-noise
ra-tio, ii) signal interference, iii) critical packet size, iv) number of channels, v) channel
interference range, vi) path loss components, vii) channel bandwidth, and viii) distance
between MRs. The results show that critical packet delay to gateway using CDMA is
lower compared to CSMA/CA protocol.
A fiber optic Wide Area Network (WAN) is presented for transporting critical
packets received from NAN to a control station. A Dynamic Fastest Routing Strategy
(DFRS) algorithm is used for routing critical packets to control station. Closed-form
expression for mean critical packet delay is derived and is examined as a function of: i)
traffic intensity, ii) capacity of fiber links, iii) number of links, iv) variance of inter-arrival
time, v) variance of service time, and vi) the latency of links. It is shown that delay of
critical packets to control station meets acceptable standards set for smart grid.
Acknowledgements
“O Allah, to You is praise as befits the Glory of Your Face and the greatness of your Might.” All the praises, and foremost thanks are due to Allah for helping me in completing my PhD study. Without His guidance and blessings, nothing is possible. If I would count up the favours of Allah, never would I be able to number them. Prayers and peace of Allah be upon the noble Prophet Mohammad and upon his family and companions, the honorable followers.
I would like to thank all people who have helped me in getting my PhD thesis between covers.
First, I would like to express my deep appreciation to my thesis supervisor Dr. Raveendra Rao. His office door is always open for discussion, encouragement, insightful guidance, consistent support, invaluable advice, and constructive criticism. I appreciate his time and ideas that have helped me to be highly productive. With his involvement and patience, I have been able to write my Ph.D thesis successfully. Also, I would like to thank my co-supervisor Dr. Abdallah Shami for his continuous encouragement, kindness and support at all stages of my PhD study.
I would also like to show my sincere gratitude and deep thanks to my parents, my grandmother, my wife, my siblings and my children. Their dua’a, support, encourage-ment, smile, and countless sacrifices are the basis of my continuing personal development. The inexhaustible kindness and love I have received are invaluable. They deserve all the credits.
I would also like to express my thanks to all my fantastic friends and colleagues for their kind support and encouragement. Special thanks go to my friends at Western with whom I had the privilege to work and the discussions with them have benefited me immensely.
Last but not the least, I would like to thank Umm Al-Qura University for the scholarship and financial support through Saudi Cultural Bureau in Canada, without which this work would not have been possible.
Dedication
Table of Contents
Abstract . . . i
Acknowledgements . . . iii
Dedication . . . iv
List of Tables . . . viii
List of Figures . . . ix
List of Abbreviations . . . xii
List of Symbols . . . xv
1 Introduction . . . 1
1.1 Introduction to Smart Grids . . . 1
1.2 Literature Survey and Motivation . . . 3
1.3 Structure of Smart Grid . . . 8
1.3.1 Three Subnetworks of Smart Grid . . . 10
1.4 Thesis Objectives . . . 12
1.4.1 Modelling and Analysis of Home Area Network (HAN) . . . 12
1.4.2 Modelling and Analysis of Channel-Aware MAC Protocol for HAN 13 1.4.3 Modelling and Analysis of Neighbourhood Area Network . . . 13
1.4.4 Modelling and Analysis of Wide Area Network . . . 14
1.5 Thesis Organization . . . 15
2 Background . . . 17
2.1 Introduction . . . 17
2.2 Key Terms . . . 17
2.3 Network Models and Assumptions . . . 18
2.3.1 Generating Functions . . . 20
2.3.2 Wireless Interference . . . 20
2.3.3 Channel Capacity . . . 22
2.3.4 Routing and Communication . . . 23
2.3.5 Communication Access Schemes . . . 23
2.3.6 Optical Communication . . . 23
2.3.7 MATLAB Simulator . . . 24
2.4 Smart Grid Components . . . 24
2.4.2 Neighborhoods Area Network . . . 33
2.4.3 Wire-Line Network . . . 37
2.5 Summary and Conclusions . . . 41
3 Single-Server Non-Preemptive Priority Queueing Model for HAN . . 42
3.1 Introduction . . . 42
3.2 Model of Non-preemptive Single Server Queueing System . . . 43
3.2.1 State of Queuing System . . . 46
3.2.2 Queueing System Contents . . . 46
3.3 Delay Analysis of Queueing System . . . 49
3.4 Average Packet Delay and Contents for HAN . . . 50
3.5 Numerical Results and Discussion . . . 51
3.6 Summary and Conclusions . . . 55
4 Modelling and Delay Analysis of Wireless HAN . . . 56
4.1 Introduction . . . 56
4.2 Model of Wireless HAN . . . 57
4.2.1 Channel Models and Fading Statistics . . . 60
4.2.2 Centralized Multiple-Access Schemes for Scheduling Transmissions 60 4.3 Delay Analysis . . . 63
4.3.1 Lower Bound on the Delay . . . 63
4.3.2 Upper Bound on the Delay . . . 65
4.3.3 Capacity Estimation over Wireless Fading Channels . . . 65
4.3.4 Delay Analysis for Multiple Access Schemes . . . 67
4.4 Numerical Results and Discussions . . . 68
4.5 Summary and Conclusions . . . 74
5 Intelligent Distributed Channel-Aware MAC Protocol for HAN . . . 76
5.1 Introduction . . . 76
5.1.1 Background . . . 77
5.2 HAN Environment Description . . . 78
5.2.1 CSMA/CA Scheme . . . 78
5.2.2 MAC System Description . . . 79
5.2.3 Tuning In/Tuning Out Specifications . . . 80
5.3 Intelligent Distributed Channel-Aware MAC Protocol . . . 80
5.3.1 Interference Cancellation . . . 81
5.3.2 Zig-Zag Decoding . . . 81
5.3.3 Simulation Results and Analysis . . . 83
5.3.4 IDCA-MAC Protocol Operation . . . 84
5.4 Overall Evaluation . . . 88
6 Modelling and Delay Analysis of NAN . . . 91
6.1 Introduction . . . 91
6.1.1 Background . . . 91
6.2 Model of WMBN . . . 95
6.2.1 Voronoi Tessellation Definition . . . 96
6.2.2 Inter-Channel Interference Model . . . 96
6.2.3 Wireless Interference . . . 97
6.2.4 Scheduling Transmissions . . . 99
6.2.5 Straight-Line Path Routing (SLPR) Algorithm . . . 104
6.3 Delay Analysis . . . 105
6.3.1 Parallel Transmission in CSMA/CA . . . 105
6.3.2 Transmission using CDMA Protocol . . . 107
6.4 Numerical Results and Discussions . . . 108
6.5 Conclusions and Summary . . . 111
7 Modelling and Delay Analysis of WAN . . . 112
7.1 Introduction . . . 112
7.2 Expression for Delay in WAN . . . 113
7.3 Proposed Dynamic Routing Strategy (DFRS) . . . 114
7.3.1 Problem Formulation to Determine Optimal Path . . . 114
7.4 End-To-End Delay Analysis in WAN . . . 117
7.4.1 Transition State . . . 119
7.4.2 Average Delay Analysis . . . 120
7.4.3 Multiple Access Scheme for Scheduling Transmissions . . . 121
7.5 Numerical Results and Discussion . . . 122
7.5.1 Overall Evaluation of Critical Packet Delay . . . 123
7.6 Conclusions and Summary . . . 126
8 Conclusions . . . 127
8.1 Introduction . . . 127
8.2 Summary of Contributions . . . 127
8.3 Suggestions for Future Work . . . 129
List of Tables
Section Page
1.1 A list of notable research efforts in smart grid . . . 7
2.1 Traffic (packets/second)-cum-Routing Matrix . . . 38
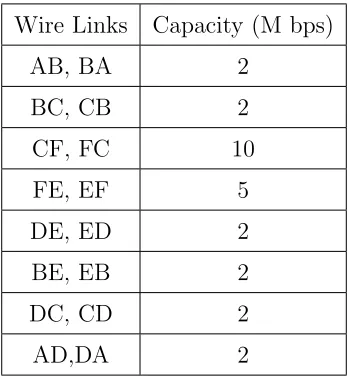
2.2 Wire Link Capacities . . . 39
2.3 Table for computing delays over each of the links in the network . . . 40
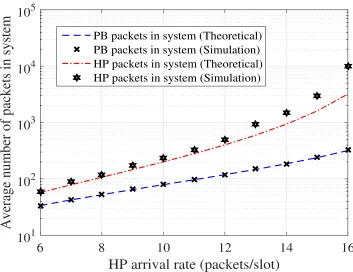
3.1 Parameters used to determine average number of packets in the system (Fig. 2.4) and average packet delay (Fig. 2.5) as a function ofλHP . . . 52
3.2 Parameters used to determine average packet delay (Fig. 2.6) as a function of service rate, µ . . . 53
3.3 Parameters used to determine average packet delay as a function of system utilization factor, ρT . . . 54
5.1 Extended RTS frame structure for IDCA-MAC protocol . . . 79
5.2 Extended CTS frame structure for IDCA-MAC protocol . . . 79
5.3 ICDA-MAC protocol parameters used in the simulation [62] . . . 83
6.1 Model parameters used in simulation of WMBN . . . 108
6.2 Parameters used for plotting critical delay as a function of CIR (Fig. 5.10) 108 6.3 Parameters used for plotting critical delay as a function of β (Fig. 5.11) . 108 6.4 Parameters used for plotting of critical packet delay as a function of num-ber of critical packets n (Fig. 5.11) . . . 109
List of Figures
Section Page
1.1 Annual business losses from power grid problem. . . 3
1.2 Chronological research effects in smart grid communications. . . 6
1.3 General view of power grid/smart grid. . . 7
1.4 A conceptional model of smart grid. . . 9
1.5 A pictorial view of a smart grid. . . 9
1.6 An expanded view of smart grid model. . . 11
2.1 IEEE 802.11 Channel Blocks. . . 21
2.2 Example of how distance is considered. . . 21
2.3 Powers signals decay effects toi channel into u node. . . 22
2.4 Transmissions aroundu node. . . 22
2.5 The structure components of M/M/1 model. . . 26
2.6 FDMA frequence bands. . . 28
2.7 TDMA Time Slots. . . 29
2.8 Type of data generated by elctrical deivces. . . 29
2.9 FDMA Transmission Function. . . 30
2.10 TDMA Transmission Function. . . 31
2.11 Fading types. . . 32
2.12 Definitions of Voronoi Cell Shapes. . . 34
2.13 CSAM/CA timing diagram. . . 36
2.14 CDMA time/frequence slots. . . 36
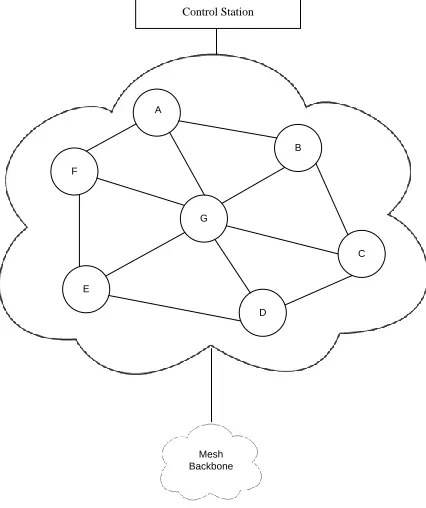
2.15 Wire-Line Network. . . 37
2.16 Wire-Line Network Example. . . 38
3.1 Non-preemptive queueing model between ED and MC. . . 44
3.2 Model of HAN in smart grid. . . 44
3.3 Queueing model between a set of n EDs and MC. . . 51
3.4 Average number of packets in the system as a function of HP arrival rate (λHP). . . 52
3.5 Average packet delay as a function of HP arrival rate (λHP). . . 53
3.6 Average packet delay as a function of service rate (µ), for λHP = 8 and λP B = 1. . . 54
3.7 Average packet delay as a function ofρT, for λHP = 2 andλP B = 1. . . 55
4.1 Model of typical wireless HAN and its multipath environment. . . 57
4.2 Spectrum allocation in IEEE 802.11 networks . . . 58
4.3 General view of wireless HAN communication network. . . 58
List of Tables
4.5 Time-frequency plot for modified FDMA. . . 61
4.6 Time-frequency plot for modified TDMA. . . 62
4.7 Channel block showing interference from each active channel. . . 64
4.8 Channel capacity as a function of SNR for Nakagami, Rayleigh, and Gaus-sian channels. . . 67
4.9 Critical delay bounds for HAN with modified FDMA as a function of SNR (¯γ) forCIR = 2, QHAN = 25, n= 200, β = 2. . . 69
4.10 Critical delay bounds for HAN with modified TDMA as a function of SNR (¯γ) forCIR = 2, QHAN = 25, n= 200, β = 2. . . 70
4.11 Critical delay bounds for HAN as a function of CIR for: QHAN = 25, n= 200,β = 3, and ¯γ = 5dB. . . 71
4.12 Critical delay bounds for HAN as a function of β for QHAN = 25, n = 200,CIR= 8, and ¯γ = 5dB. . . 71
4.13 Critical delay bounds for HAN as a function of n for QHAN = 25, β = 3,CIR = 8, and ¯γ = 5 dB. . . 72
4.14 Critical delay bounds for HAN (A= 1) as a function ofCIRfor: QHAN = 25, n= 200, β = 3, and ¯γ = 100. . . 73
4.15 Critical delay bounds for HAN (A= 1) as a function ofβ forQHAN = 25, n= 200, CIR= 8, and ¯γ = 100. . . 73
4.16 Critical delay bounds for HAN (A= 1) as a function of nforQHAN = 25, β = 3, CIR= 8, and ¯γ = 100. . . 74
5.1 Structure of HAN with EDs and MC equipped with multiple antennas. . 81
5.2 Collision scenario of transmitting more than one packet over the channel. 82 5.3 Two transmitted packets with collision. . . 83
5.4 Timing diagram of MAC decision process when secondary transmission time is less than the primary [62]. . . 86
5.5 Timing diagram of MAC decision process for the case of partial weight sensing [62]. . . 86
5.6 Timing diagram of MAC decision process for the case of splitting data through transmission [62]. . . 87
5.7 Timing diagram of MAC decision process for the case of collision [62]. . . 87
5.8 Throughput of the system as a function of number of electrical devices [62]. 88 5.9 Critical packet delay of the system using IDCA-MAC protocol as a func-tion of number of electrical devices [62]. . . 89
5.10 Throughput of the system as a function of CW size [62]. . . 89
6.1 Structure and location of NAN in smart grid. . . 92
6.2 Conceptional model of Wireless Mesh Backbone network. . . 94
6.3 Example of Voronoi structure. . . 95
6.4 Wireless mesh backbone network in the Voronoi diagram. . . 96
6.5 Straight-line path in Voronoi diagram. . . 98
6.6 Division of ring area for WMBN. . . 98
6.7 Channel block showing interference from each active channel. . . 100
6.9 CDMA: Time, frequency and code slots. . . 102
6.10 Delay bounds as a function of the CIR. . . 110
6.11 Delay bounds as a function of the SN R. . . 110
6.12 Delay bounds as a function of number of critical packets n. . . 111
7.1 Structure of high-speed WAN. . . 115
7.2 Network model scenario. . . 115
7.3 Death and birth process of a WAN in a smart grid. . . 120
7.4 TDMA time slots. . . 121
7.5 Critical packet delay as a function of threshold WANQoS. . . 124
7.6 Critical packet delay in WAN as a function of capacity of links Cl. . . 124
7.7 Critical packet delay as a function of adjacent channel loadyi,j. . . 125
7.8 Critical packet delay a function of link utilization ρl. . . 125
7.9 Critical packet delay as a function of number of available channels bl. . . 126
8.1 End-to-end delay of smart grid as a function of number of EDs for: QHAN = 25, QN AN = 25, bl = 1−15,β = 3, r = 8000, dedge = 100m, dvertex = 200m, L = 1000, W = 22MHz, ro = 5m, ϕ = 3, ¯γ = 200, λ = 500packts/sec, µ = 600packets/sec, Cl = 100Mbs, QoS = 50Mbits, and ri,j = 10Km . . . 130
List of Abbreviations
AL Access Layer
AP Access Point
CDMA Code Division Multiple Access
CIR Channel Interference Range
CL Core Layer
CSMA/CA Carrier Sense Multiple Access/Collision Avoidance
DCF Distributed Coordination Function
DFRS Dynamic Fastest Routing Strategy
DL Distribution Layer
DRX Delay-Responsive Cross Layer
ED/EDs Electrical Device/Electrical Devices
EDN Electrical Device Network
EISA Energy Independence and Security Act
FDMA Frequency Division Multiple Access
FIFO First Input First Output
GPSR Greedy Perimeter Stateless Routing
GTS Guaranteed Time Slots
HAN/HANs Home Area Network/Home Area Networks
HOL Head-of-Line
HP High Priority
ICR Inter-Channel-Interference Range
ICT Information and Communication Technologies
i.i.d independent and identically distributed
IP Internet Protocol
LAN Local Area Network
LoS Line of Sight
MAC Medium Access Control
MBN Mesh Backbone Network
MA-Aware Media Access Aware
MC/MCs Mesh Client/Mesh Clients
MR/MRs Mesh Router/Mesh Routers
MWM Maximum Weighted Matching
NAV Network Allocation Vector
NAN Neighbourhood Area Network
NIST National Institute of Standards and Technology
PB Periodic Base
PC Point Coordinator
PCF Point Coordination Function
PDF Probability Distribution Function
PHY Physical Layer
PGF Probability Generating Function
PLC Power Line Communication
QAM Quadrature Amplitude Modulation
QGA QoS-aware GTS
SNR Signal-to-Noise Ratio
SLPR Straight-Line Path Routing
TDMA Time Division Multiple Access
TUs Time Units
WAN Wide Area Network
WDN Wired Distribution Network
WHAN Wireless Home Area Network
WiFi Colloquial English synonym for “WLAN”
WLAN Wireless Local Area Network
WMN Wireless Mesh Network
List of Symbols
a Time slot
ϕ Path-loss exponent
α Random channel scale
bi,a Number of class i arrivals in slot a
bT,a Total number of arrivals in slot a
B(z1, z2) Joint pgf of the number of per-slot-class (i= 1,2) arrivals
BT(z) pgf of the total number of arrivals per-slot
BHP(z) pgf of number of HP arrivals
BP B(z) pgf of number of PB arrivals
β SN R threshold
CAW GN Capacity of AWGN channel
CF ading Capacity of fading channel
CR Capacity of Rayleigh channel
CN Capacity of Nakagami channel
Cov[..., ...] Covariance of two stochastic variables
CIR Channel interference range
Cl Capacity over link l
Ci,u Capacity of channel i at node i
d Distance between two active channels (i, j)
Dhop One-hop communication delay in WMBN
dedge Minimum distance from mesh router to its cell edge
dvertex Maximum distance from mesh router to its cell vertex
∆EDN Delay in Electrical device network
∆F D Delay in FDMA system
∆end-to-end End-to-end delay
∆lend-to-end Lower bound on end-to-end delay ∆uend-to-end Upper bound on end-to-end delay
∆T D Delay in TDMA system
El Average number of packets in each link
Elt Average number of packets in transit
ElqG/G/bl Number of packets that are waiting in queue
EqG/G/bl Approximate number of packets in queue
fk Group of different frequency bands
γ Instantaneous SN R
¯
γ Average SN R
γu,i SN R on channel i at nodeu
Γ(..., ...) Complementary incomplete gamma function
hl Minimum number of hops
hu Maximum number of hops
I Interference
Iu,i,j Interference caused by simultaneous j transmissions on
channel i at node u
k Number of available channels
L Packet size
Ll Distance of link l in Km
λl Arrival rate over link l
λHP Arrival rate of high priority packets
λP B Arrival rate of periodic base packets
M Number of time slots
µ Service rate
µk Death rate corresponding to λl
n Number of reports to be transmitted
No PSD of White Gaussian noise
ω Waiting time
ωCD Waiting time in CDMA system
ωF D Waiting time in FDMA system
ωT D Waiting time in TDMA system
Ω Expected value of random channel scale
Pt(t) Transmitted power
Pl(0) Probability of no packets in the system
Pr(t) Received power
PR(γ) Probability density function of of SNR for Rayleigh channel
PN(γ) Probability density function of SNR for Nakagami channel
PGF Probability generating function
QEDN Number of channels in the EDN
QHAN Number of channels in the HAN
QN AN Number of channels in the NAN
QW AN Number of channels in the WAN
QoS Quality of Service in bits
r(ref) Reference distance
ri,j Path length of link between i and j
ρHP Load due to HP packets
ρl Load over link l
ρP B Load due to PB packets
ρT Total load
S Number of scheduled transmissions
s(t) Transmitted signal
σs2 Variance of service time
SN R Signal-to-noise ratio
T Transmission time
Tavg Average packet delay
τCD Transmission time in CDMA system
τF D Transmission time in FDMA system
τl Propagation delay over link l
τT D Transmission time in TDMA system
Ts Mean service time
Tmean(G/G/l) Average packet delay in WAN for G/G/l system Tmean(G/G/bl) Average packet delay in WAN for G/G/bl system
Tl(G/G/l) Transmission time over link l in G/G/l system
Tl(G/G/bl) Transmission time over link l in G/G/bl system
ul Utilization of the fiber optic link l
ui,a System contents of classitraffic at the beginning of random
slot a
uT,a Total system contents at the beginning of random slot a
Ua(z1, z2) Joint pgf of HP and PB classes at the beginning of slot a
U(z1, z2) Steady-state joint pgf of the system contents HP and PB
classes at a random slot
Va2 Coefficient of variation of inter-arrival time
V ar[bT] Variance of total number of arrivals
Vs2 Coefficient of variation of service time
W Channel bandwidth
y Total load in WAN
¯
y Average total load in a WAN
yi,j Traffic load between a pairs of nodes (i, j)
ZCSMA/CAl Minimum number of scheduled channels in CSMA/CA sys-tem
ZCSMA/CAu Maximum number of scheduled channels in CSMA/CA sys-tem
ZCDMAl Minimum number of scheduled channels in CDMA system
Chapter 1
Introduction
1.1
Introduction to Smart Grids
Power grid is a term used to describe electricity system that supplies power to Electrical
Devices (EDs), located at customers’ site, through four operations: generation,
transmis-sion, distribution, and control station. It has become critical to connect a communication
network/system between the control station and customers for the purpose of gathering
and analyzing real–time data about customers to monitor and effect corrective measures.
This has become all the more important after the events like the North American power
outages that occurred between 1998 and 1999, which left nearly 3.5 million customers
without electricity in specific cases for long durations of time.
Efficient communication network infrastructure is therefore the catalyst that
ele-vates especially interconnectivity between different utilities and is in turn essential for
avoiding unexpected disconnections from power grid. Such a communication
infrastruc-ture is referred to as intelligent network or smart grid. Smart grid gathers information
from customers to enable automated delivery of power to them in an efficient way and
protects customers from disconnection to power grid.
In [1], a communication network architecture is presented that still needs innovative
solutions to integrate it effectively with the power grid. EDs often suffer from
unreli-able power supply during peak hours. Meanwhile, power grids are becoming larger and
more complex, encompassing thousands of EDs, requiring a more stable power supply
system. These concerns have contributed to the emergence of the first smart grid (2005)
by Italy’s Telegestore Project, which serves nearly 27 million users. This grid is based on
smart meters connected via low-bandwidth Power Line Communication (PLC) systems.
Since then, works on smart grids have been expanded to analyze the performance of the
2007, the USA applied efforts to create and deploy a smart grid, with the Energy
Inde-pendence and Security Act (EISA) encouraging utility companies to begin deployment
of smart grids. In this regard, a Federal Smart Grid Task Force was established with the
objective of modernizing the power grid for enabling quick response to demand, and for
providing high-quality power to customers. As a result, smart grid was deployed in 2008
in Colorado, USA, for connecting customers to power grid through a control station. In
2012, work on smart grid designs culminated in the specification of standards for smart
grid and were published by the American National Institute of Standards and
Technol-ogy (NIST) [2]. The logical connections among different system domains are discussed in
these standards. It is highlighted that communication networks should support current
and future electrical devices for purposes of monitoring, fault detection, fault isolation,
addressability, service discovery, routing, quality of service, and security [3].
One of the most significant challenges facing smart grid architects is that of
provid-ing end-to-end communication services. Power equipment should have the ability to send
large amounts of information in order to facilitate communication between power plants
and consumers. Such networks should provide robust connectivity between EDs and
the control stations. This connectivity should aid in decision making based on reports
received from EDs, to track power faults and respond to them instantaneously.
To put the scale of the problem into perspective, it is estimated [4], that the annual
business loss due to problems of power grid at 150 billion dollars as shown in Fig. 1.1. The
United States grid consists of nearly 3,200 electric utilities operating with about 70,000
power plants serving around 315 million consumers using nearly 157,000 miles of high
voltage electric transmission lines [1]. The average age of the power grid transmission
line is 50-60 years [3]. Between 1988 and 1998, the demand for electricity in the U.S
grew by 30%, yet only 15% new transmission capacity was created [4]. The severity of
potential costs does not pertain to the scale only. Environmental factors are also critical,
as around 40% of America’s total CO2 emissions are due to electricity production [5].
The added layer of intelligence through smart grid requires independent processors in
each ED and at each substation and power plant. These processors must have a robust
operating system and be able to act as agents that can communicate and cooperate with
each other using a large distributed computing platform. When this does not happen
Figure 1.1: Annual business losses from power grid problem.
lead to system instability.
A sobering example of how fast the critical data need to be transmitted for quick
and corrective action can be seen in the case of the missing Malysian aircraft (MH 370),
in April 2014. The aircraft disappeared from radar screens, but the response system was
unable to make a quick decision and relay it quickly enough. Similarly in a smart grid,
the power status information generated by EDs are critical and required to be conveyed
for decision making with a guaranteed minimum value of delay. The different types of
critical data are [7]: i) alarms on power level usage, ii) status on power fault detection,
iii) quality of power, and iv) weather and environment. The end-to-end delay being the
critical metric in smart grids is a function of various parameters such as node energy and
network characteristics. The hypothesis in this work is that there always exists room for
improvement.
1.2
Literature Survey and Motivation
Recently, smart grid has been studied in numerous works. Sood, in 2009, [5, 6] examined
the interconnection between several power system applications and network availability
with the aim of enhancing power generation using smart grids. Souryal et al. [8]
they analyzed the performance of smart grid using IEEE 802.11 standard. Also, they
devised a model link layer network to measure reliability, delay, and throughput between
relays and customers. However, their model was simply based on channel effects and
col-lisions and it did not take into account end-to-end service, and the domains of operations
and customers. In [9], the challenge of managing network demand is investigated using
the characteristics of smart meters, bandwidth requirement, and delay via the Ethernet.
Hamid et al. [10] examined a multigate network, a tree-based structure, to provide
reli-able two-way communication between meters and a data collector node. They introduced
a scheduling scheme to balance traffic among a set of gateways. Delay effects were not
considered. Galli et al. [11] proposed a method for modelling smart grids and addressed
the issue of data transmission over Power Line Communication(PLC) system. One of the
first efforts that addressed end-to-end services in a smart grid was examined by Sauter
et al. [12]. They addressed a combination of gateways between application servers and
customer nodes using PLC system and an IP-based network. The generic solution they
proposed encouraged researchers to further study end-to-end connections between
ap-plications and servers. As data security gained more attention, Sauter et al.[13, 14, 15]
discussed issues of privacy and protection of information confidentiality in smart grids.
In [16], a dynamic operation of cellular- based smart network is examined for reducing
operational expenditures and CO2 emissions. Base stations in the network are designed
to control retailers’ ability to procure electricity. Mohammad [17] considered a wireless
mesh network for collection of data from electrical equipment, and investigated its
per-formance to determine the number of relays that would reduce the choice of overhead.
The numbers of clients, communication bandwidth and distance factors are considered
by Mohammad [18] in the design of mesh network using optimization methods.
The trade-off between wireless coverage and capacity is addressed by Hongjian [19]
and methods for improving the spectral efficiency and coverage for communication
in-frastructure in smart grids are also discussed. Lopez et al. [20] investigated bidirectional
real-time communication strategies for modelling distribution large of smart grid. The
results show that flexible and cost-effective solutions are possible in smart grid.
Kulka-rni [21] discussed interconnection of networking system in smart grid with the aim of
improving robustness, scalability, and fault detection. It is shown that deployment of
to a concentrator closet to them. In [22], Fateh studied hybrid hierarchical smart grid
that combined wired and wireless systems with the aim of minimizing installation and
operational costs. Results showed that wireless link bandwidth is a limiting factor when
optimizing cost. Later, Yi et al. [23] used wireless mesh network for smart grids and
investigated its delay performance for critical communications. However, they did not
consider the constraints associated with real-time scenarios in smart grid. Kong et al.
[24] considered a wireless neighbourhood area network based on IEEE 802.15.4g standard
and assumed that smart meters are divided into groups and take turns sharing wireless
channels using the slotted Alloha protocol. Their objective is limited to quantifying the
QoS metric as a function of number of concentrators per 10 km2 of geographical area.
A smart grid, in general, must be interoperable and communicate with subsystems
that are distributed and allows multiple applications to communicate with each other.
Smart grids generate billions of data points from thousands of devices, requiring
contin-uous on-the-spot analysis for prioritizing. This leads to timing challenges in smart grids.
These challenges become more complex in the light of architectural design, limited
band-width resource, shadowing effect, number of channels, channel interference etc. All these
factors contribute to unacceptable packet loss and delays in smart grid. In an attempt to
address these challenges, Gupta et al. [25] obtained a tighter upper bound on delay for
a Neighbourhood Area Network (NAN) with single-hop traffic and general interference
constraints. They estimated the expected delay for independent arrival streams using
Maximum Weighted Matching (MWM) scheduling policy. Irfan et al. [26, 27] introduced
a data distribution technique called Delay-Responsive Cross Layer (DRX) that uses
ap-plication layer to perform cross-layer predictions for the end-to-end delay. The technique
can be used for applications in smart grid. They did not address realistic scenarios in
which interfering nodes exist and the claims in their work is based on simulations without
theoretical support. Gowdemy et al. [56, 29] studied critical communication with respect
to consumer needs and investigated throughput, delay, and scalability of NAN in smart
grid using Greedy Perimeter Stateless Routing (GPSR) strategy. They showed that the
upper bound on delay of 100 ms can be achieved. However, the simulation scenario was
limited to a single-hop IEEE 802.15.4 network. Neal et al. [30] used an optimization
tool to implement minimal communication structure requirements for smart grid subject
Scalability
Hierarchal designs for smart grids are proposed with a focus on scalability and optimization of
network resources.
Scalability
Hierarchal designs for smart grids are proposed with a focus on scalability and optimization of
network resources.
Cost Optimization
Smart grids were implemented with a focus on optimization of installation cost.
Cost Optimization
Smart grids were implemented with a focus on optimization of installation cost.
QoS Improvement
Researchers employ communication technologies in modeling smart grids with a
focus on QoS metrics. QoS Improvement
Researchers employ communication technologies in modeling smart grids with a
focus on QoS metrics.
Delay Minimization
Researchers investigated communication protocols to minimize the delay in critical communication that may applied from consumers to control stations in smart grids.
Delay Minimization
Researchers investigated communication protocols to minimize the delay in critical communication that may applied from consumers to control stations in smart grids. 2011 2012 2013 2014 2015
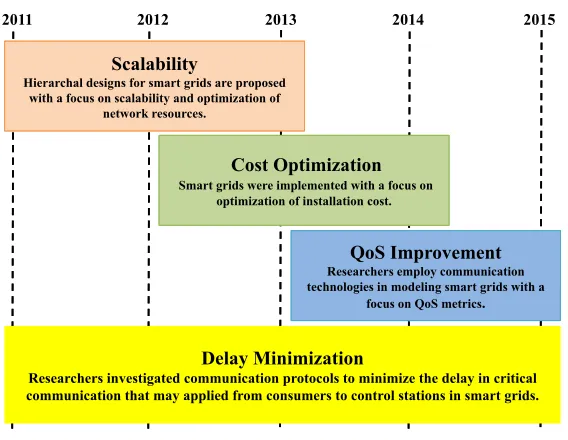
Figure 1.2: Chronological research effects in smart grid communications.
parameters to control delay in smart grid. They did not consider practical constraints
such as channel capacity limits, data distributions etc. Al-Anabgi et al. [31] proposed an
algorithm to allow the transmission of data using Guaranteed Time Slots (GTS) which
can be used to reduce end-to-end delay of critical data in a HAN. This algorithm
al-though is aimed at minimizing the delay of critical data, its application is limited to
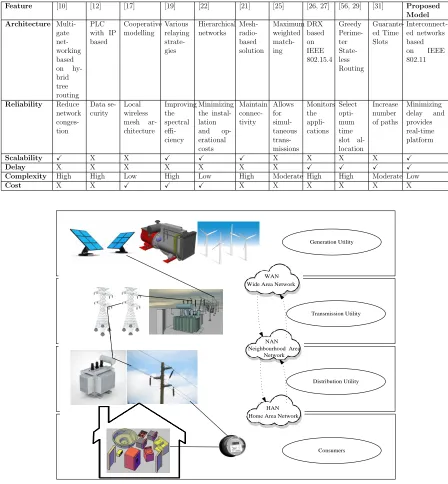
Table 1.1: A list of notable research efforts in smart grid
Feature [10] [12] [17] [19] [22] [21] [25] [26, 27] [56, 29] [31] Proposed
Model Architecture Multi-gate net-working based on hy-brid tree routing PLC with IP based Cooperative modelling Various relaying strate-gies Hierarchical networks Mesh- radio-based solution Maximum weighted match-ing DRX based on IEEE 802.15.4 Greedy Perime-ter State-less Routing Guarante-ed Time Slots Interconnect-ed networks based on IEEE 802.11 Reliability Reduce network conges-tion Data se-curity Local wireless mesh ar-chitecture Improving the spectral effi-ciency Minimizing the instal-lation and op-erational costs Maintain connec-tivity Allows for simul-taneous trans-missions Monitors the appli-cations Select opti-mum time slot al-location Increase number of paths Minimizing delay and provides real-time platform
Scalability X X X X X X X X X X X
Delay X X X X X X X X X X X
Complexity High High Low High Low High Moderate High High Moderate Low
Cost X X X X X X X X X X X
Wide Area Network
Neighbourhood Area Network
Home Area Network WAN NAN HAN Generation Utility Transmission Utility Distribution Utility Consumers
Figure 1.3: General view of power grid/smart grid.
A summary of chronological research efforts in smart grid communications in the
areas of scalability, cost optimization, QoS improvement, and delay minimization is
de-picted in Fig. 1.2. Table 1.1 provides a list of research efforts in smart grids and can
be used to identify gaps in research that need to be addressed in the areas of
data communication in smart grid plays a major role and has been studied in bits and
pieces. An examination of a comprehensive model of smart grid, with major focus on
critical communication delay analysis (consumers to the control station) is lacking in the
literature.
1.3
Structure of Smart Grid
A comprehensive model of smart grid must address consumers’ demand, economic
bal-ance of power generation and supply, and time required to respond to remotely located
consumers. Also, the model must effect successful operation, power transfers, and reduce
energy losses. In order to understand and fulfil these expectations, a general view of
power grid/smart grid is shown in Fig. 1.3 in which electrical devices (customers) are
served through three stages of utility: generation, transmission, and distribution. Smart
grid serves as an interface between customers and utility power grid. Customers generate
real-time data regarding quality of supply and consumption of power received from the
power grid. The data generated is then transmitted to a control station via smart grid.
The control station analyzes data received from customers and effects controls in utility
to restore/maintain/ correct power supply to customers.
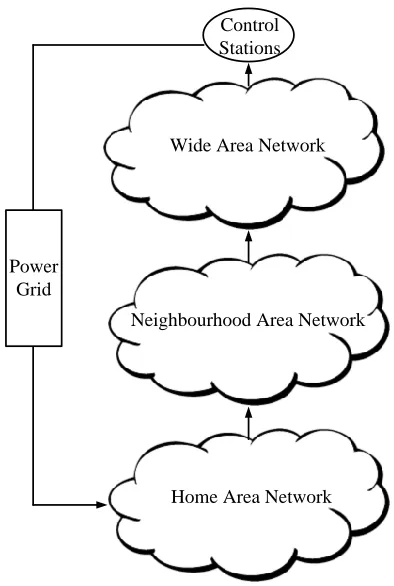
A conceptual hierarchical structure of smart grid is shown in Fig. 1.4 and consists of
three layers of communications with interfaces between layers. The first layer is the Access
Layer (AL) where data is gathered from customers or EDs. The network associated with
this layer is HAN, The data generated at AL is then passed on to Distribution Layer
(DL). The network associated at this layer is NAN. Finally, data from DL is passed on
to Core Layer (CL) and the network associated at this layer is WAN. The data from
the WAN is finally sent to the control station. In essence, smart grid is modeled as a
network consisting of these subnetworks, namely, HAN, NAN, and WAN. Thus, in this
thesis modelling and analysis of these three subnetworks of smart grid for critical data
Control Stations
Wide Area Network
Neighbourhood Area Network
Home Area Network Power
Grid
Figure 1.4: A conceptional model of smart grid.
Figure 1.5: A pictorial view of a smart grid.
Fig. 1.5 shows a pictorial view of smart grid. In order to avoid collision between
choice for all three layers since the standard [32] allows simultaneous use of three disjoint
spectrum bands: 2.4 GHz, 3.6 GHz, and 5 GHz. This standard is widely used in homes
to attain high-bandwidth connections and requires small amounts of electrical power.
This fact is a motivating factor in the modelling and analysis of smart grid (the HANs,
NANs, and WANs). The emphasis in this thesis is focused on establishing bounds on
critical communication delay between EDs and the control station.
1.3.1
Three Subnetworks of Smart Grid
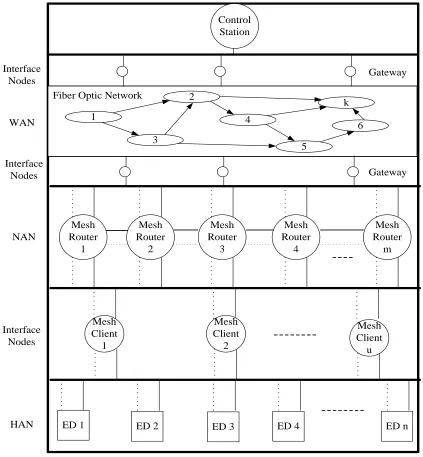
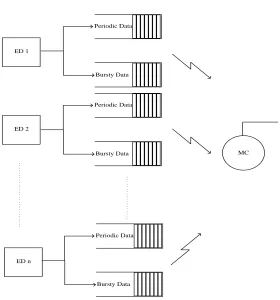
As expanded view of smart grid with three subnetworks with interface nodes is shown in
Fig. 1.6. The EDs in HAN subnetworks generate routine and critical data in the form of
report of packets and are required to be communicated to the control station via NAN and
WAN. The MCs serve as interface nodes between HAN and NAN. The MCs are assumed
to be connected to a set of MRs that are strategically located in NAN. In the NAN
subnetwork, packets collected from HAN subnetwork move from MR to MR to identified
gateways. The gateway nodes in NAN serve as interface nodes to WAN subnetworks.
The packet received in WAN then move through high-speed WAN to identified gateway
nodes in it which are connected to the control station. Thus, the gateway is WAN serve
as interface nodes to the control stations. The packets received at the control station are
Mesh Router 1 Mesh Router 2 Mesh Router 3 Mesh Router 4 Mesh Router m Control Station HAN Interface Nodes NAN Interface Nodes WAN Interface Nodes Mesh Client 1 Mesh Client 2 Mesh Client u
ED 1 ED 2 ED 3 ED 4 ED n 1 2 k 4 6 5 3 Gateway Gateway Fiber Optic Network
Figure 1.6: An expanded view of smart grid model.
In this generalized model, there are two possible ways to convey messages from
elec-trical devices to control stations: via wires or wirelessly, as shown in Fig. 1.6. Although
a generalized model of smart grid is shown, each subnetwork in it must be carefully
mod-elled to understand the parameters that influence the delay in the transmission of critical
data from EDs to the control station to effect corrective measures. These sub-networks
are modelled theoretically and by MATLAB simulator. MATLAB is a well-established
queueing theory and wireless/wired communication network models. Also, because most
of the work is based on communication models MATLAB is used for the entire thesis
and found it easier for the author and consistent. In this content, in the next section,
the objectives of this thesis are sketched.
1.4
Thesis Objectives
In this section, the problems addressed in the thesis with specific objectives are described;
with particular emphasis to critical data communication between EDs and the control
station.
1.4.1
Modelling and Analysis of Home Area Network (HAN)
In HAN, wireless communication is considered between EDs and their respective Mesh
Clients (MCs). In addition, the traffic from each ED is modeled as a combination of
rou-tine and critical data/reports. A single-server non-preemptive priority queuing system is
suggested to prioritize critical reports and transmit using Head-of-Line (HOL)
schedul-ing strategy. Mesh Clients (MCs) examine channel status to allocate the most available
subchannels that do not interfere with each other. After prioritization of packets that are
ready to be transmitted, each MC polls EDs in its domain to allocate maximum number
of available channels using: i) FDMA and ii) TDMA techniques, until all reports at EDs
have been transmitted. In the model, PCF is considered and an Interference model is
used to avoid collisions. The specific objectives are:
• To develop a probabilistic model to represent the multi-class traffic generated by
an ED in HAN and to use it as input to a single-server non-preemptive queueing
system with HOL scheduling strategy and to derive closed-form expressions for
average packet delay and mean buffer length for each class of traffic. Subsequently,
to generalize this result to the case of a set of EDs connected to an MC and to
identify parameters that influence critical packet/report delay in HAN.
• To present models of wireless HAN using: i) FDMA and ii) TDMA communication
• To develop theoretical upper and lower bounds on critical packet delay in HANs
as a function of i) average signal-to-noise ratio; ii) transmitted signal strength;
iii) random channel scale; iv) number of slots/bands; v) path loss component; vi)
distance between EDs and MC; vii) channel capacity and viii) channel bandwidth.
• To develop a software package to simulate wireless HAN and to compare analytical
results with simulations.
1.4.2
Modelling and Analysis of Channel-Aware MAC
Protocol for HAN
The wireless HAN can be modeled to have a single collision domain if deployed in DCF
mode for communication between a set of EDs and an MC. Further, if MIMO technology
is used further enhancements in critical packet delay and throughput can be achieved.
In this content, the specific objectives are:
• To use an Intelligent Distributed Channel Aware Medium Access Control
(IDCA-MAC) protocol for wireless HAN employing MIMO technology.
• To use an algorithm to recover lost packets due to a collision in the MIMO based
wireless HAN using IDCA-MAC protocol.
• To develop and implement wireless HAN in software for estimating and identifying
parameters that influence critical packet delay.
1.4.3
Modelling and Analysis of Neighbourhood Area Network
The NAN can be modeled as a set of strategically located MRs. The interface nodes,
MCs, from HAN are assumed to be connected to MRs via wired links. It is noted that
several MCs may be connected to each MR in HAN. The objective in NAN is to move
packets from MR to MR, one hop at a time until the packet reaches a gateway node
in NAN which serves as the interface node to WAN. There may exist several gateway
nodes in NAN. Since the packet has to traverse quickly to a gateway to minimizes delay,
the Voronoi tessellation concept is used to determine an efficient straight-line routing
between the location of each MR to its virtual bound edge which is smaller than the
distance to its vertex. For wireless transmission, each MR is responsible for sensing and
allocating channel based on modified Carrier Sense Multiple Access/Collision Avoidance
(CSMA/CA) and Code Division Multiple Access (CDMA) in Distributed Coordination
Function (DCF) mode. The Signal to Noise plus the Interference Ratio (SINR) plays an
important role in the allocation of channel for transmission of packet. Consequently, the
maximum number of packets that can be assigned in a time slot leads to minimal delay.
In a nutshell, the packet has to move from an MR to an MR in a straight-line path until
it is received at the gateway. The specific objectives are summarized below:
• To propose a Wireless Mesh Backbone Network (WMBN) model for NAN and to
specify communication protocol and routing strategy.
• To provide an end-to-end shortest path routing using the Voronoi tessellation for
transmissions of packets from MR to gateway node.
• To present an optimum solution for transmission of critical packets to gateway node
with minimal delay, subject to channel characteristics.
• To derive closed-form expressions for upper and lower bounds on delay as a function
of: i) signal-to-noise ratio, ii) signal interference, iii) critical packet size, iv) number
of channels, v) channel interference range, vi) path loss components, vii) channel
bandwidth, and viii) distance between MRs.
1.4.4
Modelling and Analysis of Wide Area Network
The WAN covers large areas and the distance between two nodes is typically measured
in kilometres. The links connecting nodes in WAN are high-speed cables. In this thesis,
the links are modeled as fiber optic cables. Optical communication provides up to 15
“superchannels” with high data rates. A Dynamic Fastest Routing Strategy (DFRS) is
presented in WAN for routing packets to minimize delay and traffic congestion. The
specific objectives are summarized below:
• To propose a topological design of WAN that adapts to faster routes to achieve
• To propose a Dynamic Fastest Routing Strategy (DFRS) for WAN with n number
of nodes and m number of links that enables the packets to choose the best routes
from source node to gateway.
• To derive a closed-form expression for critical packet delay in WAN as a function
of : i) traffic intensity, ii) capacity of fiber links, iii) number of links, iv) variance
of inter-arrival time, v) variance of service time, and vi) the latency of links.
1.5
Thesis Organization
The thesis is divided into seven chapters. In chapter 2, background on the thesis is
provided. It determines the key terms used in the thesis, and describes different
commu-nication components used in modelling smart grid.
In Chapter 3, a single-server non-preemptive queueing model is proposed and
an-alyzed for handling multi-priority traffic generated by EDs in smart grids. Closed-form
expressions for average packet delay for a two-class (high priority and periodic base)
traf-fic are derived and illustrated. The average packet delay is a function of i) critical packet
arrival rate; ii) service rate; iii) utilization factor; and iv) rate of arrival of periodic base.
It is shown using numerical results that the proposed model can be used to estimate
critical packet delay in the HAN subnetwork of smart grid.
In Chapter 4, a wireless HAN model is proposed to achieve minimum
communica-tion delay for transmission of critical packet from EDs to MC. The delay performances
of models using i) FDMA and ii) TDMA are presented. In the analysis, multi-path
re-ception and path loss exponent factor are also considered and closed-form expressions for
delay are derived. The critical packet delay is a function of the i)
Signal-to-Interference-Plus-Noise Ratio; ii) interferences; iii) number of critical packets; iv) size of the packet in
bits; v) number of scheduled channels; channel interference range; and vi) power
trans-mitted. Analytical and simulation results show that critical packet delay is smaller for
TDMA compared to FDMA.
Chapter 5 focuses on practical modelling of HAN. The objective is to propose a
model that allows simultaneous transmission of multiple packets at (higher/lower) rates
depending on condition of wireless channel between EDs and MC. A protocol named
with conventional MA-Aware protocol. The IDCA-MAC protocol and the entire model
for HAN are explained in detail and simulated using NS-2 simulator and MATLAB.
Simulation results show that critical packet delay increases by nearly 20% using
IDCA-MAC protocol compared to MA-Aware protocol.
In Chapter 6, a WMBN model is deployed for NAN and it serves as the distribution
layer that receives data from HAN and forwards it to the upper core layer. The main
objective is to move the packet from router to router until it reaches identified gateways
subject to the criterion of minimum delay. The routing suggested is based on selected
shortest path using Voronoi tessellation. CSMA/CA and CDMA protocols are
consid-ered and closed–form upper and lower bounds on critical packet delay are derived and
examined as functions of i) signal-to-noise ratio; ii) signal interference; iii) critical packet
size; iv) number of channels; v) channel interference range; vi) path loss components;
vii) channel bandwidth; and viii) distance between MRs. The results show that critical
packet delay to gateway using CDMA is lower compared to CSMA/CA protocol.
In Chapter 7, a fiber optic WAN is presented for transporting critical packets
received from NAN to a control station. A DFRS algorithm is used for routing critical
packets to control station. Closed-form expression for mean critical packet delay is derived
and is examined as a function of: i) traffic intensity; ii) capacity of fiber links; iii) number
of links; iv) variance of inter-arrival time; v) variance of service time; and vi) the latency
of links. It is shown that delay of critical packets to control station meets acceptable
standards set for smart grid.
In Chapter 8, the conclusions of this thesis and the conclusions from results obtained
are summarized. Also, areas for further research in the light of the needs of power
Chapter 2
Background
2.1
Introduction
In this chapter, an overview on smart grid with focus on its sub-networks communication
infrastructures is presented. Smart grids are comprised of several interconnected layers of
networks: i) HAN, ii) NAN, and iii) WAN. Two communication technologies are possible
to convey data between these sub-networks: wire-line and wireless. However, wire-line
communication technologies required new infrastructure compared to wireless
communi-cation networks. The idea of using mixture of these two technologies in modelling smart
grid is a common practice in studying sensitive end–to–end delay from consumers to the
control station.
This chapter identify key terms used in the research. Then, it determines the
assumptions considered in the thesis, describes different communication components used
in modelling smart grid, and discusses the effective communication technologies.
2.2
Key Terms
Many smart grid EDs are delay sensitive; therefore, a certain value of end-to-end delay
should be guaranteed. End-to-end delay is the main smart grid network issue that needs
to be investigated. However, it is tightly bounded by many other factors such as node
energy and network capacity. This research attempts to model a smart grid
communi-cation network to address these network challenges and issues. Therefore, during this
thesis, terms used need to be defined.
Throughput– This term is used to describe the successful of transmission of data
Delay – This term is used to describe the time takes for the data to be received
at receiver side and it measures in second (s).
Channel Capacity – This term is used to describe the measures capabilities of
carrying data over a channel.
Quality of Service – This term is used to describe the quality required in bits
over a wire-line network.
Channel Interference Range – This term is used to describe number channels
that are overlapping with an active channel.
Interference– This term is used to describe the action of distortion when two or
more users are transmitting simultaneously using one channel.
Routing – This terms is used to describe the forwarding data between nodes and
it can be proactive and reactive strategies.
Voronoi– This term is used to describe a technique that helps to find shortest
routing path to destination.
2.3
Network Models and Assumptions
The vision of proposing this work for a PhD thesis is to develop bounds on delay for
transmitting critical packets in smart grid to control station. The desire for this thesis
concurs with the expectations of those in the industry, which is that a model be able to
detect, predict and to provide timely service restoration to take further decisions on how
to isolate potential breaches.
Because delay of transmitting critical packets from electrical devices through smart
grids is important, modeling of end-to-end communication networks is taken into
con-sideration in this study. To study end-to-end communiation, the sum of queueing and
transmission delay factors at intermediate nodes must be considered. Thus, our work
seeks to derive closed-form expressions to evaluate the delay between EDs at the
cus-tomer side and the final destination of the control station.
For more detail, three parts have been considered:
1. Modeling and delay analysis for HAN.
3. Modeling and delay analysis of a wireline network in WAN.
In developing these interconnected networks, wireless delay factors (architecture
de-sign, scheduling, queueing, node transmission power, routing, limited bandwidth, number
of channels, and channel interference) are considered to obtain an example solution for
critical delay messages. This thesis work investigates wireless network delay performance
to support different critical time applications in a few steps. In the first step, an
ex-pression for delay from electrical devices to mesh clients/access points (APs) is obtained.
There are several devices located randomly at customers’ locations. Thus, a model of
wireless network that schedules different priority traffic arriving from electrical devices
to mesh clients is proposed. Then, calculation of the delay subject to queueing models,
signal interferences, the number of electrical devices, the number of channels, and the
power of node transmission is given. After that, it is assumed that the mesh client
con-veys messages to the mesh router without any loss because it is connected directly to the
mesh router. In a wireless mesh backbone network, the packet has to move from routers
to the identified gateway. So, in this step, the delay calculation is obtained between
mesh routers and the gateway, subject to Voronoi cell shapes, routing metrics, signal
interference, node power transmission, router locations, noise, number of mesh routers,
number of channels, and distance. To illustrate, two extreme real-world application
sce-narios are considered to find the acceptable upper and lower bounds on delay. Thus,
an analytical wireless network model is proposed for understanding the interconnected
wireless networks. To validate the work in the first part, a platform scenario
environ-ment is impleenviron-mented using the certified planning network professional, the MATLAB
simulator. The work will then be examined and analyzed by comparing theoretical work
with simulation results. Finally, this work presents a delay analysis to check whether the
performance analyzed meets the desired goals of wireless networks in smart grids, and
the results approached will be compared with the work obtained in the literature that
uses the same conditions.
In the following sub-sections, required communication components for smart grid
2.3.1
Generating Functions
Generating functions in probability theory play an important role for the sum of discrete
random variables [33]. This tools help in differentiating types of packets generated by
EDs and they are independents. Indeed, Probability Generating Function (PGF) provides
simple form of sums and limit of these random variables. If X and Y are two independents
distribution, PGF transforms a sum into a product to be handled. Therefore, the PGF
can be calculated as:
Gx(z) =
∞ X
k=0
pksk =E(zk), (2.1)
where pk = P(X = k), k = 0,1,2, ..., and X takes a finite number of values. For
example, the PGF of Poisson distribution is calculated as:
Gx(z) =
∞ X
k=0
pkzk =
∞ X
k=0
1
k!λ
ke−λzk =eλ(z−1) (2.2)
2.3.2
Wireless Interference
Different spectrum are considered to model the design. Therefore, no wireless interference
across different layers. Nevertheless, each individual layer has radio channel environment
effects such as path loss, channel overlap, and environmental noise. Inter-channel
in-terference issue is clearly explained in Fig. 2.1. Fig. 2.1 is an example of channels
1 6 11
2 7 12
3 8 13
4 9 14
5 10
2400 2410 2420 2430 2440 2450 2460 2470 2480 2495
915 MHz 2.4 GHz 5.8 GHz
84.5 MHz
26 MHz 125 MHz
ISM Band Channel
Number
Figure 2.1: IEEE 802.11 Channel Blocks.
In addition, wireless signal decay for the path loss asPr is defined in (2.3) see Fig.
2.2.
ED
o
r
r
t
P
P
r
MC
Figure 2.2: Example of how distance is considered.
Pr =Po( r ro
where ϕis the path loss.
Since all transmissions affect u node that using channel i, Fig. 2.3 and Fig. 2.4
illustrate the total effects of the power signal into ichannel.
u
) (t
P
re
f
P
(t)) (t
P
) (t
P
Figure 2.3: Powers signals decay effects to i channel into unode.
u Node j
j j
j
Figure 2.4: Transmissions around u node.
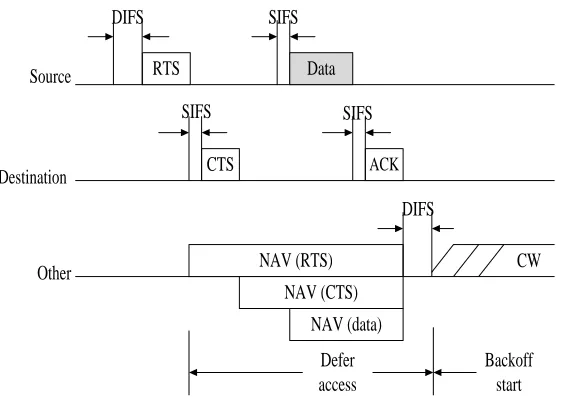
Indeed, IEEE 802.11 has two access schemes: random access control, which is
Distributed Coordination Function (DCF), and centralized access control, which is Point
Coordination Function (PCF). DCF has two working mechanisms: two way handshaking,
or four way handshaking.
2.3.3
Channel Capacity
In transmitting information at rate R, the channel is used everyt seconds. The channel
Kawadia [55] defined the notion of channel capacity and provided a mathematical model
by which it could be computed. The expression used to determine channel capacity can
be described as follows:
C=Blog2(1 +SN R), (2.4)
where B is channel bandwidth, SNR is the signal to noise ratio.
2.3.4
Routing and Communication
Straightline Routing algorithm is considered in this work because critical packetsn will
be forwarded along path close to the cells connected to other mesh routers. This path line
must traverse a sequence of cells until reaches gateway [71]. To avoid interference, upper
bound delay case is considered and conservative communication strategy is developed.
2.3.5
Communication Access Schemes
Even though each node in the network is required to forward packets to another node,
the communication in smart grid could carry periodic or bursty traffic. Therefore,
com-munications is required to estimates the channel condition and schedule to send priority
packets at a data rate not exceeding the channel capacity before periodic packets.
Trans-mission schedule schemes in each wireless local area network require adjustments to
differentiate between types of data.
2.3.6
Optical Communication
Optical fiber is the channel cables used for optical communications [84]. For instance, if
a group of nodes are connected with these cables, transmitter node will transmit
infra-red wavelengths with speed of light (3×10⁸) m/s to the receiver side. Both sides must
be equipped with modulation and demodulation techniques for signal conversion. In
addition, each cable is capable to handle up to 15 channels. The issue of routing is
2.3.7
MATLAB Simulator
In this thesis, the simulation model for studying delay performance of interconnected
network systems and scenarios is based on Matrix Laboratory (MATLAB) simulator
[34] that includes channel interference range, number of channels, and signal to
inter-ference ratio. MATLAB is a multi-paradigm numerical computing environment and
fourth-generation programming language. It is a commercially available simulator for
communication systems and networks. It has great flexibility in supporting design and
analysis of communication networks. Also, it supports devices, protocols, and
appli-cations. In comparison with other simulators, MATLAB has more detailed simulation
models, and provide better configuration as it has more advanced ability to simulate
physical links and antennas. It is built with various toolboxes such as MuPAD symbolic
engine and Simulink that add graphical multi-domain simulation and model-based
de-sign for dynamic and embedded systems. These properties give MATLAB the ability
to be adopted to smart grid communication networks and provide analysis for various
applications.
2.4
Smart Grid Components
A comprehensive model of smart grid must address consumers’ demand, economic
bal-ance of power generation and supply, and time required to respond to remotely located
consumers. Also, the model must effect successful operation, power transfers, and reduce
energy losses. In order to understand and fulfil these expectations, a general view of
power grid/smart grid is shown in Fig. 1.3 in which electrical devices (customers) are
served through three stages of utility: generation, transmission, and distribution. Smart
grid serves as an interface between customers and utility power grid. Customers generate
real-time data regarding quality of supply and consumption of power received from the
power grid. The data generated is then transmitted to a control station via smart grid.
The control station analyzes data received from customers and effects controls in utility
to restore/maintain/ correct power supply to customers.
This fact is a motivating factor in the modelling and analysis of smart grid (the
HANs, NANs, and WANs). The emphasis in this thesis is focused on establishing bounds