Research on the Method of Seed Water Content Measurement Based
on Electromagnetic Induction
Yixiong Lai1, *, Guoqiang Liu2, Zhongqi Li1, and Yunzhi Lin3
Abstract—There exist some problems that the water content of the test object cannot be reflected in real time. The detection time is too long, and the heating measurement method destroys the seed tissue for the traditional measurement of the water content of the seed. In this paper, a structure of single excitation coil to double receiving coils is proposed to measure the water content of the seed via electromagnetic induction. The relative permittivity of the seed can be obtained by the relationship between the amplitude ratio and the water content of the seed. First of all, according to the electromagnetic field theory, the functional relationship between the amplitude ratio of the electromotive force amplitude signals of the two receiving coils and the water content of the seed is established. Secondly, fifty sets of theoretical values of the mentioned model can be obtained through simulation analysis. Finally, comparative tests are carried out by using soybean seeds. The experimental results preliminarily verify the feasibility of the electromagnetic measurement method of the water content of the seed. The advantage of the proposed method is that the measurement of the water content of the seed is non-contacting.
1. INTRODUCTION
The seed water content refers to the percentage of water content in seeds (water content eliminated by 100 ∼ 105◦C) and seed quality [1]. Water is an important indicator and a necessary material to ensure the life activities of seed, and a necessary carrier for seed metabolism. The seed water content can directly reflect the physiological state of the seed. The higher seed water content can enhance the respiration of the seed [2], resulting in greatly reduced storage time of the seed, and lower seed water content can easily lead to the death of the seed. The most important thing is that seed water content is an important basis for seed pricing and quality classification [3]. Therefore, water content detection is of great significance.
There are many traditional methods to detect the water content of seeds. Generally, the method of water content is divided into direct and indirect methods [4]. The direct method refers to the method of directly detect. The indirect method is to determine the seed water content by establishing the relationship between the physical and chemical characteristics of seeds and their water content.
The direct methods include the direct drying method [5], decompression drying method [6], infrared heating method [7], toluene distillation method [8] and Karl fisher [9]. Due to the limitations of its own technology, it is unable to reflect the physiological condition of the test object in real time, while the test time is long. Moreover, it is impossible to directly dry and test the greasy seeds [10], and if the control of the heater is not well controlled, it is easy to damage the tissue of the seeds. Indirect methods include an electronic device of fast water content determination [11] and water content detection of radio frequency [12]. Although the test time of indirect methods is greatly shortened, it is not suitable
Received 30 July 2018, Accepted 2 October 2018, Scheduled 17 October 2018
* Corresponding author: Yixiong Lai ([email protected]).
1 College of Traffic Engineering, Hunan University of Technology, Zhuzhou 412007, China. 2 Institute of Electrical Engineering,
for seeds with high viscosity. The electromagnetic detection method adopted in this paper can detect seeds in real time efficiently in a non-contact way. The volume of water in the whole sample can be well reflected without heating the seed tissue, making the detection more rapid, simple and convenient.
Because the difference of water content in the seeds results in the change in the relative permittivity and amplitude ratio of the two receiving coils, an electromagnetic detection method is proposed in this paper to achieve detection of the seed water content.
2. PRINCIPLE OF SEED WATER CONTENT DETECTION SYSTEM
The detection of seed water content is realized by constructing a functional relationship among water content, relative permittivity and amplitude ratio. The principle includes Debye-cole model [13–17] which illustrates the relationship between water content and relative permittivity and electromagnetic field theory for establishing the relationship between relative permittivity and amplitude ratio.
2.1. Debye-Cole Model Principle
According to the classic Debye-cole model, the water content of seeds can be regarded as a hybrid dielectric model of seed body, bound water and free water. The relationship between the water content of seeds and the relative permittivity is studied. The model theory is as follows.
In the following formula (1): Ur is the volume ratio of seeds, f the relaxation frequency of free water, ε∗ the relative permittivity of seeds, σ the seed electrical conductivity, m0 the mass of mixed medium,m1 the drying mass,v1 the drying volume,m1 the seed water content,εr the seed noumenon permittivity, Ujw the volume of free water, andUb the volume of Bound water.
ε∗=Urεr+Ujw4.9 + 75
1 +if/18 −j 18σ
f
+Ub
2.9 + 55 1 +(if/0.18)
(1)
Formula (1):
Ur = m0
m1v1
εr = 1.7−1.74mg+ 6.16m2g Ujw = mg(0.55mg−0.076)
Ub = 4.64m2g/1 + 7.36m2g
2.2. Principle of Electromagnetic Detection
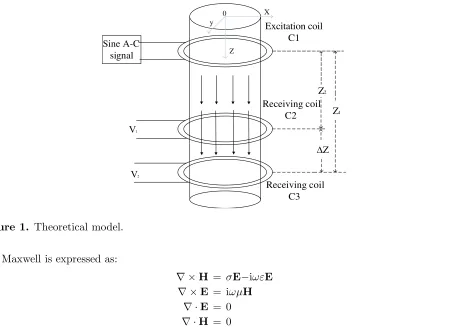
The experimental device adopts a coil detection structure for single excitation and double reception. An alternating magnetic field is generated in space when sine alternate current is introduced into the exciting coil. Under the action of the alternating magnetic field, an induced electric field in seed and a new magnetic field are generated. The new magnetic field is related to the water content of the seeds. At this time, the two receiving coils can detect varying electrical signals in space and create different electromotive forces due to the different positions of the two receiving coils. The near receiving coil is V1; the far receiving coil isV2; the ratio of the peak-to-peak amplitude of the two receiving coil is called amplitude ratio. Under the condition that the relative positions of the two receiving coils are fixed, the magnitude of the amplitude ratio is influenced by the variation of seed water content.
Based on electromagnetic induction, the detection of water content of the seed is shown in Figure 1. The exciting coil can be regarded as a magnetic dipole of which magnetic dipole moment changes with time according to the following rules [18–22].
M=M0e−iωt (2)
Formula:
M0 =I0Stn (3)
X Z Sine A-C signal V1 V2 y Z1 Z2 ΔZ 0 Excitation coil C1 Receiving coil C2 Receiving coil C3
Figure 1. Theoretical model.
Maxwell is expressed as:
∇ ×H = σE−iωεE (4)
∇ ×E = iωμH (5)
∇ ·E = 0 (6)
∇ ·H = 0 (7)
In formula, H is the magnetic field strength, E the electric field strength, μ the magnetic conductivity, andεthe permittivity.
The electrodynamic operation can be used to find the field strengthHZ [23, 24] at theZ from the field source on the vertical axis of the magnetic dipole.
HZ= M0
2πZ3(1 +ikZ)e−
i(ωt−kZ) (8)
Make: k=ω με−iωσ =a+bi
a=ω
μ1 2
ε2+σ2
ω2 +ε
; b=ω
μ1 2
ε2+σ2
ω2 −ε
(9)
Seeds are non-conductive medium, when the displacement current dominates:
a=ω√με (10)
Non-conductive magnet, μ = μ0 = 4π ×10−7 (H/m), ε = ε∗ε0; ε is the permittivity; ε∗ is the relative permittivity; ε0 = 10−9/36π (F/m), aand bare expressed as:
a = ω
c
√
ε∗; c= 3×10⁸m/s (Speed of light in vacuum) (11)
b = σ
2
μ ε = 188
σ
√
ε∗ (12)
Formula (8) can be written as an expression of amplitude YL:
YL= M0
2πZ3e
In order to eliminate the influence of directly coupled signals and measure the relative values of amplitude or phase in practice, a three-coil structure with single transmission and double reception is designed.
ΔY =
Z2
Z1 3
e−bΔZ
(1 +bZ1)2+ (aZ1)2 (1 +bZ2)2+ (aZ2)2
(14)
In the formula, ΔY is the amplitude ratio received by two coils;Z1 and Z2 are the source distance from the near receiving coil and the far coil to the transmitting coil respectively; ΔZ is the distance between the two receiving coils.
Therefore, the relative permittivity of the seed ε∗ can be inverted to obtain the water content of the seed by measuring the amplitude ratio of the two receiving coils according to formula (14).
3. SIMULATION ANALYSIS
In order to verify the correctness of the theory above, we carried out a simulation analysis based on the classical Debye-cole mode and single-excitation dual-receiver electromagnetic detection principle. The system characteristics analysis has been conducted in the MATLAB environment, and the research takes the relative permittivity as the intermediate variable to examine the relationship of the change of seed water content caused by this variable on the output amplitude ratio of the detection system.
The water content, relative permittivity and amplitude ratio of the seed have different dimensions, which will affect the results of the data analysis. Therefore, this paper uses the min-max standardization to normalize the data. The conversion function is as follows:
C= S−min
max−min
C serves as the normalized processing value;S is the original value of the sample data; max is the maximum value of the sample data; min is the minimum value of the sample data.
0 0.1 0.2 0.3 0.4 0.5 0.6 0.7 0.8 0.9 1
0 0.2 0.4 0.6 0.8 1
Amplitude ratio
Water content
0 0.1 0.2 0.3 0.4 0.5 0.6 0.7 0.8 0.9 10
0.2 0.4 0.6 0.8 1
Relative permittivit
Relative permittivity Amplitude ratio
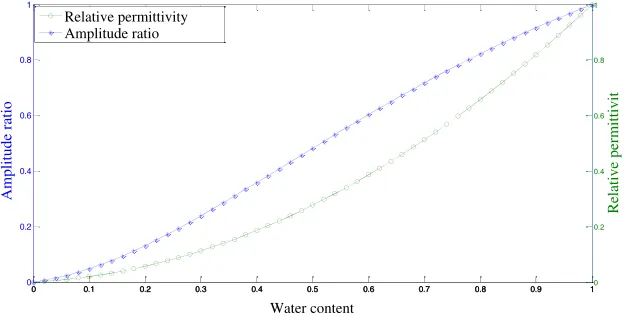
Figure 2. Theoretical analysis value.
Figure 3. Relationship between seed water content and amplitude ratio and relative permittivity.
4. EXPERIMENTAL RESEARCH
4.1. Introduction to the Experimental Platform
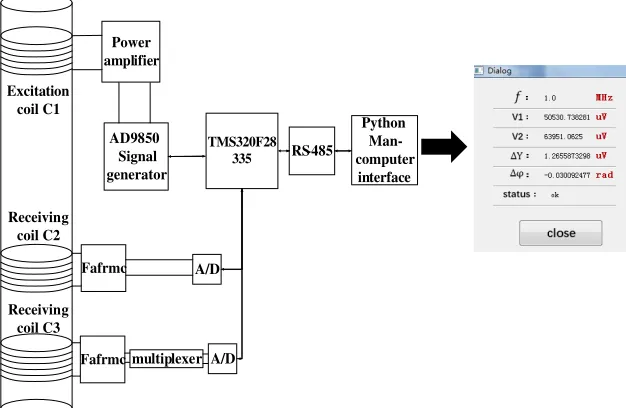
The structure of the electromagnetic induction type detection system for seed water content is shown in Figure 4. The system uses the TMS320F28335 as the control core. The sinusoidal excitation source at the signal generation end is the AD9850 signal generator, of which maximum operating frequency is 125 MHz. The excitation source combines low-pass filter and power amplifier circuit to produce alternating electromagnetic field in excitation coil C1.
At the receiving end of the signal, when the receiving coils C2 and C3 sense the magnetic sensing signals, the detection signals can be obtained by the power amplifier and down-conversion modulation circuit, respectively, and the obtained detection signals contain the relevant information inside the measured object. The received two-way detection signal obtains the amplitude change information through a phase detector composed of a control platform based on the TMS320F28335. This information can be displayed in the program by connecting the information to the python man-computer interface via a RS-485. The field experimental apparatus is shown in Figure 5.
TMS320F28 335 RS-485
A/D
Python Man-computer
interface Power
amplifier
AD9850 Signal generator
Fafrmc
Fafrmc
A/D Excitation
coil C1
Receiving coil C2
Receiving coil C3
multiplexer
Figure 5. Experimental apparatus.
4.2. System Deviation Experiment
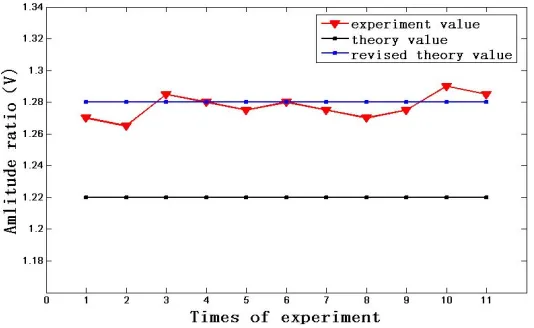
We used the JA5003 professional electronic scale to weigh 346 g standard soybeans, poured into the detection system, and measured the 11 sets of amplitude ratio values. After the RS-485 is connected to the python man-computer interface, the amplitude ratio is recorded. After the measurement data is stable, the amplitude ratio is recorded for one time.
Figure 6 reflects the comparison of the 11 sets of experimental data measured with the theoretical value of the system when measuring the standard soybean (13% water content), and the water content remains unchanged. The material of the experimental device itself has a certain relative permittivity value, so the theoretical theory needs to be corrected. The waveform and amplitude ratio of the voltage of the two receiving coils are basically stable, which indicates that the system has a good detection effect. According to formula (15), the standard deviation between the two receiving coils is 0.022 that is at a lower value.
T =
n
i=1
(xi−x¯)
√
n−1 (15)
whereT: Standard deviation; n: Number of samples;xi−x¯: Deviation between a certain data and the sample mean.
4.3. Soybeans Experiment
Twelve groups of 346 g of soybeans are weighed and immersed in distilled water. Table 1 shows the data that have been recorded during the experiment by setting the 12 groups of soybean seeds with different water contents through the length of the immersing time. The change of water content is obtained by measuring with the JA5003 electronic scale and calculation. The conductivity of the standard seeds is directly obtained by DDS-318 produced by Shanghai Yidian. The experiment also needs to take the dilution of conductivity into account, because 10% increase in seeds’ water content leads to a 10% decrease in seeds’ electrical conductivity. The calculation formula (16) for each change in water content is as follows:
water content = m1−m2 m1
(16)
Formula (16): m1: fresh weight;m2: dry weight.
Table 1. Experimental data.
No PWC (%) EAR FWC (%) RWC (%)
1 13 1.27 22 12
2 19 1.33 29 19
3 24 1.36 32 22
4 29 1.42 39 29
5 27 1.40 37 27
6 23 1.35 31 21
7 18 1.31 27 17
8 15 1.28 23 13
9 21 1.33 29 19
1 25 1.37 33 23
11 2 1.33 29 19
12 15 1.28 24 14
Explain: PWC: Project water content EAR: experiment amplitude ratio FWC: forward water content RWC: revised water content
Table 2 gives the results of normalization of the experimental data according to the conversion function. In the experiment, since the order of the seed water content has been slightly adjusted, it is possible to produce two cases of large and small sizes fluctuating up and down. On the one hand, it is verified in the experiment whether the detected amplitude ratio will fluctuate. On the other hand, the actual water content of the seeds were compared with the water content calculated from the amplitude data obtained from the experiments to verify whether the seed water content detected by the experimental platform is accurate.
Figure 7(a) shows the variation curve of the amplitude ratio measured by the system. It can be seen from Figure 7(a) that the fluctuation of amplitude ratio is the same as the arrangement trend of the seed water content. The peak value appears in Groups 4 and 10, which is consistent with the arrangement condition of the seed water content design by the experiment.
Table 2. Data normalization.
No PWC NDC AR
1 0 0 0
2 0.37 0.4 0.2
3 0.68 0.6 0.6
4 1 1 1
5 0.87 0.86 0.8 6 0.62 0.53 0.5 7 0.31 0.26 0.2 8 0.12 0.06 0.1
9 0.5 0.4 0.4
1 0.75 0.66 0.7 11 0.43 0.4 0.3 12 0.12 0.06 0.1 Explain: PWC: Project water content
NDC: Normalization relative permittivity AR: Experiment amplitude ratio
(a)
(b) (c)
Figure 7(c) is a graph that shows the normalized relationship among seed water content, amplitude ratio and relative permittivity in the fluctuation experiment. It can be seen visually that the fluctuation of seed water content is obvious. When the amplitude value and relative permittivity are the largest, the corresponding seed water content is also the largest, and the fluctuation of the amplitude ratio is within the range of theoretical value. The results of the feasibility experiment and the theoretical analysis show extremely high consistency, and the experiment gives a tentative proof of the feasibility of this new electromagnetic method.
5. CONCLUSION
This paper discusses a single-excitation and dual-receiver three-coil detection method based on magnetic induction and applies it to the detection of seed water content.
(1) The results of the study tentatively indicate that the change of seed water content can be obtained by electromagnetic detection method, and the relationship between the amplitude ratio and seed relative permittivity can be used to detect the seed water content. After removing the standard deviation of the platform itself, the standard deviation of the system is 0.022.
(2) Different from the traditional detection of seed water content based on direct method or indirect method, it has solved the problem of “injury effect” caused by heated destruction of seed tissue in the past, long detection time and the impossibility of real-time detection and tracking. Furthermore, in the future, further research on the influence of the excitation signal, coil radius, the relative position of the coil and the impact of other factors on this method can be taken.
REFERENCES
1. Li, S. X., Y. Y. Gao, Y.-H. Li, and S. X. Tian, “Method of measuring seed water content and its expectation,” Seed, Vol. 29, No. 10, 2010.
2. Singh, P., M. Flury, and W. F. Schillinger, “Predicting seed-zone water content for summer fallow in the Inland Pacific Northwest,” Soil& Tillage Research, Vol. 115, No. 5, 94–104, USA, 2011. 3. Matthews, S., E. Noli, I. Demir, M. Khajeh-Hosseini, and M. H. Wagner, “Evaluation of seed
quality: From physiology to international standardization,”Seed Science Research, Vol. 22, No. S1, S69–S73, 2012.
4. Chinese Academy of Sciences, “Chinese Flora 12,” Chinese Flora Editorial Committee, 56–528, Beijing, 2000.
5. Hnijenstei, R. and D. N. NYdam, “Comparison of oven moisture test at 130◦C vs 103◦C,” Seed Science and Technology, Vol. 30, No. 3, 102–106, 2002.
6. Ling, J., Z. Teng, H. Lin, and J. Li, “Estimation and fusion method for moisture content detection based on loss on drying method,” Chinese Journal of Scientific Instrument, Vol. 39, No. 2, 2018. 7. Chinese Academy of Sciences, “Chinese Flora 24,” Chinese Flora Editorial Committee, 56–528,
Beijing, 2000.
8. Chinese Academy of Sciences, “Chinese Flora 12,” Chinese Flora Editorial Committee, 52–86, Beijing, 1988.
9. Fischer, W., S. Beil, and K. D. Krenn, “Karl-Fischer-Reaktion in dimethylsulfoxid,” Advanced Synthesis & Catalysis, Vol. 337, No. 1, 266–268, 1995.
10. Du, G. P., Seeds and Seed Physiology, 110–113, Peking University Press, Beijing, 2009.
11. The International Seed Testing Association,International Rules for Seed Testing, China Agriculture Press, Beijing, 2017.
12. Berbert, P. A. and M. Berbertviana, “Meyer and schilz function to estimate common bean seed water content evaluated by radiofrequency,” Scientia Agricola, Vol. 64, No. 6, 569–574, 2007. 13. Grosse, C., “A program for the fitting of Debye, Cole-Cole, Cole-Davidson, and Havriliak-Negami
14. Itolikar, A. B. and M. L. Kurtadikar, “Microwave measurements of dielectric properties of corn vegetation at C-band and comparison with Debye-Cole dual dispersion model,” J. Microw. Optoelectron. Electromagn. Appl., Vol. 16, No. 4, 954–965, 2017.
15. Khamzin, A. A., R. R. Nigmatullin, and I. I. Popov, “Microscopic model of a non-Debye dielectric relaxation: The Cole-Cole law and its generalization,” Theoretical & Mathematical Physics, Vol. 173, No. 2, 1604–1619, 2012.
16. Li, Z., J. Y. Zeng, Q. Chen, and H. Y. Bi, “The measurement and model construction of complex permittivity of vegetation,” Science China Earth Sciences, Vol. 57, No. 4, 729–740, 2014.
17. Boyarskii, D. A., V. V. Tikhonov, and N. Yu. Komarova, “Model of dielectric constant of bound water in soil for applications of microwave remote sensing,”Progress In Electromagnetics Research, Vol. 35, 251–269, 2002.
18. Cruciani, S. and V. D. Santis, “Cole-Cole vs Debye models for the assessment of electromagnetic fields inside biological tissues produced by wideband EMF sources,”Electromagnetic Compatibility, 685–688, 2012.
19. Liu, X.-F., B.-Z. Wang, and S.-Q. Xiao, “Electromagnetic subsurface detection using subspace signal processing and half-space Dyadic Green’s function,”Progress In Electromagnetics Research, Vol. 98, 315–331, 2009.
20. Von Brzeski, J. G. and V. von Brzeski, “Topological intensity shifts of electro-magnetic field in lobachevskian spaces. Olbers paradox solved, deep space communication, and the new electromagnetic method of gravitational wave detection,” Progress In Electromagnetics Research, Vol. 43, 163–179, 2003.
21. Qu, X., Y. Li, G. Fang, and H. Yin, “A portable frequency domain electromagnetic system for shallow metal targets detection,”Progress In Electromagnetics Research M, Vol. 53, 167–175, 2017. 22. Peng Q., Q. H. Li, and Q. Zhang, “Application status of the technology of logging while drilling,”
Advanced Materials Research, 1010–1012, 1650–1653, 2014.
23. Wei, B. J., G. J. Zhang, and Q. Liu, “Recursive algorithm and accurate computation of dyadic Green ’s functions for stratified uniaxial anisotropic media,” Science in China: Series F, Vol. 51, No. 1, 63–80, 2017.