Compression Method for Handwritten Document
Images in Devnagri Script
Smita V. Khangar, Dr. Latesh G. Malik
Department of Computer Science and Engineering, Nagpur University G.H. Raisoni College of Engineering, Nagpur, India
Abstract— Document image compression is used for speedy communication over the network. In the context of document image compression most of the work is done for printed textual images. But compression of handwritten text images, very small work is reported. The textual form of images is different from the conventional form of images. Document image analysis and compression used for preserving, storing and retrieval of the data. In this paper compression methodology for handwritten Indian language document images is presented. The handwritten images are in gray level It is based on the foreground text extraction followed by the connected component labelling. Experimental results are done with the various person handwritten images scanned at different resolution. The results are showing good compression ratio.
Keywords—Indian language, Devnagri script, Gray level document, Handwritten text.
I. INTRODUCTION
In today’s world most of the documents are available online. Thus the popularity of the digital libraries is increasing day by day. Thus there is increasing demand of digital libraries. Many of digital libraries scan the document and publish the data over the web. Hence storage of these documents must occupy less space and must be in compressed form. Most of the time the documents publishing over the web are in printed form like books, magazine etc. In the context of Indian language handwritten documents may preserve the ancient data. Thus digital form of such data is important. The printed text compression strategy is available for Indian language document. For the handwritten text compression in Indian language there is no work reported yet. The handwritten text compression for language like Chinese, Arabic is available in literature. The absence of any compression methodology for handwritten document images in the context of Indian language is the motivation behind the present work.
As mentioned earlier the paper focuses on the compression of handwritten gray level Devnagri document images. The rest of the paper is organized as follows: Section 2 gives the brief overview of previous work on textual image compression. Section 3 describes the properties of Devnagri script. Section 4 presents the proposed compression method. Section 5 shows the experimental results followed by the conclusion.
II. RELATED WORK
Literature survey shows the distinct approaches used for the text image compression. Methods are varying for the compression of printed text images and handwritten text
images. Our survey based on the domain research papers applied to international script. Based on the literature survey and the study of textual image compression, some of the major approaches are discussed here. The methods are mainly based on pattern matching. Compression of textual images are based on pattern matching and substitution and soft pattern matching [1].Some of them are based on separation of foreground and background of an image.
TABLEI
ANALYSIS OF ENCODING TECHNIQUES Sr.
No. Approach
Compression
method Based on
1 Soft Pattern
matching JBIG 2 Word clustering
2
Pattern matching and substitution
Residue Coding
Prototype library and symbol locations
3
Separation of foreground and background
Run length encoding
Layered coding on each layer
III.DEVNAGRI SCRIPT OVERVIEW
Hindi is the most commonly used language after Chinese and English language. Devnagri script is a basic script for many of the language in India such as Hindi, Marathi and Sanskrit. In Devnagri all letters are equal. There is no concept of capital or small letters. Devnagri script is identified by different zones. They are mainly upper zone, middle zone and lower zone. The upper zone and middle zone are separated by the header line called shirorekha. All neighbouring characters are touched through the Shirorekha results in formation of the connected component. The upper zone contains the modifiers and lower zone contains the lower modifiers [3]. Devnagri script is written from left to right. The basic set of symbol consists of 34 consonants (vyanjan) and 18 vowels (svar). Figure 1 shows the different zones of the Devnagri script.
Fig. 1 Different zones of Devnagri text
Upper zone shows the information above the headline. Middle zone shows the characters. Lower zone shows the other consonants. A syllable is formed with vowel or any combination of the consonants and vowel. Figure 2 shows the sample set of non-compound set of characters.
Fig. 2 Non-compound characters in Devnagri script
IV.COMPRESSION METHOD
Input to the system is scanned handwritten gray images. Initially the document is written with different person handwriting and images are stored in the .jpg format. The major steps are: i) scan input document image in gray, ii)
image reading in terms of pixels and extraction of foreground and background pixel values, iii) Foreground image extraction, iv) connected component analysis, v) merging of the connected components, vi)components shifting.
A. Extraction of pixel values
For this purpose scanned image is stored in the buffer and read the pixel values. Calculate the height and width information of an image. The RGB values of an image are noted. These values are important for calculating the pixel values of the foreground text and background of an image. Our approach uses the images with the uniform background. Pixel values for large size images are much more. For this purpose we calculate the foreground pixel values of a sample image shown in fig. 3 .The image is having resolution 100 dpi (dot per inches) and having dimension 148×65. The corresponding values of the foreground pixels are shown in fig. 4. The pixel values for large size images are much more. Thus in a small output window entire values can not be shown.
Fig. 3 Sample image for extraction of pixel values
B. Foreground Image Extraction
Binarization is one of the important pre-processing step in document image analysis. Many of the techniques are found in literature and mainly apply to gray scale domain. With the frequent use of colour documents, binarization and foreground-background separation has a fine difference between them. Although the binarization essentially does the separation of foreground and background in document images [5].
Since handwritten text does not shows the characters similarity like printed text, same matter varies from person to person. Also the evaluation of foreground extraction method is depending upon the accuracy of extracting lines and words from the input images. Printed documents shows very well contrast background and foreground which is not in case of many handwritten manuscripts. Sometimes the text is written on pen or pencil it may not generate the contrast background
In this step based on the pixel values of an image, threshold value is calculated. The stored image pixel values are labelled as foreground and background pixels. They are separated from the buffer and replaced by the white and black colour respectively. These foreground and background values are then written to the output buffer which further stored as an output image on the disk. The image shown in figure 5 is original image scanned at 150 dpi. The image size is 361 KB. After extracting the foreground image the size is reduced to 181 KB.
C. Connected Component Analysis
After extracting foreground text image connected component analysis algorithm is executed to detect the connected components of word images. For textual image connected component analysis gives the components which generates the punctuation marks from the text or sometimes generate the parts of text images. Our approach uses the 8-connectivity two pass connected component analysis algorithm [7]. In first phase algorithm scans the image row by row (forward scan) and assigns provisional labels. In second step these provisional labels are replaced by final labels of its equivalent information. From the foreground text image all the connected components are detected. For the image shown in figure 6 total 174 connected components are detected. For all the labelled components its image extent positions are calculated. Image extent position is calculated from top-left boundary to bottom-right corner boundary. From all the labelled components some components are parts of other components. Such components are required further processing. Such types of labelled subcomponents are merged with parent components. This merged components image are written to the disk.
Fig. 5 Original image
Fig.6 Foreground image
D. Component Shifting
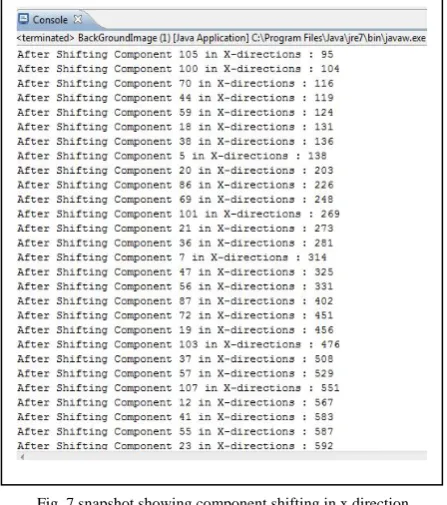
After extracting foreground image for further compression the components are shifted in x and y directions. By doing this foreground image will compress further. Shifting of connected components in x direction is done by calculating the distance between the word images. It should not greater than two pixel position. If is so then shift the component in x direction. For shifting the components in y direction top and bottom space is removed. The distance between the top row and first connected component label row is calculated. By this amount of pixel position value it is shifted in y direction. Fig. 7 and fig.8 shows the output window for components shifting in x and y direction respectively.
Fig. 7 snapshot showing component shifting in x direction
portion with the left and top of original image. It is noted that while writing this image to the disk left, top, height and width of the output image i.e. all image extent boundary will not exceed the original image width and image height. By doing so the final compressed image is generated having size 175 KB. Figure 9 shows the final compressed output image.
Fig. 8 snapshot showing component shifting in y direction
Fig. 9 Final output image
V. EXPERIMENTS
The images are written from the various person handwriting on A4 size paper. The textual matter is written with the different tip of pen. Some images are written with the small tip and some with broad tip pens. The images are scanned at resolution 100 to 300 dpi(s). As mentioned earlier handwritten text varies from person to person.
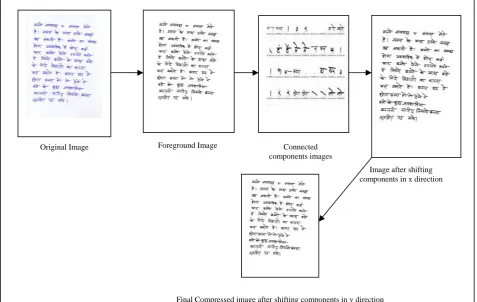
Fig. 10 Compression of document image
Original Image Foreground Image Connected
components images
Image after shifting components in x direction
TABLEII
IMAGE STREAM SIZES STATISTICS
The images are written with different tip of pens results in different strokes marks. Thus there is variation in size of the different image. The experiments are done with images written in Hindi and Marathi. The results are showing good compression ratio. Figure 10 shows the different steps of complete process. Table II shows some sample image statistics for experimental purpose.
VI.CONCLUSION
The paper focuses on the compression of handwritten gray level document for Indian language. In the context of Indian language, preservation of handwritten text material
is important. Most of the work is done for printed text. This is one of effort towards compression of handwritten text in Devnagri script. The results are showing the effectiveness of the scheme accordingly.
REFERENCES
[1] Y.Ye and P.Cosman, “Dictionary design for text image compression with JBIG2”, IEEE Transaction on Image Processing, vol.10(6),pp.818-828,2001.
[2] P.G.Howard, “Text image compression using soft pattern matching” , The Computer Journal, vol. 40,pp.146-156,1997. [3] U.Garain, S.Debnath, A.Mandal, B.Chaudhari, “Compression of
Scan Digitized Printed Text : A Soft Pattern Matching Technique”, ACM Symposium on Document Engineering, pp.185-193, Nov .2003 .
[4] X.Danhua, B.Xudong, “High efficient compression strategy for scanned receipts and handwritten documents”, IEEE International Conference on Information and Engineering,2009, pp.1270-1273. [5] U.Garain, T.Paquet, L.Heutte, “On foregrond-background
separation in low quality document images”, International Journal of Document Analysis, vol. 8(1),pp.47-63,2006.
[6] J.Kittler,J.Illingworth, “Threshold selection based on simple image stastics”,Computer Vision Graphics and Image Processing, vol.30,pp.125-147,1985.
[7] Kenshu Wu, Ekow Otoo, Kemji Suzuki J. “Optimizing two pass connected component labeling algorithms”, Journal of Pattern analysis, 2009.
Image
No.
Resol-ution
Original size
Foregroun d image
size
Compress ed image
size
1 150 dpi 361 KB 181 KB 175 KB
2 300 dpi 1.06 MB 407 KB 372 KB
3 300 dpi 1.09 MB 302 KB 252 KB