Scholarship@Western
Scholarship@Western
Electronic Thesis and Dissertation Repository
12-10-2013 12:00 AM
Specimen Size Effect on Shear Behavior of Loose Sand in Triaxial
Specimen Size Effect on Shear Behavior of Loose Sand in Triaxial
Testing
Testing
Tarek Omar
The University of Western Ontario
Supervisor
Abouzar Sadrekarimi
The University of Western Ontario
Graduate Program in Civil and Environmental Engineering
A thesis submitted in partial fulfillment of the requirements for the degree in Master of Engineering Science
© Tarek Omar 2013
Follow this and additional works at: https://ir.lib.uwo.ca/etd
Part of the Civil and Environmental Engineering Commons
Recommended Citation Recommended Citation
Omar, Tarek, "Specimen Size Effect on Shear Behavior of Loose Sand in Triaxial Testing" (2013). Electronic Thesis and Dissertation Repository. 1755.
https://ir.lib.uwo.ca/etd/1755
This Dissertation/Thesis is brought to you for free and open access by Scholarship@Western. It has been accepted for inclusion in Electronic Thesis and Dissertation Repository by an authorized administrator of
(Thesis format: Integrated Article)
by
Tarek Omar
Graduate Program in Civil and Environmental Engineering
A thesis submitted in partial fulfillment of the requirements for the degree of
Master of Engineering Science
The School of Graduate and Postdoctoral Studies The University of Western Ontario
London, Ontario, Canada December 2013
ii
Abstract
Triaxial tests are widely used to determine the behavior and strength characteristics of soils
without due attention to the differences in specimen size. Several drained and undrained
monotonic triaxial compression shear tests are performed on three different specimen sizes
of the same sand to investigate the influence of specimen size and scale effect on the shear
behavior. The test results indicate that the behavior of loose sand is strongly influenced by
the specimen size, with larger specimens exhibiting a stiffer behavior during isotropic
compression, and mobilizing smaller shear strengths and effective friction angles. Triaxial
testing also involves many sources of errors that could significantly affect shear strength
parameters if not corrected. Extensive errors are investigated and it is found that negligence
in making corrections accounting for these errors will result in an overestimation as much as
42% and 15 degrees in the critical shear strength and critical state friction angle,
respectively. Furthermore, the measured critical state parameters and shear strengths are
employed to compare the static and seismic slope stability of an earth embankment dam,
calibrate a critical state soil constitutive model, study the soil behavior under shallow
foundations, and evaluate liquefaction triggering and failure of retaining structures. The
results show that all of these analyses are significantly affected by the strength parameters of
the same soil determined from different specimen sizes. While using small size samples for
determining shear strength parameters might result in un-conservative design, the choice of
a large sample size is consequently a more accurate representation of soil strength conditions
and field deformations.
.
Keywords
iii
Co-Authorship Statement
This thesis has been prepared in accordance with the regulations for an Integrated-Article
format thesis stipulated by the School of Graduate and Postdoctoral Studies at the University
of Western Ontario and has been co-authored as:
Chapter 2: Effects of Errors and Multiple Corrections on Triaxial Compression Testing of Loose Sands
All the experimental work was conducted by Tarek Omar under close supervision of Dr.
Abouzar Sadrekarimi. A paper co-authored by Tarek Omar and Abouzar Sadrekarimi is
going to be submitted to the ASTM Geotechnical Testing Journal.
Chapter 3: Specimen Size Effect on Triaxial Compression Testing of Loose Sands
All the experimental work was conducted by Tarek Omar under close supervision of Dr.
Abouzar Sadrekarimi. A paper co-authored by Tarek Omar and Abouzar Sadrekarimi is
going to be submitted to the Canadian Geotechnical Journal.
Chapter 4: Influence of Triaxial Specimen Size in Engineering Practice
All the experimental work was conducted by Tarek Omar under close supervision of Dr.
Abouzar Sadrekarimi. A paper co-authored by Tarek Omar and Abouzar Sadrekarimi is
iv
Acknowledgments
The research work presented in this thesis has been carried out under the supervision of
Assistant Professor Abouzar Sadrekarimi, who has been a constant source of support and
helpful guidance throughout the research and preparation of this dissertation. I would like to
thank him for his consistent support and valuable advices.
I would also like to thank the graduate students in the department of civil and environmental
engineering for sharing the knowledge and most of all, for being my friends as well to the
administrative and laboratory staff, and to the machine shop staff at Western Engineering.
Finally, my deepest appreciation goes to my parents, my wife, my beloved daughter Heba,
v
Table of Contents
Abstract ... ii
Co-Authorship Statement... iii
Acknowledgments... iv
Table of Contents ... v
List of Tables ... viii
List of Figures ... ix
List of Symbols ... xiii
Chapter 1 ... 1
1 Introduction ... 1
1.1 Statement of the Problem ... 1
1.2 Research Objective ... 3
1.3 Thesis Outline ... 4
Chapter 2 ... 5
2 Effects of Errors and Multiple Corrections on Triaxial Compression Testing of Loose Sands ... 5
2.1 Introduction ... 5
2.2 Physical Index Properties of Tested Sand ... 7
2.3 Testing Equipment ... 8
2.3.1 Enlarged Platens... 8
2.3.2 Mould Design... 12
2.3.3 Triaxial Test System ... 14
2.4 Triaxial Compression Testing Procedure... 17
2.4.1 Sample Preparation ... 17
2.4.2 Saturation Stage ... 21
vi
2.5 Corrections for Triaxial Compression Tests ... 25
2.5.1 Correction of Volume Change during Saturation ... 26
2.5.2 Correction of Volume Change due to Membrane Penetration ... 29
2.5.3 Effects of Enlarged Platens on Stress-Strain Response ... 34
2.5.4 Area Correction due to Specimen Deformation Pattern ... 36
2.5.5 Correction for Bedding Error ... 40
2.5.6 Correction for Membrane Resistance ... 42
2.6 Comparison of Corrections ... 45
2.7 Conclusion ... 47
References ... 49
Chapter 3 ... 52
3 Specimen Size Effect on Triaxial Compression Testing of loose sands ... 52
3.1 Introduction ... 52
3.2 Experimental Methodology ... 57
3.3 Triaxial Test Results: ... 59
3.3.1 Isotropic Compression Response ... 59
3.3.2 Undrained shear behavior ... 61
3.3.3 Drained shear behavior ... 65
3.4 Influence of Specimen Size on Effective Stress Paths... 70
3.5 Influence of Specimen Size on Effective Friction Angle ... 72
3.6 Influence of Specimen Size on Critical State Parameters ... 76
3.7 Influence of Sample Size on Undrained Shear Strength ... 78
3.8 Discussion ... 84
3.9 Conclusion ... 87
vii
4 Influence of Triaxial Specimen Size in Engineering Practice ... 92
4.1 Introduction ... 92
4.2 Experimental Data ... 94
4.3 Sample Size Effect on Liquefaction Triggering Analysis ... 95
4.4 Sample Size Effect on the Calibration of a Soil Constitutive Model ... 96
4.5 Sample Size Effect on Consolidation Settlement ... 104
4.6 Sample Size Effect on Slope Stability Analysis ... 105
4.6.1 Static Slope Stability Analysis ... 107
4.6.2 Seismic Slope Stability Analysis ... 107
4.7 Sample Size Effect on Bearing Capacity of Shallow Foundations ... 109
4.8 Sample Size Effect on Lateral Earth Pressure ... 113
4.9 Conclusion ... 115
References ... 116
Chapter 5 ... 119
5 Summary and Conclusions ... 119
Appendix A ... 122
Appendix B ... 126
viii
List of Tables
Table 2.1: Triaxial test data in this study ... 25
Table 2.2: Void ratio change due to flushing and backpressure saturation ... 28
Table 2.3: Effect of area correction on the critical strength ... 39
Table 2.4: Effect of bedding error on the axial displacement ... 42
Table 2.5: Effect of membrane resistance on the deviator stress ... 45
Table 2.6: Summary of the applied corrections and percentage improvement for triaxial shear testing on very loose sand... 46
Table 3.1: Summary of the specimen sizes used in different studies ... 52
Table 3.2: Specifications of triaxial tests of this study ... 59
Table 3.3: Summary of 'yield and 'cs for different specimen sizes ... 74
Table 3.4: Effect of specimen size on critical state parameters ... 77
Table 3.5: su(yield)and su(critical)from undrained triaxial compression tests... 79
Table 3.6: Summary of cs, su(yield)/p'c, su(cs)/p'c, and IB for the undrained triaxial tests ... 83
Table 4.1: Summary of NorSand calibration parameters... 100
Table 4.2: Factor of safety against static and seismic loads of different specimen sizes .... 108
ix
List of Figures
Figure 2.1: Average particle size distribution of the Barco 71 sand ... 7
Figure 2.2: Schematic diagrams of the enlarged platens for different sample sizes ... 11
Figure 2.3: Photos of the enlarged platens used for different sample sizes ... 11
Figure 2.4: Schematic diagram of the tamper assembly ... 12
Figure 2.5: Schematic diagrams and photos for split moulds used for different sample sizes ... 14
Figure 2.6: Schematic diagram of the triaxial testing system. ... 15
Figure 2.7: Triaxial shear apparatus used in this study ... 16
Figure 2.8: Steps of specimen preparation using moist tamping method ... 21
Figure 2.9: Effect of membrane penetration (after K.H. Head 1992) ... 29
Figure 2.10: Effect of D50 on the normalized membrane penetration (Sivathayalan and Vaid 1998) ... 32
Figure 2.11: Effect of lubricated end platens on the stress-strain and excess pore pressure responses in triaxial compression tests on loose sand ... 35
Figure 2.12: Effect of lubricated end platens on the deformation patterns of loose sand specimens in triaxial compression tests at 30% axial strain ... 38
Figure 2.13: Effect of area correction method on the stress- strain response in undrained triaxial compression tests on loose sand ... 38
Figure 2.14: Effect of membrane resistance on the stress- strain response of undrained triaxial compression tests on loose sand ... 44
x
Figure 3.3: Undrained stress – strain behavior of different specimen sizes in triaxial
compression tests of loose sand ... 63
Figure 3.4: Undrained stress – axial displacement behavior of different specimen sizes in
triaxial compression tests of loose sand ... 64
Figure 3.5: Excess pore water pressure developed during undrained triaxial compression
tests on different specimen sizes of loose sand ... 64
Figure 3.6: Drained stress – strain behavior of different specimen sizes in triaxial
compression tests of loose sand ... 66
Figure 3.7: Drained deviator stress – axial displacement behavior of different specimen sizes
in triaxial compression tests of loose sand ... 67
Figure 3.8: Volumetric strain response during drained triaxial compression tests on different
specimen sizes of loose sand ... 69
Figure 3.9: Volumetric dilatancy response during drained triaxial compression tests on
different specimen sizes of loose sand ... 69
Figure 3.10: Effect of specimen size on drained effective stress paths ... 71
Figure 3.11: Effect of specimen size on undrained effective stress paths ... 71
Figure 3.12: Effect of specimen size on 'mob in undrained triaxial compression shear tests of loose sand ... 73
Figure 3.13: Effect of specimen size on 'mob in drained triaxial compression shear tests of loose sand ... 73
Figure 3.14: Effect of pc and Drc on 'yield and 'cs mobilized in undrained triaxial
xi
Figure 3.15: Effect of specimen size on 'yield and 'cs from undrained triaxial compression tests of loose sand ... 76
Figure 3.16: Effect of specimen size on the CSLs from both drained and undrained triaxial
compression tests of loose sand ... 77
Figure 3.17: Effect of specimen size on su(yield)and su(critical)in undrained triaxial
compression tests on loose sand ... 79
Figure 3.18: Effect of specimen size on the changes of: (a) su(yield)/p'c and (b) su(critical)/p'c mobilized in undrained triaxial compression tests of loose sand with cs ... 80
Figure 3.19: Effect of specimen size on: (a) 'yield and (b) 'cs mobilized in undrained triaxial compression tests of loose sand with respect cs ... 81
Figure 3.20: Effect of specimen size on the changes of: (a) su(yield)/p'c and (b) su(critical)/p'c mobilized in undrained triaxial compression tests of loose sand with cs/cs ... 81
Figure 3.21: Effect of specimen size on: (a) 'yield and (b) 'cs mobilized in undrained triaxial compression tests of loose sand with respect to cs/cs ... 82
Figure 3.22: Effect of specimen size on IB in undrained triaxial compression tests of loose sand with respect to: (a) cs, (b) cs/ ... 83
Figure 3.23: Changes in (a) su(%) and (b) '(degrees) with percent changes of specimen diameter (D) from su and ' mobilized in a 70 mm loose specimen ... 86
Figure 4.1: IL of different specimen sizes from undrained triaxial compression tests ... 96
Figure 4.2: Critical state lines for different specimen sizes in (a) void ratio – p' diagram, and
(b) stress path plot ... 98
Figure 4.3: Plastic hardening modulus as a function of for each specimen size ... 99
xii
with NorSand predictions ... 101
Figure 4.6: Comparison of Ottawa sand behavior in triaxial shear tests on 50 mm specimens
with NorSand predictions ... 101
Figure 4.7: Comparison of Ottawa sand behavior in triaxial shear tests on 38 mm specimens
with NorSand predictions ... 102
Figure 4.8: Effect of specimen size on modeling sand behavior with NorSand ... 103
Figure 4.9: Effect of specimen size on su(critical)/p'c and su(yield)/p'c estimations by the NorSand soil model... 103
Figure 4.10: Isotropic compressibility of different specimen sizes ... 104
Figure 4.11: Pre-failure cross section of LSFD (Seed et al. 1975) ... 106
Figure 4.12: Specimen size effect on factors of safety (FOS) from static and seismic slope
stability analyses ... 109
Figure 4.13: Bearing capacity factor as a function of specimen size ... 113
xiii
List of Symbols
Ao Initial specimen cross-sectional area
Ac Specimen cross-sectional area after consolidation
Ae Specimen cross-sectional area at end of the test
Af Specimen cross-sectional area at peak strength
As Specimen cross-sectional area after saturation
B Skempton’s pore water pressure parameter C Contraction behavior
CO2 Carbon dioxide
CPT Cone penetration test CSL Critical state line
Cc Coefficient of curvature
Cu Coefficient of uniformity
cc Compression index
cv Coefficient of consolidation
D Drained shear
Drc Relative density at end of consolidation
Drs Relative density at end of saturation
Dmax Maximum particle size
D50 Mean particle size
D10 Particle size corresponding to 10% finer soil-size particles
dc Diameter of specimen after consolidation
ds Diameter of specimen after saturation
d1/3 Average specimen diameter within the middle third portion
dmax Maximum diameter of specimen after shear
Em Young’s modulus of membrane material
Ew Modulus of water
e Void ratio
emax Maximum void ratio
emin Minimum void ratio
xiv
cs
es Void ratio at end of saturation
FOS Factor of safety
Gs Specific gravity of solid particles
H Plastic hardening parameter
HRDT Hall radial displacement transducer h Height of specimen
IL Instability line
IB Undrained brittleness index
Ir Shear rigidity number
Ka Coefficient of active lateral earth pressure
LSFD Lower San Fernando Dam
LVDT Linear variable displacement transducer NCL Normal compression line
N Bearing capacity factor M Stress ratio at the critical state p’ Mean effective stress
p’c Consolidation stress
q Deviator stress
qult Ultimate bearing capacity
SPT Standard penetration test su Shear strength
su(yield) Undrained yield shear strength
su,(cs) Undrained critical shear strength
t50 Time required to reach 50% degree of consolidation
t90 Time required to reach 90% degree of consolidation
tm Thickness of the rubber membrane
UD Undrained shear
Un Maximum under compaction ratio
u Pore-water pressure
xv
o
Vs Specimen volume after saturation
tc Dilatancy parameter
σ1 Total vertical stress
σ'1 Effective vertical stress
σ3 Total confining stress
σʹ3 Effective confining stress
ψ Critical state parameter 'cs Critical state friction angle
'mob Mobilized friction angle
'yield Yield friction angle
a Axial strain
r Radial strain
v Volumetric strain
̇ Shear strain rate
δa Axial shear displacement
Poisson’s ratio
e Change in specimen void ratio
hs Change in specimen height during saturation
q Membrane resistance σ3 Increment of cell pressure
Δu Excess pore water pressure
ve Volume change due to membrane penetration
vs Volume change during saturation
λcs Slope of CSL
Chapter 1
1
Introduction
1.1 Statement of the Problem
Triaxial shear tests are widely used to determine the strength characteristics of soils subject
to a wide range of stress paths and loading conditions. Although some researchers (Marsal
1967; Marachi et al. 1969; Ladd 1978; Scott 1987; Been and Jefferies 1991; Hu et al. 2010;
Chew et al. 2011) have studied the effect of sample size on the behavior of cohesionless
soils using triaxial testing, the impact of specimen size on the shear strength parameters and
design is largely overlooked in engineering practice. Previous investigations of
specimen-size effects in triaxial tests have mainly focused on the testing of dense sands (Scott 1987;
Been and Jefferies 1985; Garga 1988; Hazarika et al. 2010) or coarser granular materials
containing large particles such as rockfill (Marsal 1967; Marachi et al. 1969; Seif el Dine
2009; Hu et al. 2010) which require the construction of a large-sized triaxial apparatus.
Therefore, there is need for additional experimental work in order to investigate the
influence of sample size on the shear behavior of very loose sands and develop new
guidelines for specimen size in triaxial testing. A comprehensive and systematic
experimental program of several static triaxial compression shear tests is conducted to
investigate the sample size effect on the consolidation, drained and undrained shear behavior
of loose Ottawa sand specimens. Three different specimen diameters of 38, 50, and 70 mm
of the same sand were tested and sheared up to 30% strain using an automated stress path
triaxial compression testing system.
Reliability of shear strength parameters considerably depends on the accuracy of the triaxial
evaluated by many researchers (Bishop and Henkel 1962; Lade 1977; Baldi and Nova 1984;
Seed 1987; Kramer and Sivaneswaran 1989; Zhang 1997), there is need to recognize the
errors that can significantly affect test results, and techniques or corrections to account for
these errors. In addition it is required to identify how the corrections interact and if it is
required to account for all the corrections and determine the correction that has the most
significant effect on the sand shear behavior. Therefore, extensive errors investigation is
accomplished for the triaxial test results in this study to improve the estimation of shear
strength parameters. As non-uniform deformation at the critical state is an important factor
that may affect the behavior of sand as well, enlarged and lubricated end platens are used to
minimize non-uniformity caused by end restraint which required the design and construction
of a set of special moulds and platens.
Most practicing engineers are unaware of the significant effect of specimen size.
Accordingly, this phenomenon is either totally neglected in using laboratory test results on a
small specimen in engineering design and analysis, or laboratory test results are simply
distrusted and the design or analysis is based on empirical interpretations of in-situ field
tests (e.g. SPT or CPT) which could also involve a wide range of uncertainties. Therefore,
there is need to investigate the influence of specimen size and scale effect from laboratory
triaxial shear testing on engineering analysis and design of soil structures. The measured
critical state parameters and shear strengths are used to compare the static and seismic slope
stability of Lower San Fernando dam as a typical geometry of an embankment dam that
underwent liquefaction flow failure, calibrate NorSand model as a critical state soil
constitutive model that is widely used to predict soil behavior, study the soil behavior under
shallow or strip foundations, and evaluate liquefaction triggering and failure of retaining
1.2 Research Objective
The main objective of this research is to examine the effect of sample size in triaxial shear
testing on the deformation and strength behavior of very loose sand. Other objectives of this
work include:
1. Design and construct moulds and enlarged platens for each specimen size to
accommodate the radial expansion of the specimen at large shear strains and reduce
specimen non-uniform deformation and bulging and ensure uniform stress
distribution within the specimens.
2. Investigate the errors accompanying triaxial testing and study their influence on the
sand shear behavior and determine the most significant error.
3. Investigate the influence of specimen size on engineering analysis and design of soil
structures.
4. Develop a new guideline for specimen size in triaxial testing.
Specially-designed moulds and platens were constructed in the machine shop of Western
University. The sand used in this study is clean uniformly-graded quartz fine sand (SP as per
ASTM D2487-11 Unified Soil Classification System) from Ottawa, Illinois. The
experimental work included 24 strain – controlled, drained and undrained, monotonic
1.3 Thesis Outline
This thesis has been prepared in "Integrated-Article" format. It is organized into 5 chapters.
A brief description of the following four chapters is as follows:
Chapter 2: evaluates the significance of applying corrections to the triaxial test results and
presents the improvement achieved on the shear strength parameters. The specimen
preparation method and the applied triaxial procedure as well as the design of especially
split moulds and enlarged platens are described in this chapter. The influence of using free
end on the deformation pattern is also presented.
Chapter 3: investigates the specimen size effect on drained and undrained sand shear
behavior. The influence of specimen size on the isotropic compression behavior, the
mobilized friction angles, the critical state parameters, and the yield and critical strengths are
discussed. The relation between the measured shear strength parameters with the critical
state parameter () is presented. The undrained brittleness index (IB) is also utilized to
compare the degree of strain-softening and liquefaction flow exhibited for different
specimen sizes.
Chapter 4: implements the results obtained from testing different specimen sizes in evaluating the liquefaction triggering resistance, comparing the static and seismic slope
stability of an earth embankment dam, calibrating a critical state soil constitutive model,
investigating the soil behavior under shallow or strip foundations, and finally evaluating the
stability analyses of retaining structures.
Chapter 5: presents a brief summary of the performed research works accompanied with
Chapter 2
2
Effects of Errors and Multiple Corrections on Triaxial
Compression Testing of Loose Sands
2.1 Introduction
Laboratory shear tests conducted to understand sand behavior have been improved with the
continuous development of the testing devices. There are certain principle requirements that
should be accounted for in the devices used to measure the shear behavior of sands in order
to obtain reliable results. The most commonly used devices for measuring the shear behavior
of laboratory soils are direct shear, triaxial, and ring shear devices.
Reliability of shear strength parameters significantly depends on the accuracy of the triaxial
shear testing results. Therefore, it is important to recognize the factors that can affect test
results, and techniques to reduce or correct for these factors. In fact, the basic principles and
limitations of triaxial testing have been admirably described by Bishop and Henkel (1962)
and reevaluated by several researchers (Lade 1977; Baldi and Nova 1984; Seed 1987;
Kramer and Sivaneswaran 1989; Zhang 1997). Furthermore, the effects of non-uniform
deformations on test results have been widely investigated (Rowe and Barden 1964; Bishop
and Green 1965; Finno et al. 1996). The non-uniform deformation at large strains, often
required to achieve critical state conditions, can develop due to the formation of shear bands
or the effect of end restraint. The increase in the initial modulus of elasticity and peak shear
strength is a product of end restraint effects caused by the use of rough ends and therefore,
researchers supported the use of free ends with lubricated sample-platen interfaces which
In addition, triaxial shear tests involve many sources of errors that could significantly affect
test results if not corrected. The most significant errors in the experimental investigation of
granular soils are the variation of specimen cross- sectional areas during loading, and the
volume change due to back-pressure saturation or membrane penetration resulting from the
variation in the confining stress (Zhu and Anderson 1998). In addition, the bedding error
resulting from using layers of latex membranes in the enlarged and lubricated end platens
technique should be considered in the measured axial deformation (Sarsby et al.1980). The
membranes’ resistance to the applied axial and radial stresses may also influence the
measured shear strength.
In this study, monotonic triaxial compression tests are performed on very loose Ottawa sand
specimens to determine the volumetric response and shear behavior for different specimen
sizes. Specially-designed moulds and platens are used to reduce end restraint effects and
improve specimens’ uniform deformation. Corrections for the aforementioned errors were
made to the test results to account for the volume change due to back pressure saturation
(ASTM D4767-11) and membrane penetration (Baldi and Nova 1984), axial deformation
due to bedding error (Sarsby et al. 1980), stress correction due to membrane resistance
(ASTM D7181-11), and the change of specimen cross-sectional area during shear (Garga
and Zhang 1997). The specimen preparation method and the applied triaxial procedure are
described in this chapter. The design of especially split moulds and enlarged platens are
presented as well as the influence of using free end technique on the deformation pattern and
shear strength. The significance of applying corrections to the triaxial test results and the
improvement achieved on the shear strength parameters are discussed and evaluated. It is
worth mentioning that as with any other laboratory testing procedure there are a number of
loose sands and at large shear displacements. These factors, as well as the steps which are
taken in this experimental procedure to correct for these challenges are discussed in the
following paragraphs.
2.2 Physical Index Properties of Tested Sand
Clean, uniformly-graded Ottawa sand (with a commercial name of “Barco 71”) with round
to sub-round particle shapes is used in the tests of this study. The large hardness of the
quartz particles minimizes the amount of particle crushing experienced during loading.
Sieve analysis was performed and the average particle size distribution is presented in
Figure 2.1. The sand is classified as Fine Sand, SP as per the ASTM D2487 standard
procedure (the unified soil classification system). The mean grain size (D50) was determined as 0.22 mm and the calculated coefficient of uniformity (Cu) and coefficient of gradation
(Cc) is 1.71 and 1.07, respectively. Specific gravity of the sand particles (GS), and maximum and minimum void ratios of respectively 2.65, 0.821, and 0.487 were measured following
the ASTM-D854 and D4253 standard procedures, respectively.
Figure 2.1: Average particle size distribution of the Barco 71 sand
0 20 40 60 80 100
0.01 0.1 1 10
F
in
e
r
b
y
W
e
ig
h
t
(%
)
2.3 Testing Equipment
2.3.1
Enlarged Platens
Enlarged and lubricated end platens are introduced in the experimental work of this study to
minimize strain localization and bulging deformation in the specimens. A sand specimen is
supposed to deform as a right circular cylinder throughout a triaxial compression shearing
tests, but it often exhibits bulging deformation at its middle portion as a result of friction at
the specimen boundaries (Bishop and Green 1965). Specimen bulging produces non-uniform
stresses and strains in a triaxial test which could significantly affect the strength,
strain-softening, pore pressure or volume change behavior of a soil specimen particularly at large
deformation associated with critical states.
Different methods have been pursued to reduce the effect of specimen boundaries, but the
lubricated end platens developed by Rowe and Barden (1964) has been the most effective
method (Zhang 1997). In this method, the platens are covered with layers of lubricated (with
vacuum grease) latex discs. The vacuum grease among the latex discs allows nearly
frictionless sliding of the discs to minimize end restrains. Using an X-ray imaging technique,
Kirkpatrick and Belshaw (1968) investigated the strain field within specimens of dry sand in
triaxial compression tests performed with and without lubricated end platens. They observed
that rough end platens promoted the development of rigid cones at the specimen ends, which
are mainly responsible for global geometric softening, while lubricating the platens
prevented the formation of these cones and maintained the uniformity of specimen’s
deformation up to large strain levels. Zhang and Garga (1997) studied the influence of
lubricated platens on the stress-strain behavior of loose and dense Unimin and Ottawa sands.
pore pressures than tests conducted using regular end platens. They also observed that the
lubricated ends can significantly reduce end restraint in dense samples, while the
improvement achieved by lubrication becomes smaller in loose samples.
In the experiments of this study, enlarged end platens are employed to accommodate the
radial expansion of the specimen at shear strains of up to 30%. As illustrated in Figure
2.2(d), the lubricated ends consist of two sheets of 0.3 mm thick rubber discs which are
separated with a thin layer of high vacuum silicone grease. The rubber discs are cut to the
specimen diameter with a central hole cut to the diameter of the porous stone to allow
drainage. An additional layer of high vacuum silicon grease was smeared on the rubber discs
in order to provide a smooth and frictionless sliding on the specimen platens.
The slenderness or the height to diameter (h/d) ratio of a specimen is another factor that
could affect the bulging deformation. Bishop and Green (1965) illustrate that specimens
with a slenderness ratio of 1 and lubricated ends could deform uniformly during drained
loading, while specimens with a slenderness ratio of 2 with lubricated ends displayed a
bulging deformation similar to the samples with regular ends. Accordingly, specimen
bulging at large shear strains is largely reduced with smaller slenderness ratios (Hettler and
Vardoulakis 1984).
Three different specimen diameters of 38, 50, and 70 mm with a slenderness ratio (h/d) of 1
were tested in this study. Trial tests on specimens with a slenderness ratio of 2 exhibited
significant bulging at large shear strains, regardless of whether the specimen ends were
enlarged and lubricated or not. Therefore, it was decided to adopt a slenderness ratio of 1
along with lubricated and enlarged end platens to minimize the effects of specimen end
This is particularly necessary for critical state testing which require large shear strains.
Accordingly, specially designed split moulds, to accommodate the enlarged platens, were
constructed and used for preparing the specimens. As a result, although bulging was
significantly reduced resulting in more homogeneous specimen deformations, it never
completely disappeared. At this stage, a wide experimental investigation was made to
further minimize specimen bulging and it was determined that rigid stainless steel platens
would further reduce bulging. This was likely because the hard quartz sand particles
microscopically penetrated into the soft acrylic platens producing additional end friction.
This micro-penetration was eliminated by using hard stainless steel platens and therefore
reduced end friction. Stainless steel end platens were subsequently replaced with the acrylic
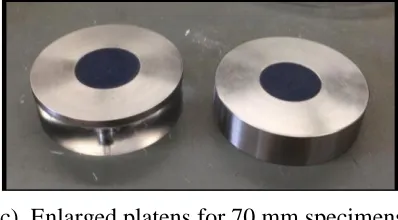
platens. Figures 2.2 and 2.3 show the schematic diagrams and photos of the enlarged end
platens used in the experimental work.
(c)Enlarged platens for 70mm specimens (d)Free end arrangement
Figure 2.2: Schematic diagrams of the enlarged platens for different sample sizes
(a)Enlarged platens for 38 mm specimens (b)Enlarged platens for 50 mm specimens
(c) Enlarged platens for 70 mm specimens
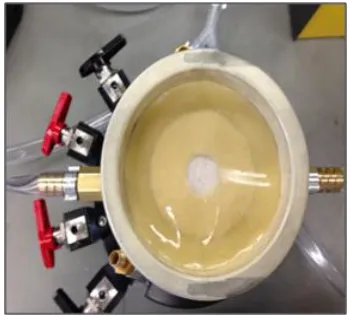
2.3.2
Mould Design
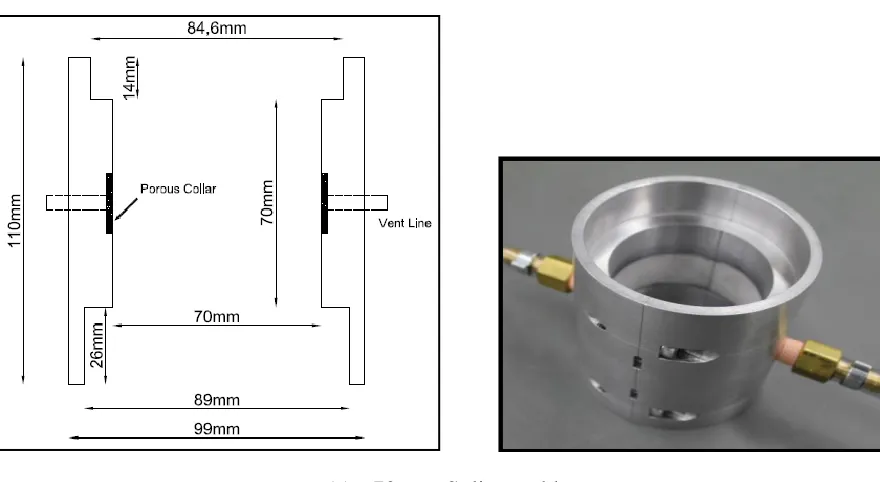
Aluminum split moulds were constructed with internal diameters and heights equal to those
of the three specimen sizes. The top and bottom ends of the moulds were bored larger to
accommodate the enlarged specimen platens. Vacuum vent was constructed at the mid
height of each mould to provide suction intended to hold the membrane tight against the
wall during the moist tamping process. Collars that conformed to the top of each mould
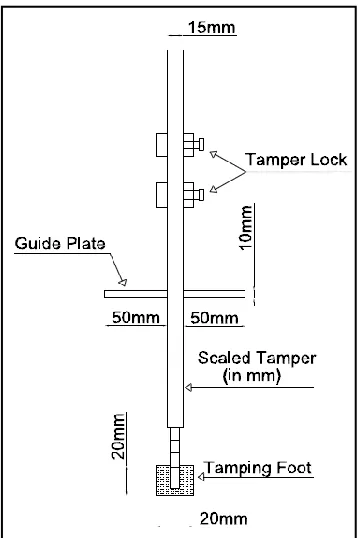
were constructed to allow sufficient space for tamping the sample top layers. A special
tamper assembly consisting of a tamping rod scaled in millimeters covered with a clear
resin, tamping foot, guide plate, and tamper lock was designed and constructed for tamping
the moist sand at predetermined layer thicknesses. Figure 2.4 shows the design details of the
tamper assembly. Figure 2.5 shows the schematic diagrams and photos of the different
mould sizes used in the experimental work.
(a) - 38 mm Split mould
(c) - 70 mm Split mould
Figure 2.5: Schematic diagramsand photosforsplit moulds used for different sample sizes
2.3.3
Triaxial Test System
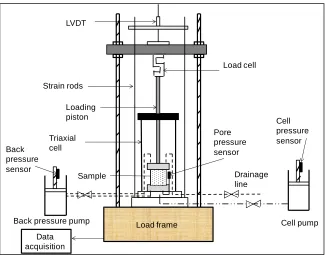
The triaxial tests of this research were conducted using an automated stress path triaxial
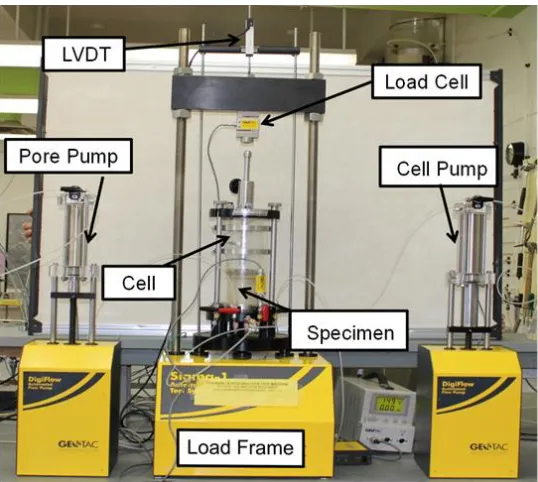
compression testing system (SIGMA-1TM 5K model) manufactured by GeoTac, Texas, USA. The main components of this apparatus include a triaxial cell, a loading frame, two
electromechanical pressure pumps, and a data acquisition system. The system also includes
an external load cell, deformation sensor, and three fluid pressure sensors. Figure 2.6
provides a brief schematic diagram of the triaxial testing system.
The application of the axial load was provided by the loading frame which can apply the
axial load in displacement-control (up to a rate of 25.4 mm/minute) or load-control (up to a
maximum axial load of 9,000 N) modes. The load measurements were taken externally by a
load cell placed on the loading frame. All tests of this study were conducted using the
shear was measured externally by a linear variable displacement transducer (LVDT) on the
loading ram of the triaxial cell.
Figure 2.6: Schematic diagram of the triaxial testing system.
The two electromechanical pumps (referred to as the cell and pore pressure pumps) are used
to control and measure the volume and pressure of the cell fluid and specimen’s pore water.
The cell pump has a capacity of 180 ml and drives the water into the triaxial cell through a
connection at the cell base to generate the desired confining pressure. A pressure sensor with
a maximum capacity of 2000 kPa is attached to the pump to measure the applied confining
pressure. The pore pump has a capacity of 80 ml and drives the water into the specimen
through the top and bottom platens to apply the back pressure saturation. A pressure sensor
with a maximum capacity of 2000 kPa is attached to the pump to measure the applied back
pressure. Both pumps could be operated under volume-control or pressure-control modes.
LVDT
Strain rods
Loading piston
Load cell
Cell pump Sample
Load frame
Cell pressure sensor
Drainage line
Data acquisition Back
pressure sensor
Back pressure pump
Pore pressure sensor Triaxial
The volume and water pressures in both pumps are measured at a resolution of 1 mL and 0.1
kPa, respectively and transferred by an analog to digital data-controller to the computer. A
separate water pressure sensor with a maximum capacity of 1400 kPa is also connected to
the specimen through the bottom platen to measure the pore water pressure within the
specimen for example during backpressure saturation or undrained shear. All sensors were
calibrated at the commencement of the testing program. Calibration factors of each sensor
are provided in appendix (A).
The triaxial testing system includes a series of interconnected modules which control the cell
and pore pressure pumps as well as the load frame. All the modules are connected to a
computer for command, feedback and data acquisition. The system records the output
voltages of the sensors, which are then converted to engineering units using the calibration
factors for further analysis and interpretation. Figure 2.7 shows a photo of the triaxial
device.
2.4 Triaxial Compression Testing Procedure
In the triaxial tests of this study, the cylindrical specimen is sealed in a water-tight rubber
membrane and enclosed in a cell in which it could be subjected to stress changes made in
two stages: (1) an increase in the cell pressure resulting in an equal all-round change in
stress and (2) an increase in axial load resulting in a change in deviator stress. Monotonic
triaxial compression shear tests were conducted according to the procedure described below.
2.4.1
Sample Preparation
There are several laboratory preparation methods (moist tamping, air pluviation, and water
pluviation) that are generally used to produce sand samples. Moist tamping is the most
popular laboratory method to prepare very loose sand specimens and consists of placing
sand layers of specified thickness into a mould and tamping each layer with a flat tamper.
The air pluviation method consists of pluviating dry sand through air into a sample mould
from a constant fall height. Different soil densities are achieved by changing the fall height
and tapping the sides of the specimen mould. Water pluviation method is similar to the air
pluviation method except that the sand is pluviated through de-aired water rather than air.
It is difficult to ensure a uniform density distribution in reconstituted laboratory specimens
of sand, and moist tamping is the only method that achieves relatively high void ratios in the
laboratory (Gilbert and Marcuson 1988). The moist tamping method is the method in which
the surface tension between the soil particles is employed to maintain a very loose sand
structure (Castro 1969). Because of this tension between particles, unsaturated sands can be
maximum void ratio of the dry sand obtained from the recommended ASTM D2049
procedure (Ishihara 1993).
In order to obtain very loose specimens that would exhibit entirely contractive and
strain-softening behavior and achieve the critical state condition, all samples with different sizes
were prepared by the moist tamping method. In the traditional method of the moist tamping
technique, the specimens are prepared in a number of layers of equal dry weight and each
layer is compacted to the same target density. This results in the lower layers of the
specimen becoming denser than the global specimen density as compaction of each
overlying layer also slightly compacts the underlying layers (Sadrekarimi and Olson 2012).
Therefore, in order to minimize the density variations and void ratio non-uniformities within
the specimens, the under compaction technique introduced by Ladd (1978) was employed to
achieve a relatively uniform density throughout the specimen height. This method involves
the compaction of each layer slightly looser than the target global unit weight, with the
bottom layer compacted the least and the top layer compacted the most, so that the final unit
weight of each layer, even with the effects of compaction of the successive overlying layers,
would be equal to the target global unit weight.
Very loose cylindrical specimens were prepared in diameters of 38, 50, and 70 mm with a
length to diameter ratio of 1 to reduce non-uniformity at larger strains. The procedure used
to prepare a moist tamped specimen is illustrated in Figure 2.8. This procedure is briefly
described as follows:
(1) the designated split mould was secured around the bottom platen over the pedestal of the
triaxial cell and the membrane was gently stretched and folded around the mould and a
inside the mould; (2) two latex membranes of the same specimen diameter and with 0.3 mm
thicknesses were smeared with a thin layer of silicon grease and placed over the bottom
platen in order to reduce soil friction at the bottom of the specimen; (3) the dry sand was
weighted and mixed properly with de-aired water at a water content of 5% by weight; (4) the
moist unit weight and void ratio of each layer was calculated based on the target overall
relative density of zero with a maximum under compaction ratio (Un) of 10 for the bottom layer and the percent under compaction for each layer was determined based on the
assumption that it linearly decreased from the bottom to the top layers; (5) each layer was
weighed, poured into the mould, tamped to a predetermined equal height in a circular pattern
using the developed scaled tamper, and scarified prior to placing the next layer with special
care for tamping the top layer to ensure a level surface; (6) two latex membranes similar to
those used for the bottom of the specimen were placed on the top of the soil prior to the
placement of the upper platen and the membrane was gently stretched and folded around the
mould and sealed with two O-rings; (7) a small vacuum (about 4 to 5 kPa) was applied by
the pore pressure pump in order to provide confinement and hold the specimen in place
during dismantling of the mould; (8) three readings of sample height and diameter were
measured to determine the actual initial volume and thus void ratio of the specimen; (9) the
cylindrical triaxial cell was assembled and placed in the load frame, filled with de-aired
water, and the vacuum pressure was replaced by an external cell pressure of 10 kPa.
The initial vacuum pressure was necessary to maintain the specimen before the application
of the external cell pressure, otherwise the specimen collapsed upon the removal of the
1) – Enlarged platen over the pedestal 2) – Placement of membrane
3) – Folding of the membrane around the mould 4) - Measurement of sand
7) - Two lubricated latex membranes 8) – Placement of top platen
9) – Complete specimen 10) Specimen placed in the cell
Figure 2.8: Steps of specimen preparation using moist tamping method
2.4.2
Saturation Stage
It was important to ensure that the porous stones were boiled in deaired water for about 15
minutes prior to placement inside the platens. This helped to eliminate entrapped gas in the
porous stone discs and specimen saturation. Furthermore, the pumps and sensors were
saturated by flushing water to minimize errors in the measurement of specimen volume or
As complete saturation of the specimen was required to ensure accurate volume change and
pore pressure measurement, carbon dioxide (CO2) was first percolated through all specimens
under a small confining pressure of about 5 kPa for about 30 minutes. Compared to air, CO2 is more soluble in water (forming carbonic acid) which reduces the time and pressure
required to adequately saturate the specimen (Mulilis et al 1978). Subsequently, the top and
bottom specimen drain lines were flushed using the backpressure pump at a very slow rate
of 1 mL/min to ensure minimal disturbance to the specimen or dislodging the soil. The pore
pressure was monitored carefully during CO2 percolation and flushing with water to ensure that no pore pressure built up inside the specimen and the effective stress on the specimen
was never lost during saturation.
The saturation procedure was continuing with a backpressure saturation phase as
recommended by Black and Lee (1973). A back pressure of 200 kPa was applied to the
specimen pore water to drive the carbon dioxide and any remaining air into solution. The
process was done by raising the specimen pore pressure (using the backpressure pump)
while simultaneously maintaining a constant difference effective stress of 10 kPa between
the cell pressure and pore pressure. The pore pressure was increased at a rate slow enough to
allow pore pressure equalization throughout the specimen. Skempton’s pore water pressure
parameter B was used to verify the degree of specimen saturation. This was done by closing
the drainage valves and applying a small increment of cell pressure (3B) while also
measuring the increase in specimen’s pore pressure (uB). The B value was calculated as the
rise in specimens pore water pressure divided by the increment in cell pressure (B =
uB3B). A B = 1 indicates full (100%) saturation of the specimen. All specimens of this
2.4.3
Consolidation Stage
Isotropic consolidation commenced subsequent to the completion of specimen saturation by
increasing the confining pressure while maintaining a constant specimen pore pressure.
Confining pressures were utilized with values of 100 kPa, 200 kPa, 300 kPa, and 500 kPa.
As the piston remained locked during isotropic consolidation, a gap formed between the
specimen top platen and tip of the axial loading piston. The amount of displacement applied
to close this gap and make contact between the piston tip and the specimen top was used as
the axial deformation of the specimen following isotropic consolidation. The volume of
water driven out of the sample during the consolidation stage was also measured as the
difference in pore pump volume before and after the consolidation and hence, the
consolidation void ratio was readily computed for each test.
2.4.4
Shearing Stage
The specimens were sheared following isotropic consolidation to the target confining stress.
During shear the total cell pressure was kept constant while advancing the axial loading
piston on the specimen cap at a constant strain rate up to an axial strain of 30%. The shear
strain rate was chosen to ensure full pore pressure equalization during undrained shearing
and full excess pore pressure dissipation during drained shearing based on the following
ASTM guidelines:
̇ ⁄ (2.1)
Where and are the amounts of time required to reach 50% and 90% degrees of
consolidation, respectively. These were estimated from an initial trial triaxial test using the
tested sand where the theory of consolidation was applied and a coefficient of consolidation
(cv) of 5.4x10⁻⁵ m2/sec was determined using the equation:
⁄ (2.3)
While the coefficient of permeability, k, was estimated using Hazen’s equation:
cm/sec (2.4)
Shear strain rates of 6.3%/hour and 5.9%/hour were calculated, and therefore a fixed
shearing rate of 5%/hour was adopted in both drained and undrained triaxial shear tests.
Specimen drainage was not permitted during the undrained tests while the specimen pore
pressure was kept at the value of the backpressure during drained shear tests so all the
shear-induced pore water pressure was dissipated. Measurements of excess pore pressures during
the undrained shearing were taken by the pore pressure sensor, while volume change during
shearing was measured and recorded by the back pressure pump in the drained tests. The
void ratio at each strain level was calculated from the volume change measurements during
the drained shear tests while a constant specimen volume was maintained in the undrained
tests.
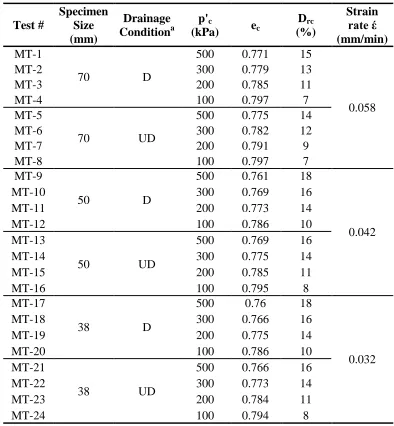
Table 2.1 summarizes the specifications of the specimens, loading conditions, and the
Table 2.1: Triaxial test data in this study Test # Specimen Size (mm) Drainage Conditiona p'c
(kPa) ec
Drc (%) Strain rateέ (mm/min) MT-1
70 D
500 0.771 15
0.058
MT-2 300 0.779 13
MT-3 200 0.785 11
MT-4 100 0.797 7
MT-5
70 UD
500 0.775 14
MT-6 300 0.782 12
MT-7 200 0.791 9
MT-8 100 0.797 7
MT-9
50 D
500 0.761 18
0.042
MT-10 300 0.769 16
MT-11 200 0.773 14
MT-12 100 0.786 10
MT-13
50 UD
500 0.769 16
MT-14 300 0.775 14
MT-15 200 0.785 11
MT-16 100 0.795 8
MT-17
38 D
500 0.76 18
0.032
MT-18 300 0.766 16
MT-19 200 0.775 14
MT-20 100 0.786 10
MT-21
38 UD
500 0.766 16
MT-22 300 0.773 14
MT-23 200 0.784 11
MT-24 100 0.794 8
a
D: drained shear test; UD: undrained shear test.
2.5 Corrections for Triaxial Compression Tests
Triaxial shear tests involve several sources of errors that could be significant in evaluating
test results if not corrected. The major errors resulting from sample volume changes occur
during back-pressure saturation, membrane penetration, and the variation of specimen
cross-sectional area during consolidation and shear. Additional errors result from the membrane
latex membranes in the enlarged and lubricated end platens technique. These errors have a
direct effect on the calculated stresses and the specimen’s void ratio. The methods to
account for these errors and the applied corrections along with the obtained results are
described in the following paragraphs.
2.5.1
Correction of Volume Change during Saturation
In conventional triaxial tests, the specimen void ratio before shear is calculated based on the
initial sample dimensions taken before assembling the cell and the void ratio changes during
backpressure saturation and consolidation stages. The correct assessment of these void ratio
changes is particularly critical in the testing of very loose sands because of their higher
sensitivity to void ratio and could affect the position of the critical state line. The sample
volume changes due to the flushing and backpressure saturation could be measured as the
volume change of the cell fluid or by measuring the axial and radial deformation using
sensors. Freezing the sample at the end of the test is the commonly applied method due to its
high accuracy in estimating the sample volume changes. Imaging technique using either a
high resolution camera or a 3D laser scanner can be also utilized. The ASTM standard
method D4767-11 suggests calculating the volume change during saturation as below:
⁄ (2.5)
Where Vo is the initial specimen volume, hs is change in height of the specimen during
saturation, and ho is the initial specimen height. Sladen and Oswell (1989) tested Syncrude tailing sand and measured void ratio changes due to saturation of as large as 0.15 using the
varying from 2% to 54% and monitored the axial and radial deformation during saturation
using a linear variable displacement transducer (LVDT) and a hall radial displacement
transducer (HRDT), respectively. He found that the entire saturation procedure resulted in a
void ratio change of 0.008 to 0.026 which increased with increasing specimen void ratio
where the looser the sample, the larger the volume change.
As described earlier, the saturation of moist tamped samples in this study was undertaken by
flushing the samples with carbon dioxide followed by de-aired water, and then applying
backpressure saturation. The sample dimensions were measured after applying a low suction
(5 kPa) and removing the mould. Since the purpose of this study is to investigate the effects
of measuring errors and corrections on critical state testing, all specimens were prepared at
an initial void ratio of 0.821 which represents relative density of 0% and the volume changes
occurring during backpressure saturation were obtained by measuring the axial strain (a) of
the specimen while making contact between the axial shaft and the specimen top cap, and
calculating the radial strain (r) and thus the volumetric strain (v) of the specimen from its
Poisson’s ratio ( = - r/a) from the following relationships:
(2.6)
(2.7)
Where Ao is the initial specimen cross sectional area and hs is the height change during
saturation. An average Poisson’s ratio of 0.34 was measured for all specimens from
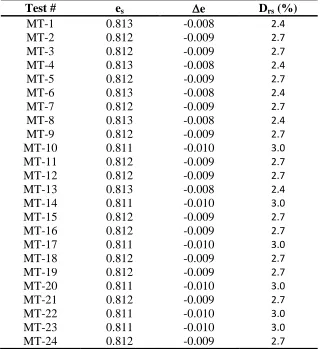
The calculated volume changes during saturation indicated that the void ratio decreased by
an average of 1.1% (0.008-0.01) after back pressure which corresponds to about (2.4-3%) in
terms of relative density changes and were considered in the calculation of the specimens'
void ratios at the critical state. Accordingly, neglecting saturation volume changes would
lead to overestimation of the specimens' void ratio and eventually an incorrect critical state
line and to about (2-3%) uncertainty in the critical strength that could be resulted from the
differences in the cross-sectional area of the specimen before shear and therefore, this
change in void ratio during saturation should not be ignored. Table 2.2 summarizes the void
ratio changes after saturation of backpressure 200 kPa for the all conducted tests.
Table 2.2: Void ratio change due to flushing and backpressure saturation
Test # es e Drs (%)
MT-1 0.813 -0.008 2.4
MT-2 0.812 -0.009 2.7
MT-3 0.812 -0.009 2.7
MT-4 0.813 -0.008 2.4
MT-5 0.812 -0.009 2.7
MT-6 0.813 -0.008 2.4
MT-7 0.812 -0.009 2.7
MT-8 0.813 -0.008 2.4
MT-9 0.812 -0.009 2.7
MT-10 0.811 -0.010 3.0
MT-11 0.812 -0.009 2.7
MT-12 0.812 -0.009 2.7
MT-13 0.813 -0.008 2.4
MT-14 0.811 -0.010 3.0
MT-15 0.812 -0.009 2.7
MT-16 0.812 -0.009 2.7
MT-17 0.811 -0.010 3.0
MT-18 0.812 -0.009 2.7
MT-19 0.812 -0.009 2.7
MT-20 0.811 -0.010 3.0
MT-21 0.812 -0.009 2.7
MT-22 0.811 -0.010 3.0
MT-23 0.811 -0.010 3.0
2.5.2
Correction of Volume Change due to Membrane Penetration
In triaxial tests on granular soils, volume change due to membrane penetration occurs when
the latex membrane penetrates into the surface irregularities of the specimen when applying
the effective confining stress. The amount of the resulting volume change is equal to the
difference between the total volume of water driven out of the sample and the actual volume
change of the soil skeleton (Newland and Allely 1959). This phenomenon was first
recognized by Newland and Alley (1957) and since then it has been of considerable interest
to numerous researchers (Pickering 1973, Frydman et al. 1973, Kiekbusch and Schuppener
1977, Ramana and Raju 1982, Lade and Hernandes 1982, Seed et al. 1989, Ansal and Erken
1996). Figure 2.9 illustrates the membrane penetration effect on a granular soil sample under
low and high effective confining pressures.
Figure 2.9: Effect of membrane penetration (after K.H. Head 1992)
It can be observed from the above figure that the membrane penetrates into the surface
cavities when the effective confining stress increases and tends to return to its original state
when the effective confining stress is reduced. The impact of membrane penetration on the
1959, Roscoe et al. 1963, Frydman et al. 1973, Raju and Sadasivan, 1974, Baldi and Nova
1984, Seed and Anwar 1989, Kramer and Sivaneswaran 1989, Nicholson et al 1993). In a
drained triaxial test, the effective confining stress ('3)is constant and membrane penetration
has only a minor influence on the volume change due to the slight changes of surface area,
while in an undrained triaxial test, σ'3changes substantially and the measured pore water
pressure is significantly affected due to the membrane penetration (Roscoe et al. 1963).The
amount of membrane penetration is a function of many factors including the effective
confining pressure, grain size, grain shape, gradation, density of the sample, the surface area
of the sample in contact with the rubber membrane, and the characteristics of the rubber
membrane such as thickness and extension modulus. Hence, no single approach can
precisely account for all these factors in order to accurately estimate membrane penetration
for different sands (Raju and Sadasivan 1974).
However, several methods are developed to account for the volume changes due to
membrane penetration. For example, Frydman et al. (1973) studied membrane penetration
for granular soils with different particle sizes. They tested soils at '3 ranging from 50 to 800
kPa and found that the volume change due to membrane penetration ) was directly
proportional to the logarithm of '3. Further investigation by Lade and Hernandes (1977)
showed that was directly related to the mean diameter of the soil particles (D50). Baldi
and Nova (1984) investigated the membrane penetration in triaxial testing and found that
membrane penetration depends strongly on D50, '3, and the diameter of the specimen (d) as
well as the membrane characteristics. According to their analysis, a quantitative correction
(
) [ {
}] (2.8)
Where is the volume change due to membrane penetration, Vs is the specimen volume after saturation, Em is the Young’s modulus for the membrane material, and tm is the
thickness of the membrane. Nicholson et al. (1993) found that the influence of sample
density on membrane penetration was relatively small in comparison to the influence of D50.
Zhang (1997) studied the effect of membrane thickness on the amount of membrane
penetration for two sands and found that membrane thickness significantly affected the
amount of penetration in both sands. The thinner the membrane the higher the volume
change was due to membrane penetration.
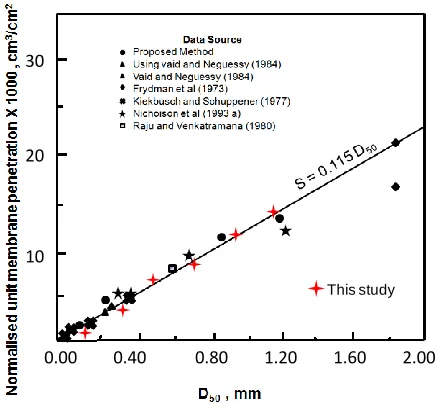
Sivathayalan and Vaid (1998) investigated sets of experimental data produced using
different techniques by several researchers and normalized the unit membrane penetration
by dividing the recorded volumetric membrane penetration by the contact surface area
between the sample and the membrane and then plotted that versus the logarithm of '3.
They found that the slope (S) of the developed relationship was a function of D50 of the
sand, with an average of 0.0115 D50 for a wide range of particle sizes. Figure 2.10 shows the linear plot of S versus D50 which illustrates the normalized unit membrane penetration data and indicates that all data fall within a narrow band for particle sizes ranging from about 0.1
to 1.0 mm.
The membrane penetration in this study was calculated using Baldi and Nova (1984)
equation as it accounts for all factors that could influence the membrane penetration
(confining pressure, grain size, sample diameter, and membrane thickness and modulus). For
particle sizes, was normalized to the contact surface area and presented in the same plot of
Figure 2.10 which demonstrates that the calculated membrane unit penetration is in good
agreement and within the same linear function of D50 as proposed by Sivathayalan and Vaid (1998).
Figure 2.10: Effect of D50 on the normalized membrane penetration (Sivathayalan and Vaid 1998)
The membrane penetration volume change in an undrained test mainly depends on the
change of the effective confining stress, with the higher consolidation pressure developing
larger membrane penetration volume change. Instead of correcting for the effect of
membrane penetration, a fewer number of studies have attempted to reduce the amount of
membrane penetration during shear by isolating the direct contacting surface between the
membrane and the soil specimen. For example, Lade and Hernands (1977) placed square
plates inside the membrane, while Kiekbusch and Schuppener (1977) coated the membrane
surface with liquid rubber. Such methods produce unknown amounts of disturbance to the 30
20
10
2.00 1.60
1.20 0.80
0.40 0.00
samples and result in a thick composite membrane whose axial load resistance is very
difficult to evaluate (Zhu and Anderson 1998). Therefore, to eliminate the effect of
membrane penetration on the results of undrained triaxial tests, several researchers have
proposed to compensate for the membrane penetration volume change by injecting an
equivalent volume of water into the soil specimen (Ramana and Raju 1982, Seed and Anwar
1989, Nicholson et al. 1993a). The injection process can be performed either manually or
automatically using a computer-controlled system and the volume of water to be injected
into the specimen is predetermined based on one of the available information relationship
(Baldi and Nova 1984; Sivathayalan and Vaid 1998) between volumetric penetration and
effective confining pressure for a given soil.
Correction for membrane penetration during the isotropic consolidation was considered in
all tests performed in this study by correcting the recorded volume change after
consolidation and accordingly, the consolidation void ratios. The D50 of the tested sand, tm,
and Em of the used rubber membrane were measured as 0.22 mm, 0.3 mm, and 1350 kPa.
The changes in the consolidation void ratios due to the membrane penetration was not
significantly as only an average of 0.36% (0.002-0.003) was calculated, which corresponds
to about (0.6-0.9%) in terms of relative density changes. This can be attributed to the fine
gradation of the tested sand that limited the penetration of the membrane into the surface
irregularities. However, as the critical state line is very sensitive to void ratio changes, it was
considered for accurate estimation of the specimens' void ratios at the critical state.
During the drained shearing, the effective confining stress '3 is constant and hence the
membrane penetration occurring during the consolidation stage does not change during the