Scholarship@Western
Scholarship@Western
Electronic Thesis and Dissertation Repository
11-9-2011 12:00 AM
Fatigue and Mobility Post-Stroke
Fatigue and Mobility Post-Stroke
Svetlana Knorr
The University of Western Ontario Supervisor
Dr. S. Jayne Garland
The University of Western Ontario
Graduate Program in Health and Rehabilitation Sciences
A thesis submitted in partial fulfillment of the requirements for the degree in Doctor of Philosophy
© Svetlana Knorr 2011
Follow this and additional works at: https://ir.lib.uwo.ca/etd Part of the Physical Therapy Commons
Recommended Citation Recommended Citation
Knorr, Svetlana, "Fatigue and Mobility Post-Stroke" (2011). Electronic Thesis and Dissertation Repository. 334.
https://ir.lib.uwo.ca/etd/334
This Dissertation/Thesis is brought to you for free and open access by Scholarship@Western. It has been accepted for inclusion in Electronic Thesis and Dissertation Repository by an authorized administrator of
FATIGUE AND MOBILITY POST-STROKE
(Spine title: Fatigue and Mobility Post-Stroke)
(Thesis format: Integrated-Article)
by
Svetlana Knorr
Graduate Program in Health and Rehabilitation Sciences
A thesis submitted in partial fulfillment of the requirements for the degree of
Doctor of Philosophy
The School of Graduate and Postdoctoral Studies The University of Western Ontario
London, Ontario, Canada
THE UNIVERSITY OF WESTERN ONTARIO School of Graduate and Postdoctoral Studies
CERTIFICATE OF EXAMINATION
Supervisor Examiners
Dr. S. Jayne Garland Dr. Martin Bilodeau
Supervisor Committee Dr. Kevin Shoemaker
Dr. Charles Rice Dr. Charles Rice
Dr. Timothy Doherty Dr. Kara Patterson
The thesis by
Svetlana Knorr
entitled:
Fatigue and Mobility Post-Stroke
is accepted in partial fulfillment of the requirements for the degree of
Doctor of Philosophy
Date
ABSTRACT
Fatigue post-stroke is a disabling and persistent symptom affecting many stroke
survivors. Despite its high prevalence, the pathophysiology underlying this phenomenon
remains obscure. Thus, the aim of this thesis was to study the neuromuscular basis
underlying fatigue post-stroke and its association with self-reported fatigue and with the
performance of tasks incorporating balance and mobility components.
Community-dwelling stroke survivors who had mild to moderate deficits in
functional balance and mobility participated in a series of investigations. Chapter 2
describes the initial validation of the Community Balance and Mobility (CB&M) scale
for use in persons with chronic stroke. Chapter 3 reported the presence of self-reported
fatigue, assessed with the Fatigue Assessment Scale and restricted functional balance and
mobility, measured with the 6-minute walk test and with the CB&M. Based on the
findings obtained from the twitch interpolation and transcranial magnetic stimulation
techniques, stroke resulted in a shift of the origin of neuromuscular fatigue such that the
participants with stroke were more susceptible to the development of central fatigue
following a standardized fatigue task, whereas healthy subjects had more evidence of
peripheral fatigue. Also, the results from Chapter 3 demonstrated that the susceptibility
to central failure was positively associated with the increased self-reported fatigability
and negatively with the 6-MWT and CB&M scores. In Chapter 4 changes in the intrinsic
properties of the spinal motoneurons, manifested as prolongation of the
afterhyperpolarization time-course estimated with the interval death rate transform
method were demonstrated. Prolonged afterhyperpolarization may have contributed to
In summary, the stroke-induced disturbances along the neuromuscular system
together with the post-stroke deficits in functional balance and mobility may compromise
the ability of the central nervous system to cope with the increased physiological
demands during physical activities. This may lead to the increased perception of effort,
which could influence the performance of activities of daily living and may partially
underlie the general complaint of fatigue experienced by people with stroke. The
findings reported in this thesis have advanced the understanding of a pathophysiological
basis of fatigue post-stroke, which is essential for developing and guiding effective
rehabilitation treatments.
KEYWORDS: stroke; neuromuscular fatigue; transcranial magnetic stimulation;
CO-AUTHORSHIP
This thesis contains materials from two published manuscripts (Chapter 2 and 3) and
one manuscript in preparation to be submitted for peer review (Chapter 4). All of the
experimental data presented in this dissertation were collected and interpreted by the
author, Svetlana Knorr, under the mentorship of Dr. S. Jayne Garland and Dr. Tanya D.
Ivanova. Svetlana Knorr was the first author and Dr. S. Jayne Garland was a co-author
on all manuscripts.
Dr. S. Jayne Garland and Dr. Tanya D. Ivanova assisted in study design, data
analysis, and manuscript preparation. Dr. Tanya D. Ivanova is a co-author on Chapter 3
and 4. Dr. Brenda Brouwer and Dr. Timothy J. Doherty were co-authors on Chapter 2
and 3, respectively, and assisted in manuscript preparation. Mr. James A. Campbell was
ACKNOWLEDGEMENTS
This thesis would not be possible without the support, reassurance and
encouragement from my mentors, colleagues, family, and friends. Over the course of my
graduate career, I have been privileged to meet and work with many talented and
exceptional people that have inspired me in my academic and personal development.
Firstly, to Dr. Jayne Garland, I am indebted to you for providing me the opportunity
to pursue this degree, which helped me establish a strong foundation to successfully build
upon and to move forward in my future endeavors. Jayne, you have been a wonderful
mentor. On a daily basis, you demonstrated the ability to juggle a variety of roles in life,
and your emotionally balanced way of dealing with the highs and lows of academia
helped me mature as both a person and scientist. I hope there will be continued
collaboration between us in the future.
I would also like to express sincere gratitude to Dr. Tanya Ivanova. Your experience
and guidance with everything related to school, work, and life was instrumental for
making this dissertation a success. This will never be forgotten. Thank you for also
being my second mother while I was living in Vancouver! ☺
Special thanks to my advisors, Dr. Charles Rice and Dr. Tim Doherty, whose
invaluable insight and expertise were crucial for my success. Tim, thank you for
allowing me access to your lab space and resources. Charles, I owe you a great debt of
gratitude for your kindness, calming influences, and words of wisdom; all of these helped
keep my perspectives during the ups and downs of the research experience.
I am truly grateful to the faculty and staff in the Department of Health and
you for your time, tireless support, encouragement, and expertise!!! I want to particularly
thank Nancy Inchley, Cathy Collins, Donna Beer, and Cheryl Harding for going the extra
mile in assisting me with administrative issues, which facilitated my Ph.D. journey,
making it much more enjoyable.
I would also like to thank my lab mates and my fellow graduate students who created
positive learning environments and helped me get through the difficult times.
Many thanks to all the study participants who volunteered their time in order to
improve our understanding of neurophysiological changes that occur following a stroke.
I would like to acknowledge the funding support from the University of Western
Ontario, OGS, and the financial assistance provided by Dr. Jayne Garland. Such
generosity has made the completion of this dissertation possible!!!
My deepest gratitude also goes to my friends, who spent countless hours listening to
me talk about my school related issues. Thank you for your advice, patience, support,
understanding and for being my safety net and voices of reason.
And of course to my loving family, especially my dear mother, sister and
grandparents words cannot suffice for what your boundless love, support,
encouragement, reassurance and belief in me, even when I was in doubt, has meant over
the years. You are my life’s pillars and my role models, and I am truly blessed to have
you. You have motivated me to achieve my aspirations and exceeded every need of
TABLE OF CONTENTS
Page
CERTIFICATE OF EXAMINATION ... ii
ABSTRACT... iii
CO-AUTHORSHIP ... v
ACKNOWLEDGEMENTS... vi
TABLE OF CONTENTS... viii
LIST OF TABLES ... xi
LIST OF FIGURES ... xii
LIST OF APPENDICES... xiii
LIST OF ABBREVIATIONS... xiv
CHAPTER 1: General introduction and thesis outline 1.1 GENERAL INTRODUCTION 1.1.1 Stroke……….. ... 1
1.1.2 Stroke-Induced Changes in the Neuromuscular System ... 1
1.1.2a Cortical Level ... 2
1.1.2b Spinal and Muscle Levels ... 4
1.1.3 Assessment of Balance and Mobility Post-Stroke ... 7
1.1.4 Fatigue-Post Stroke……….. ... 9
1.2 THESIS OUTLINE ... 14
1.3 REFERENCES ... 16
CHAPTER 2: Validity of the community balance and mobility scale in community-dwelling persons after stroke 2.1 INTRODUCTION... 24
2.2 METHODS... 27
2.2.1 Participants ... 27
2.2.2 Assessment of Lower Limb Motor Control Impairments ... 28
2.2.3 Assessment of Functional Balance and Mobility... 28
2.2.4 Lower Limb Strength Assessment ... 29
2.2.6 Data Analysis and Statistics ... 31
2.3 RESULTS... 32
2.3.1 Participants ... 32
2.3.2 Convergent Validity ... 34
2.3.3 Sensitivity to Change ... 34
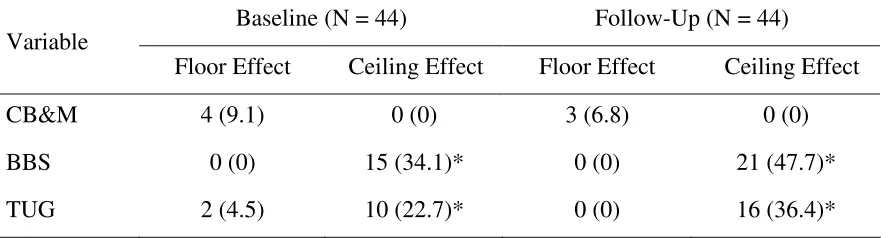
2.3.4 Floor and Ceiling Effects ... 34
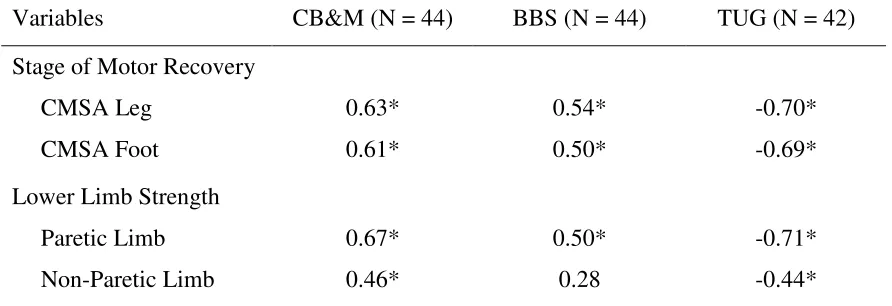
2.3.5 Associations of the CB&M, BBS, TUG to the CMSA and Lower Limb Strength ... 38
2.4 DISCUSSION... 38
2.4.1 Convergent Validity ... 38
2.4.2 Floor and Ceiling Effects and Sensitivity to Change ... 41
2.4.3 Associations of the CB&M, BBS, TUG to the CMSA and Lower Limb Strength ... 43
2.4.4 Summary ... 44
2.5 REFERENCES ... 46
CHAPTER 3: The origins of neuromuscular fatigue post-stroke and its association with self-reported fatigue and mobility in chronic stroke survivors 3.1 INTRODUCTION... 49
3.2 METHODS... 53
3.2.1 Participants ... 53
3.2.2 Motor Control, Balance and Mobility following Stroke ... 55
3.2.3 Self-Reported Fatigue ... 55
3.2.4 Depression ... 55
3.2.5 Functional Long-Distance Mobility ... 56
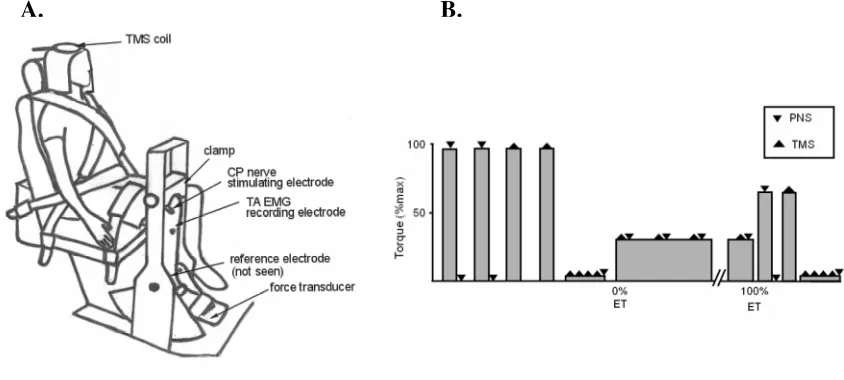
3.2.6 Apparatus ... 56
3.2.7 Surface Electromyography... 58
3.2.8 Peripheral Nerve Electrical Stimulation... 58
3.2.9 Twitch Interpolation Technique ... 59
3.2.10 Transcranial Magnetic Stimulation ... 59
3.2.11 Experimental Protocol... 60
3.2.12 Data Acquisition and Analysis ... 62
3.2.13 Statistical Analysis ... 63
3.3 RESULTS... 64
3.3.1 Control vs. Non-paretic Limb ... 65
3.3.2 Paretic vs. Non-paretic Limb ... 65
3.3.3 Association of Fatigue with Function ... 73
3.4 DISCUSSION... 77
3.4.1 Pre-Fatigue ... 77
3.4.2 During Fatigue... 78
3.4.3 Post-Fatigue... 80
3.4.4 Association of Fatigue with Function ... 82
3.4.5 Summary ... 83
CHAPTER 4:
Motoneuron afterhyperpolarization time-course following stroke
4.1 INTRODUCTION... 91
4.2 METHODS... 92
4.2.1 Participants ... 92
4.2.2 Apparatus and Signal Acquisition... 93
4.2.3 Experimental Protocol... 94
4.2.4 Data Analysis ... 95
4.2.5 Statistical Analysis ... 98
4.3 RESULTS... 100
4.4 DISCUSSION... 103
4.4.1 Summary ... 107
4.5 REFERENCES ... 108
CHAPTER 5: General discussion and conclusion 5.1 GENERAL DISCUSSION ... 111
5.2 LIMITATIONS AND FUTURE STUDIES... 116
5.3 CONCLUSION ... 119
5.4 REFERENCES ... 120
APPENDIX A... 122
APPENDIX B ... 127
APPENDIX C ... 130
APPENDIX D... 139
APPENDIX E ... 145
APPENDIX F... 147
APPENDIX G... 149
LIST OF TABLES
Page
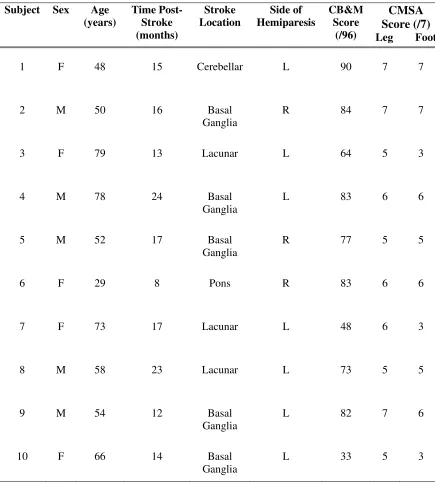
2.1Demographic and clinical characteristics of participants……….………...33
2.2 Sensitivity to change of the three balance and mobility measures……….….35
2.3 Floor and ceiling effects of the CB&M, BBS, and TUG measures……….…37
2.4 Correlations between the CB&M, BBS, TUG and CMSA and lower limb
strength ………..40
3.1 Characteristics of subjects with stroke……….…54
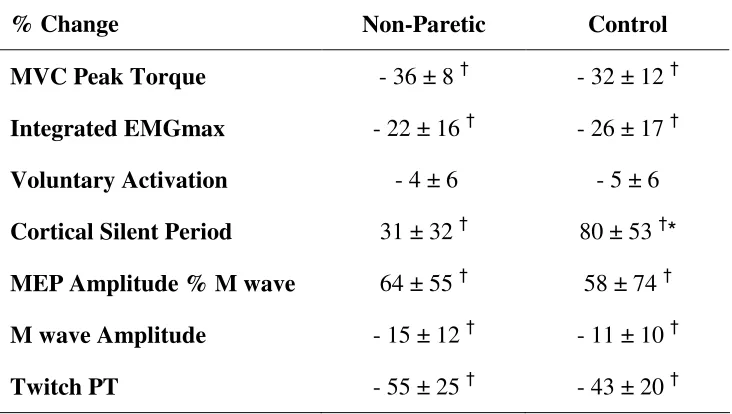
3.2 Central and peripheral changes following fatigue for the non-paretic and
control limbs………..66
4.1 Demographic and clinical characteristics of participants………99
4.2 MVC peak torque, surface EMG, AHP time constant and ISI duration on the
LIST OF FIGURES
Page
2.1 CB&M, BBS and TUG scores at baseline plotted against scores at follow-up
assessment……….……….36
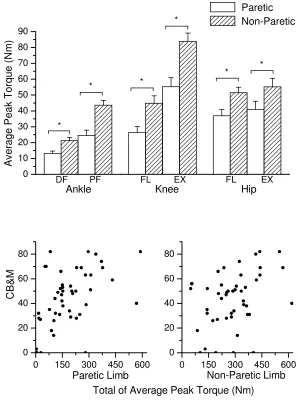
2.2 Torque-generating capacity of the paretic and non-paretic muscles plotted against the CB&M scores………..……….39
3.1 Schematic representation of experimental setup and procedures ………...57
3.2 MVC torque, surface EMG and voluntary activation before and following
fatigue………67
3.3 Duration of cortical silent period and amplitude of M wave and MEP before and following fatigue………68
3.4 Changes in surface EMG and RPE during fatigue task………...70
3.5 Changes in MEP amplitude and cortical silent period duration during fatigue task...71
3.6 Representative recordings of EMG responses following transcranial magnetic
stimulation during fatigue task………...72
3.7 Twitch peak torque and amplitude of the superimposed twitch evoked by TMS before and following fatigue task………..74
3.8 Associations among the VA change, FAS and 6-MWT scores………...75
3.9 Associations among the scores obtained on the CB&M, CMSA leg and foot subscales vs. 6-MWT……….76
4.1 Representative AHP trajectories along with the ISI histograms are illustrated for the paretic and non-paretic sides………97
4.2 A sample of representative recordings collected on the non-paretic and paretic
LIST OF APPENDICIES
Page
APPENDIX A Ethics Approval... 122
APPENDIX B Rights and Reprint Permission ... 127
APPENDIX C Community Balance and Mobility Scale... 130
APPENDIX D Berg Balance Scale... 139
APPENDIX E Chedoke McMaster Stroke Assessment – Leg and Foot Subscales .. 145
APPENDIX F Fatigue Assessment Scale ... 147
LIST OF ABBREVIATIONS
AHP afterhyperpolarization
AMT active motor threshold
BBS Berg balance scale
BMI body mass index
CB&M community balance and mobility scale
CES-D center for epidemiological studies – depression scale
CMSA Chedoke McMaster stroke assessment
CNS central nervous system
CP common peroneal nerve
EMG electromyography
EMGmax maximal electromyography
ET endurance time
FAS fatigue assessment scale
FIM functional independence measure
GABA γ-aminobutyric acid
IDR interval death rate
iEMG integrated electromyography
ISI interspike interval
MEP motor evoked potential
MVC maximal voluntary contraction
MU motor unit
PASS postural assessment scale for stroke
PNS peripheral nerve stimulation
PT peak torque
RPE rate of perceived exertion
RMS root mean square
sEMG surface electromyography
SP silent period
6-MWT six-minute walk test
SOL soleus
SRM standardized response mean
TA tibialis anterior
TMS transcranial magnetic stimulation
TUG timed ‘up and go’ test
CHAPTER 1
GENERAL INTRODUCTION AND THESIS OUTLINE
1.1 GENERAL INTRODUCTION
1.1.1 Stroke
Stroke, also referred to as a cerebrovascular accident, is defined as a sudden
interruption or blockage of blood flow to all or part of the brain leading to the deprivation
of oxygen and nutrients to the brain, subsequently causing the damage or death of the
cells in the affected area and loss of brain function (Heart and Stroke Foundation, 2010).
According to Statistics Canada, stroke affects more than 50,000 Canadians annually and
is classified as one of the leading causes of persistent physical disability in adults. It is
estimated that as many as 300,000 Canadians are living with post-stroke functional
impairments, defined as the loss of normal function of part of the body (Stroke Statistics,
2010). The majority of community-dwelling stroke survivors live with physical deficits,
including muscle weakness, poor motor control and balance instability, that significantly
compromise their functional mobility andindependence in performing activities of daily
living, reintegration into the community, and quality of life (Clarke et al., 2002; Flansbjer
et al., 2006; Mayo et al., 2002; Patterson et al., 2007). These physical deficits may also
result in the increased fatigability often reported by stroke survivors (Colle et al., 2006;
Michael et al., 2006).
1.1.2 Stroke-Induced Changes in the Neuromuscular System
The neuromuscular system is a complex system mediating force production and
movement that incorporates different levels, from the higher-order central nervous
initiated at the cortical level, but subsequently affects the spinal and muscle levels and
manifests as physical impairments in force production and functional deficits in balance
and mobility.
1.1.2a Cortical Level
Following a stroke, the affected cortex undergoes structural and functional changes
that may lead to alterations in cortical excitability and/or inhibitory neuronal activity as
well as altered brain activation patterns in the bilateral cortical and subcortical areas
(Liepert et al., 2005; Luft et al., 2005; Traversa et al., 2000). Increased brain activation
in the intact premotor and sensorimotor cortices ipsilateral and contralateral to the paretic
side was observed during functional tasks performed with the paretic limb in individuals
with chronic hemiparesis (Luft et al., 2004; Luft et al., 2005; Nelles et al., 1999). It
appears that enhanced brain activation may reflect a compensatory mechanism with the
intention of overcoming stroke-induced disturbances and lost function of some cortical
networks in order to perform a task. Abnormal patterns of brain activation may be
substantially taxing on the system since extra effort is required by the brain to execute a
motor task and this may result in the increased perception of effort often reported by
patients affected by stroke during the performance of a functional task (Solomon and
Robin, 2005; Thickbroom et al., 2006).
For the last two decades, transcranial magnetic stimulation (TMS) has been utilized
widely as a non-invasive electrophysiological technique to investigate responsiveness of
the motor cortex and functional integrity of the descending motor pathway following a
stroke (Liepert, 2006; Pennisi et al., 2002; Thickbroom et al., 2002). Based on the
excitability of the motor cortex is decreased in the affected hemisphere of chronic stroke
survivors (Byrnes et al., 2001; Liepert, 2006; Pennisi et al., 2002; Thickbroom et al.,
2002; Wheaton et al., 2009). The duration of the cortical silent period, which is
represented as a period of electromyographic (EMG) silence during sustained muscle
contraction, is used as a marker of intracortical inhibition (Inghilleri et al., 1993; Wilson
et al., 1993). Prolongation of the cortical silent period was observed in stroke survivors
(Classen et al., 1997; Liepert, 2006). Thus, the alterations in the TMS-evoked parameters
might be indicative of the disruptions between the intra- and inter-hemispheric excitatory
and inhibitory circuits, loss of excitable tissue in the motor cortex, demyelination and/or
loss of corticospinal conducting axons, leading to the suboptimal motor cortex output and
disturbances in the recruitment of spinal motoneurons (Classen et al., 1997; Homberg et
al., 1991; Pennisi et al., 2002).
Studies that have investigated the impact of changes along the corticospinal pathways
on functional performance reported that the increased cortical motor threshold and
reduced motor evoked potential amplitude obtained after stimulation of the affected
hemisphere were associated with stroke-induced muscle strength deficits (Liepert, 2006;
Pennisi et al., 2002; Thickbroom et al., 2002). Furthermore, the observed increase in the
duration of the cortical silent period was correlated with motor control impairments
including inability to initiate or hold a voluntary contraction as well as with the level of
functional recovery (Classen et al., 1997). Thus, individuals with stroke who
demonstrated close to normal TMS-parameters had better functional recovery in
1.1.2b Spinal and Muscle Levels
Mounting research evidence suggests that stroke leads to impairments at the
segmental level of the spinal cord (Arasaki et al., 2006; Brown and Snow, 1990;
Gemperline et al., 1995; McComas et al., 1973). Nerve conduction and needle EMG
studies reported that a substantial proportion of motoneurons innervating the paretic
limbs cease to function (Arasaki et al., 2006; Hara et al., 2000; Hara et al., 2004; Lukacs
et al., 2008; McComas et al., 1973). This has been explained by partial trans-synaptic
degeneration of motoneurons as a result of interruptions of corticospinal projections
leading to the disturbances in axonal transport and deprivation of normal trophic inputs
(Arasaki et al., 2006; Brown and Snow, 1990; McComas et al., 1973). The degeneration
of motoneurons could subsequently alter the function and structural composition of their
respective muscle fibers.
Motor units, which consist of a motoneuron and all the muscle fibers it innervates, are
classified into several basic groups on the basis of the properties of the constituent muscle
fibers. Slow contracting motor units consists of Type I muscle fibers, which produce
little force but are resistant to fatigue. Fast contracting motor units produce greater forces
and are composed of muscle fibers that are either resistant (Type IIa) or susceptible (Type
IIb) to fatigue (Burke et al., 1973; Garnett et al., 1979). The majority of findings from
studies that investigated stroke-induced reorganization in the muscle fiber composition,
reported selective atrophy and loss of Type II muscle fibers as well as Type I muscle
fiber hypertrophy and motor unit size enlargement due to collateral reinnervation (Dattola
et al., 1993; Hara et al., 2004; Lukacs et al., 2008; McComas et al., 1973; Scelsi et al.,
(e.g. motor unit denervation via trans-synaptic degeneration of motoneurons) or
secondary (e.g. muscle disuse) consequences of the upper motoneuron lesion. In
addition, no difference in the overall fiber type composition between the paretic and
non-paretic side has been reported (Hachisuka et al., 1997; Sunnerhagen et al., 1999). A
commonly-reported observation was that the degree of muscle reorganization was
positively correlated with the severity of paresis. For example, participants who were
able to ambulate without any assistive devices or with only minor post-stroke
impairments had similar to control and non-paretic muscle fiber type composition
(Hachisuka et al., 1997; Sunnerhagen et al., 1999), whereas an increase in the percentage
of Type I muscle fibers in the tibialis anterior muscle was reported in participants with
increased paresis (Scelsi et al., 1984). In summary, factors such as severity of
hemiparesis and changes in the patterns of muscle activation and usage (e.g. involvement
of a compensatory movement strategy or learned muscle disuse) could influence the
pattern of alteration in the muscle fiber composition, subsequently affecting the overall
force-generating capacity of a muscle.
Recruitment and discharge patterns of motor units are the fundamental neuromuscular
mechanisms involved in the production of a voluntary force. Thus, as force demands
increase, there is an increase in the firing rate of already active motor units as well as
recruitment of additional motor units (Adam and De Luca, 2005). Accumulated evidence
of a reduction in initial, mean and maximal discharge rates of active motor units and a
failure to increase firing rates during increases in voluntary forces in paretic muscles have
been observed during the chronic stage following a stroke (Frontera et al., 1997;
inputs to the motoneurons has been proposed to be plausible mechanisms explaining the
stroke-induced abnormalities in motor unit recruitment and discharge patterns (Frontera
et al., 1997; Gemperline et al., 1995). In addition, alterations in the motoneuron intrinsic
properties would also play a critical role in the observed reduction in the discharge
characteristics of motoneurons. For instance, the afterhyperolarization (AHP) is an
intrinsic property of the motoneuron and its duration influences the discharge rate of the
motoneurons and therefore, modulates the mechanical output of the muscle (Kernell,
1965; Kernell et al., 1999; Sawczuk et al., 1995). Animal and human studies report
consistent evidence that aging is associated with lengthening of the AHP duration
(Beaumont and Gardiner, 2003; Christie and Kamen, 2010; Piotrkiewicz et al., 2007);
however, there is only one study that reported stroke-induced prolongation of the AHP
time-course in the paretic biceps brachii muscle of participants following a stroke (Liang,
2010). Both, the process of aging and stroke, are associated with the reduction in the
motoneuron discharge rates as well as with motor unit remodeling towards slower muscle
fiber phenotype (Christie and Kamen, 2010; Frontera et al., 1997; Lukacs et al., 2008;
Rice and Cunningham, 2002). A correlation between the motoneuron and muscle fibers
characteristics has been established (Gossen et al., 2003; MacDonell et al., 2008; Zengel
et al., 1985), and thus, a shift in the muscle type from fast to slow has been proposed to
be as a potential mechanism underlying the observed prolongation in the AHP duration
(Christie and Kamen, 2010; Liang et al., 2010; Piotrkiewicz et al., 2007). Also, the
adaptability of the AHP parameters in response to changes in muscle activity level has
been demonstrated in both animal models and humans (Christie and Kamen, 2010;
brachii muscle reported by Liang et al (2010) should be confirmed in the muscles of the
lower extremity since the pattern of muscle utilization differs between the upper and
lower extrimities, such that lower limb muscles are involved primarily in locomotion and
postural tasks whereas upper limb muscles are utilized mainly in grasping and tasks
involving dexterity.
In the presence of altered brain activation, suboptimal motor cortex output, impaired
motor unit discharge pattern and structural rearrangement of motor units, a greater effort
would need to be expended by individuals with stroke to perform any activities of daily
living, especially those requiring long-lasting muscle contractions. Ultimately stroke
survivors may experience increased sense of effort and fatigability (Gandevia, 1982).
Furthermore, the collective consequences of these stroke-induced changes along the
entire neuromuscular pathway result in deficits in motor control, which can manifest on a
functional level as poor balance and limited mobility (Novak and Brouwer, 2009).
1.1.3 Assessment of Balance and Mobility Post-Stroke
Deficits in functional balance and mobility are common sequelae of stroke and are
primary determinants of independent living in the community (Tyson et al., 2006). The
aforementioned stroke-induced impairments in motor control and muscle weakness have
been identified as the main factors negatively affecting functional balance and mobility
(Flansbjer et al., 2006; Lamontagne et al., 2002; Patterson et al., 2007). Evaluative
measures such as Berg Balance Scale (BBS) and Timed Up and Go (TUG) test are
commonly used as tools to assess functional balance and mobility following stroke in
clinical and community settings. The BBS consists of 14 tasks that are scored from 0
increases from measuring static balance (e.g. standing or sitting unsupported) progressing
to dynamic balance (e.g. step-touch or standing on one leg) (Berg et al., 1992). The TUG
test measures the dynamic balance and functional mobility over a short-distance
(Podsiadlo and Richardson, 1991). The time it takes for the participant sitting in a
standard chair to stand up, walk forward 3 meters, and return to the seated position is
measured, with a shorter time reflecting better dynamic balance and functional mobility.
The utilization of these tools has been validated and proved to be sensitive to change in
moderately- to severely-affected stroke survivors (Ng and Hui-Chan, 2005; Tyson and
DeSouza, 2004). However, due to the reported ceiling effects, these tools have limited
applicability for assessing functional balance and mobility in mildly-affected
community-dwelling stroke survivors(Mao et al., 2002; Salbach et al., 2001). In order to monitor
recovery over time and determine the effectiveness of rehabilitation interventions, it is
critical to use an outcome measure that is appropriate to the person’s level of abilities and
sensitive enough to capture improvements in functional balance and mobility.
The Community Balance and Mobility (CB&M) scale was developed to assess
balance and mobility in individuals with high ambulatory function but with persistent
balance and mobility deficitsfollowing traumatic brain injury (Howe et al., 2006), but its
utilization in population with stroke has not been validated yet. This scale consists of 13
tasks that challenge different aspects of balance and mobility (e.g. static versus dynamic
balance, internal perturbations during performance of mobility tasks) and simulate the
physical activities often encountered while living in the community (e.g. carrying
groceries while walking and looking at the target). Thus, in comparison to the traditional
CB&M test is more reflective of functional deficits relevant to community ambulation.
Also, the CB&M scores might be predictive of the performance on a long-distance
mobility task, such as the six-minute walk test (6-MWT), which has been reported to
deteriorate in chronic stroke survivors (van de Port et al., 2006).
The deficits post-stroke in functional balance and motor control of the lower limbs
are known to contribute to the high-energy cost of mobility, in some cases estimated to be
at least twice as that of age-matched controls (Gersten and Orr, 1971; Macko et al., 2001;
Milot et al., 2006). This increased level of effort and energy expenditure during mobility
tasks might contribute to the increased self-reported fatigability post-stroke, which was
reported as one of the factors associated with poor mobility (Ingles et al., 1999; Michael
et al., 2006; van de Port et al., 2006).
1.1.4 Fatigue Post-Stroke
Fatigue is described by patients with neurologic disorders including stroke survivors
as an overwhelming sense of tiredness, feeling of exhaustion, and lack of physical and
mental energy that interferes with activities of daily living (De Groot et al., 2003; Krupp
and Pollina, 1996). Fatigue post-stroke has been studied primarily using self-report
fatigue assessment scales, such as the Fatigue Assessment Scale. Based on the evidence,
the self-reported experience of fatigue is a prominent disabling symptom affecting up to
72% of stroke survivors and is associated with profound deterioration of many aspects of
everyday life and ofteninterferes with the rehabilitation process (Glader et al., 2002;
Michael et al., 2006; Morley et al., 2005). The etiology of fatigue in people with stroke
remains obscure. It has been hypothesized that fatigue post-stroke results from a
well as neurologic alterations leading to the dysfunction in central and peripheral motor
pathways (Sisson, 1998). Factors such as post-stroke depression, sleep disturbances,
severity of neurologic impairments, age, co-morbidities, and lack of family support have
been associated with the increased self-reported fatigability(Choi-Kwon et al., 2005;
Glader et al., 2002; Ingles et al., 1999; Michael et al., 2006; Staub and Bogousslavsky,
2001; Tseng and Kluding, 2009). Although extensive research has been conducted to
identify factors contributing to fatigue post-stroke, the neuromuscular basis of this
phenomenon has received limited attention.
Neuromuscular fatigue is defined as any contraction-induced reduction in maximal
force generating capacity (Bigland-Ritchie and Woods, 1984). It is a complex
phenomenon with multiple processes and mechanisms involved at different levels, from
the CNS structures to electrical and biochemical alterations within the muscle fibers
(Enoka and Duchateau, 2008; Enoka and Stuart, 1992). Therefore, gradual reduction in
force production may occur at any one or combinations of the various sites along the
motor pathway from the CNS to the intramuscular contractile apparatus. Customarily,
these sites are divided into either central or peripheral fatigue.
Central fatigue refers to a progressive contraction-induced reduction in the ability to
activate a skeletal muscle voluntarily (Gandevia, 2001). The failure of voluntary muscle
activation is explained by fatigue-induced alterations at supraspinal and/or spinal levels.
For example, fatigue-induced suboptimal output from motor cortex, either due to
inadequate input from the sites upstream of the motor cortex or decrease in motor cortex
excitability, might result in suboptimal facilitation of alpha motoneurons and therefore
Furthermore, fatigue-related reduction in spinal excitability, resulting from increased
inhibitory muscle afferent input or modifications in the intrinsic properties of
motoneurons, could also contribute to the decline in voluntary neural drive to the active
muscle (Gandevia, 1998; Garland, 1991; Sawczuk et al., 1995).
Peripheral fatigue refers to a loss of force due to a failure in the neuromuscular signal
transmission and/or failure in the contractile apparatus of the muscle fibers (Kirkendall,
1990). Signal transmission failure occurs when impulses are not received by the muscle
and this impairment can happen along the motor axons, at the level of neuromuscular
junction, or along the surface of the muscle fibers (Bigland-Ritchie and Woods, 1984).
Contractile failure occurs within the muscle fibers and is marked by fatigue-induced
depression of the contractile properties tested independent of voluntary activation by
using electrically evoked contractions (Kirkendall, 1990).
Different types of fatigue protocols have been used to induce neuromuscular fatigue
in a variety of muscle groups in individuals with stroke (Hu et al., 2006; Riley and
Bilodeau, 2002; Svantesson et al., 1999; Tang and Rymer, 1981; Toffola et al., 2001;
Young and Mayer, 1982). Prior to the fatigue task, the maximal force-generating
capacity and the ability of the CNS to activate muscles maximally were reported to be
impaired more on the paretic side than on the non-paretic side, or when compared with
healthy controls (Riley and Bilodeau, 2002; Svantesson et al., 1999). Furthermore, Riley
and Bilodeau (2002) reported a progressive failure of voluntary activation on the paretic
side in comparison to the non-paretic side during a sustained maximal fatiguing isometric
contraction (n=2). This is an interesting finding, which should be investigated in a larger
than non-paretic limb.
During submaximal fatiguing tasks, the neural drive to the motor units of the paretic
limb, reflected by the amplitude of the EMG signal, has been reported to be greater than
that of the non-paretic limb and healthy controls, indicating that the muscles on the
paretic side had to be recruited to a greater extent to achieve and maintain the same
relative level of contraction intensity (Hu et al., 2006; Tang and Rymer, 1981). However,
studies that used EMG power frequency analysis demonstrated significantly less shift in
power frequencies after fatigue in the paretic limb relative to the non-paretic limb and
healthy controls (Hu et al., 2006; Svantesson et al., 1999; Toffola et al., 2001). A
reduction in power frequencies reflects, at least in part, a reduction in the conduction
velocity of the electrical signal along the muscle fiber membrane, i.e. peripheral fatigue.
Another example of peripheral fatigue, neuromuscular transmission failure, was also
reported to be less evident in the paretic group during a sustained submaximal (20%
MVC) fatigue task relative to the non-paretic and control groups (Hu et al., 2006). There
was only one study, which bypassed central activation by stimulating the peripheral
nerve, that demonstrated more pronounced fatigue in the paretic muscle in comparison to
the non-paretic side and healthy volunteers (Young and Mayer, 1982). Also, those
authors reported the emergence of “slow-twitch fatigable” motor units in the first dorsal
interosseousmuscle on the paretic side; motor units that produced larger forces with
slower contraction times and demonstrated an increase in fatigability. The results of that
study imply that the Type I alpha motoneurons collaterally reinnervated Type II muscle
fibers leading to motor unit transformation as has been suggested by others (Dattola et al.,
Based on the relatively few studies in the literature, it appears that increased central
fatigue, evident by the impaired voluntary muscle activation, and less peripheral fatigue,
evident by the decreased EMG spectral shift, were reported on the paretic side in
comparison to the non-paretic and healthy controls. A potential shift in the muscle fiber
composition in the paretic muscles, such as increased proportion of Type I muscle fibers
(Hara et al., 2004; Lukacs et al., 2008; McComas et al., 1973), might partially explain
less evident peripheral fatigue observed in the paretic muscles. Alternatively, impaired
voluntary muscle activation leading to an inability to produce maximal muscle force on
the paretic side would lower the intensity level for the submaximal contraction, which, in
turn, might not be sufficient enough to induce muscle fatigue. Therefore, the absolute
force differences between the paretic versus the non-paretic and/or control sides might be
another plausible reason whyfatigue on the paretic side was less evident. Also, failure in
voluntary muscle activation observed during the fatiguing task on the paretic side might
act as a protective shield against the development of peripheral fatigue. However, at this
point it is not clear which site(s) proximal to the neuromuscular junction is involved in
the reduction in voluntary activation. For instance, stroke-induced alterations in
inhibitory and/or excitatory circuitry at the cortical level would contribute to the deficits
in central activation. Furthermore, prolongation of the estimated AHP time-course would
restrict the firing of the active motor units leading to a greater reliance on motor unit
recruitment to produce any given absolute force as has been reported by others
(Gemperline et al., 1995; Hu et al., 2006; Tang and Rymer, 1981), which could also
result in central activation impairments. Susceptibility to central fatigue might be a
activities of daily living often reported by the stroke survivors, but this has not been
investigated.
1.2 THESIS OUTLINE
The majority of stroke survivors report increased fatigability during the performance
of daily activities necessary for independent living in the community. Psychosocial
factors, such as depression and lack of social support, have been associated with
increased self-reported fatigability. However, it is known that following a stroke
significant alterations occur along the entire neuromuscular system, resulting in muscle
weakness and deficits in motor control on the paretic side of the body, which
subsequently affect functional balance and mobility, known to be important determinants
of independent living in the community. Thus, the overall objective of this thesis was to
elaborate on the neuromuscular basis of fatigue post-stroke and its association with
self-reported fatigue and with functional mobility. This investigation was performed over
three sets of experiments, the results of which are presented as separate thesis chapters.
In brief, Chapter 2 is a methodological study that was designed to establish the
convergent validity of the CB&M as a measure to assess functional balance and mobility
in persons post-stroke. It was hypothesized that because of the demanding tasks included
in the CB&M, this measure would not be impacted by the presence of a ceiling effect and
thus, would be a more sensitive measure to detect deficits in functional balance and
mobility in comparison to the BBS and TUG tests.
The study reported in Chapter 3 investigated the effect of stroke on the mechanisms
underlying neuromuscular fatigue. The primary objective was to evaluate the origins of
cortical inhibition in participants with stroke, which were compared to the age- and
sex-matched controls. It was hypothesized that, following the fatigue task, peripheral fatigue
would be more evident in the control group, whereas central fatigue would be present to a
greater extent in the participants after stroke. The secondary objective of this study was
to explore the associations between self-reported fatigue, neuromuscular fatigue, and
functional mobility. The CB&M was utilized as a descriptive measure characterizing the
deficits in functional balance and mobility in the participants with stroke. Also, the
contribution of these functional deficits to long-distance mobility, measured with the
6-MWT, was investigated with anticipation that there would be a positive association
between the CB&M and 6-MWT. Furthermore, greater central fatigue was hypothesized
to be associated with higher levels of self-reported fatigue and with decreased
performance on the functional balance and mobility tests.
In the study reported in Chapter 3, it was not feasible to determine if stroke resulted
in changes in the spinal motoneurons, which also might contribute to central activation
failure observed on the paretic side of the participants with stroke. For instance,
stroke-induced changes in the intrinsic properties of motoneurons could result in slower motor
unit firing rates, which would necessitate increased recruitment of motor units to produce
a given force and potentially lead to an increased sense of effort. Thus, the purpose of
the study reported in Chapter 4 was to examine changes in the duration of the estimated
AHP time-course following stroke that may help to explain, in part, the underlying
mechanism(s) of central fatigue. It was hypothesized that the duration of the post-spike
AHP, which influences the capacity of the motoneuron to discharge action potentials,
1.3 REFERENCES
1. Adam A, De Luca CJ. Firing rates of motor units in human vastus lateralis muscle during fatiguing isometric contractions. J Appl Physiol 2005;99:268-280.
2. Arasaki K, Igarashi O, Ichikawa Y, Machida T, Shirozu I, Hyodo A, Ushijima R. Reduction in the motor unit number estimate (MUNE) after cerebral infarction. J Neurol Sci 2006;250:27-32.
3. Beaumont E, Gardiner P. Endurance training alters the biophysical properties of hindlimb motoneurons in rats. Muscle Nerve 2003;27:228-236.
4. Berg KO, Wood-Dauphinee SL, Williams JI, Maki B. Measuring balance in the elderly: validation of an instrument. Can J Public Health 1992;83 Suppl 2:S7-11.
5. Bigland-Ritchie B, Woods JJ. Changes in muscle contractile properties and neural control during human muscular fatigue. Muscle Nerve 1984;7:691-699.
6. Brown WF, Snow R. Denervation in hemiplegic muscles. Stroke 1990; 21:1700-1704.
7. Burke RE, Levine DN, Tsairis P, Zajac FE, III. Physiological types and histochemical profiles in motor units of the cat gastrocnemius. J Physiol 1973;234:723-748.
8. Byrnes ML, Thickbroom GW, Phillips BA, Mastaglia FL. Long-term changes in motor cortical organisation after recovery from subcortical stroke. Brain Res 2001;889:278-287.
9. Choi-Kwon S, Han SW, Kwon SU, Kim JS. Poststroke fatigue: characteristics and related factors. Cerebrovasc Dis 2005;19:84-90.
10. Christie A, Kamen G. Short-term training adaptations in maximal motor unit firing rates and afterhyperpolarization duration. Muscle Nerve 2010;41:651-660.
11. Clarke P, Marshall V, Black SE, Colantonio A. Well-being after stroke in
Canadian seniors: findings from the Canadian Study of Health and Aging. Stroke 2002;33:1016-1021.
12. Classen J, Schnitzler A, Binkofski F, Werhahn KJ, Kim YS, Kessler KR, Benecke R. The motor syndrome associated with exaggerated inhibition within the primary motor cortex of patients with hemiparetic. Brain 1997;120:605-619.
13. Colle F, Bonan I, Gellez Leman MC, Bradai N, Yelnik A. Fatigue after stroke. Ann Readapt Med Phys 2006;49:272-274.
stroke: an electrophysiological and morphological study. Eur Neurol 1993;33:109-114.
15. De Groot MH, Phillips SJ, Eskes GA. Fatigue associated with stroke and other neurologic conditions: Implications for stroke rehabilitation. Arch Phys Med Rehabil 2003;84:1714-1720.
16. Enoka RM, Duchateau J. Muscle fatigue: what, why and how it influences muscle function. J Physiol 2008;586:11-23.
17. Enoka RM, Stuart DG. Neurobiology of muscle fatigue. J Appl Physiol 1992;72:1631-1648.
18. Flansbjer UB, Downham D, Lexell J. Knee muscle strength, gait performance, and perceived participation after stroke. Arch Phys Med Rehabil 2006; 87:974-980.
19. Frontera WR, Grimby L, Larsson L. Firing rate of the lower motoneuron and contractile properties of its muscle fibers after upper motoneuron lesion in man. Muscle Nerve 1997;20:938-947.
20. Gandevia SC. The perception of motor commands or effort during muscular paralysis. Brain 1982;105:151-159.
21. Gandevia SC. Neural control in human muscle fatigue: changes in muscle
afferents, motoneurones and motor cortical drive [corrected]. Acta Physiol Scand 1998;162:275-283.
22. Gandevia SC. Spinal and supraspinal factors in human muscle fatigue. Physiol Rev 2001;81:1725-1789.
23. Gandevia SC, Allen GM, Butler JE, Taylor JL. Supraspinal factors in human muscle fatigue: evidence for suboptimal output from the motor cortex. J Physiol 1996;490:529-536.
24. Gardiner P, Beaumont E, Cormery B. Motoneurones "learn" and "forget" physical activity. Can J Appl Physiol 2005;30:352-370.
25. Garland SJ. Role of small diameter afferents in reflex inhibition during human muscle fatigue. J Physiol 1991;435:547-558.
26. Garnett RA, O'Donovan MJ, Stephens JA, Taylor A. Motor unit organization of human medial gastrocnemius. J Physiol 1979;287:33-43.
28. Gersten JW, Orr W. External work of walking in hemiparetic patients. Scand J Rehabil Med 1971;3:85-88.
29. Glader EL, Stegmayr B, Asplund K. Poststroke fatigue: a 2-year follow-up study of stroke patients in Sweden. Stroke 2002;33:1327-1333.
30. Gossen ER, Ivanova TD, Garland SJ. The time course of the motoneurone afterhyperpolarization is related to motor unit twitch speed in human skeletal muscle. J Physiol 2003;552:657-664.
31. Hachisuka K, Umezu Y, Ogata H. Disuse muscle atrophy of lower limbs in hemiplegic patients. Arch Phys Med Rehabil 1997;78:13-18.
32. Hara Y, Akaboshi K, Masakado Y, Chino N. Physiologic decrease of single thenar motor units in the F-response in stroke patients. Arch Phys Med Rehabil 2000;81:418-423.
33. Hara Y, Masakado Y, Chino N. The physiological functional loss of single thenar motor units in the stroke patients: when does it occur? Does it progress? Clin Neurophysiol 2004;115:97-103.
34. Heart and Stroke Foundation. Available at:
http://www.heartandstroke.com/site/c.ikIQLcMWJtE/b.3483935/k.A279/What_is
Stroke.htm. 2010.
35. Homberg V, Stephan KM, Netz J. Transcranial stimulation of motor cortex in upper motor neurone syndrome: its relation to the motor deficit.
Electroencephalogr Clin Neurophysiol 1991;81:377-388.
36. Howe JA, Inness EL, Venturini A, Williams JI, Verrier MC. The Community Balance and Mobility Scale--a balance measure for individuals with traumatic brain injury. Clin Rehabil 2006;20:885-895.
37. Hu XL, Tong KY, Hung LK. Firing properties of motor units during fatigue in subjects after stroke. J Electromyogr Kinesiol 2006;16:469-476.
38. Inghilleri M, Berardelli A, Cruccu G, Manfredi M. Silent period evoked by transcranial stimulation of the human cortex and cervicomedullary junction. J Physiol 1993;466:521-534.
39. Ingles JL, Eskes GA, Phillips SJ. Fatigue after stroke. Arch Phys Med Rehabil 1999;80:173-178.
41. Kernell D, Bakels R, Copray JC. Discharge properties of motoneurones: How are they matched to the properties and use of their muscle units? J Physiol Paris 1999;93:87-96.
42. Kirkendall DT. Mechanisms of peripheral fatigue. Med Sci Sports Exerc 1990;22:444-449.
43. Krupp LB, Pollina DA. Mechanisms and management of fatigue in progressive neurological disorders. Curr Opin Neurol 1996;9:456-460.
44. Lamontagne A, Malouin F, Richards CL, Dumas F. Mechanisms of disturbed motor control in ankle weakness during gait after stroke. Gait Posture
2002;15:244-255.
45. Liang L, Chen J, Wang Y, Jakubiec M, Mierzejewska J, Piotrkiewicz M. Changes in spinal motoneuron "Fastness" in post-stroke spastic patients. Journal of
Medical and Biological Engineering 2010;30:17-22.
46. Liepert J. Motor cortex excitability in stroke before and after constraint-induced movement therapy. Cogn Behav Neurol 2006;19:41-47.
47. Liepert J, Restemeyer C, Kucinski T, Zittel S, Weiller C. Motor strokes: the lesion location determines motor excitability changes. Stroke 2005;36:2648-2653.
48. Luft AR, Forrester L, Macko RF, McCombe-Waller S, Whitall J, Villagra F, Hanley DF. Brain activation of lower extremity movement in chronically impaired stroke survivors. Neuroimage 2005;26:184-194.
49. Luft AR, Waller S, Forrester L, Smith GV, Whitall J, Macko RF, Schulz JB, Hanley DF. Lesion location alters brain activation in chronically impaired stroke survivors. Neuroimage 2004;21:924-935.
50. Lukacs M. Electrophysiological signs of changes in motor units after ischaemic stroke. Clin Neurophysiol 2005;116:1566-1570.
51. Lukacs M, Vecsei L, Beniczky S. Large motor units are selectively affected following a stroke. Clin Neurophysiol 2008;119:2555-2558.
52. MacDonell CW, Ivanova TD, Garland SJ. Afterhyperpolarization time-course and minimal discharge rate in low threshold motor units in humans. Exp Brain Res 2008;189:23-33.
54. Mao HF, Hsueh IP, Tang PF, Sheu CF, Hsieh CL. Analysis and comparison of the psychometric properties of three balance measures for stroke patients. Stroke 2002;33:1022-1027.
55. Mayo NE, Wood-Dauphinee S, Cote R, Durcan L, Carlton J. Activity,
participation, and quality of life 6 months poststroke. Arch Phys Med Rehabil 2002;83:1035-1042.
56. McComas AJ, Sica RE, Upton AR, Aguilera N. Functional changes in motoneurones of hemiparetic patients. J Neurol Neurosurg Psychiatry 1973;36:183-193.
57. Michael KM, Allen JK, Macko RF. Fatigue after stroke: relationship to mobility, fitness, ambulatory activity, social support, and falls efficacy. Rehabil Nurs 2006;31:210-217.
58. Milot MH, Nadeau S, Gravel D, Requiao LF. Bilateral level of effort of the plantar flexors, hip flexors, and extensors during gait in hemiparetic and healthy individuals. Stroke 2006;37:2070-2075.
59. Morley W, Jackson K, Mead GE. Post-stroke fatigue: an important yet neglected symptom. Age Ageing 2005;34:313.
60. Nelles G, Spiekermann G, Jueptner M, Leonhardt G, Muller S, Gerhard H, Diener HC. Reorganization of sensory and motor systems in hemiplegic stroke patients. A positron emission tomography study. Stroke 1999;30:1510-1516.
61. Ng SS, Hui-Chan CW. The timed up & go test: its reliability and association with lower-limb impairments and locomotor capacities in people with chronic stroke. Arch Phys Med Rehabil 2005;86:1641-1647.
62. Novak AC, Brouwer B (2009) Mobility function following stroke: the impact of multiple impairments. In: Pelligrino LT (ed) Handbook of Motor Skills:
Development, Impairment and Therapy. Nova Science Publishers Inc, NY, pp 117-137.
63. Patterson SL, Forrester LW, Rodgers MM, Ryan AS, Ivey FM, Sorkin JD, Macko RF. Determinants of walking function after stroke: differences by deficit severity. Arch Phys Med Rehabil 2007;88:115-119.
64. Pennisi G, Alagona G, Rapisarda G, Nicoletti F, Costanzo E, Ferri R,
Malaguarnera M, Bella R. Transcranial magnetic stimulation after pure motor stroke. Clin Neurophysiol 2002;113:1536-1543.
65. Piotrkiewicz M, Kudina L, Mierzejewska J, Jakubiec M,
66. Podsiadlo D, Richardson S. The timed "Up & Go": a test of basic functional mobility for frail elderly persons. J Am Geriatr Soc 1991;39:142-148.
67. Rice CL, Cunningham DA (2002) Aging of the neuromuscular system: influences of gender and physical activity in active human muscle. In: Shephard RJ (ed) Gender, Physical Activity, and Aging. CRC Press, London, pp 121-150
68. Riley NA, Bilodeau M. Changes in upper limb joint torque patterns and EMG signals with fatigue following a stroke. Disabil Rehabil 2002;24:961-969.
69. Rosenfalck A, Andreassen S. Impaired regulation of force and firing pattern of single motor units in patients with spasticity. J Neurol Neurosurg Psychiatry 1980;43:907-916.
70. Sacco P, Thickbroom GW, Byrnes ML, Mastaglia FL. Changes in corticomotor excitability after fatiguing muscle contractions. Muscle Nerve 2000; 23:1840-1846.
71. Salbach NM, Mayo NE, Higgins J, Ahmed S, Finch LE, Richards CL.
Responsiveness and predictability of gait speed and other disability measures in acute stroke. Arch Phys Med Rehabil 2001;82:1204-1212.
72. Sawczuk A, Powers RK, Binder MD. Intrinsic properties of motoneurons. Implications for muscle fatigue. Adv Exp Med Biol 1995;384:123-134.
73. Scelsi R, Lotta S, Lommi G, Poggi P, Marchetti C. Hemiplegic atrophy. Morphological findings in the anterior tibial muscle of patients with cerebral vascular accidents. Acta Neuropathol (Berl) 1984;62:324-331.
74. Sisson RA. Life after a stroke: coping with change. Rehabil Nurs 1998; 23:198-203.
75. Slager UT, Hsu JD, Jordan C. Histochemical and morphometric changes in muscles of stroke patients. Clin Orthop Relat Res 1985;199:159-168.
76. Solomon NP, Robin DA. Perceptions of effort during handgrip and tongue elevation in Parkinson's disease. Parkinsonism Relat Disord 2005;11:353-361.
77. Staub F, Bogousslavsky J. Post-stroke depression or fatigue. Eur Neurol 2001;45:3-5.
78. Stroke Statistics. Heart and Stroke Foundation of Canada. Available at:
79. Sunnerhagen KS, Svantesson U, Lonn L, Krotkiewski M, Grimby G. Upper motor neuron lesions: their effect on muscle performance and appearance in stroke patients with minor motor impairment. Arch Phys Med Rehabil 1999;80:155-161.
80. Svantesson UM, Sunnerhagen KS, Carlsson US, Grimby G. Development of fatigue during repeated eccentric-concentric muscle contractions of plantar flexors in patients with stroke. Arch Phys Med Rehabil 1999;80:1247-1252.
81. Tang A, Rymer WZ. Abnormal force-EMG relations in paretic limbs of hemiparetic human subjects. J Neurol Neurosurg Psychiatry 1981;44:690-698.
82. Thickbroom GW, Byrnes ML, Archer SA, Mastaglia FL. Motor outcome after subcortical stroke: MEPs correlate with hand strength but not dexterity. Clin Neurophysiol 2002;113:2025-2029.
83. Thickbroom GW, Sacco P, Kermode AG, Archer SA, Byrnes ML, Guilfoyle A, Mastaglia FL. Central motor drive and perception of effort during fatigue in multiple sclerosis. J Neurol 2006;253:1048-1053.
84. Toffola ED, Sparpaglione D, Pistorio A, Buonocore M. Myoelectric
manifestations of muscle changes in stroke patients. Arch Phys Med Rehabil 2001;82:661-665.
85. Traversa R, Cicinelli P, Oliveri M, Giuseppina PM, Filippi MM, Pasqualetti P, Rossini PM. Neurophysiological follow-up of motor cortical output in stroke patients. Clin Neurophysiol 2000;111:1695-1703.
86. Tseng BY, Kluding P. The relationship between fatigue, aerobic fitness, and motor control in people with chronic stroke: a pilot study. J Geriatr Phys Ther 2009;32:97-102.
87. Tyson SF, DeSouza LH. Reliability and validity of functional balance tests post stroke. Clin Rehabil 2004;18:916-923.
88. Tyson SF, Hanley M, Chillala J, Selley A, Tallis RC. Balance disability after stroke. Phys Ther 2006;86:30-38.
89. van de Port I, Kwakkel G, van Wijk I, Lindeman E. Susceptibility to deterioration of mobility long-term after stroke: a prospective cohort study. Stroke
2006;37:167-171.
90. Wheaton LA, Villagra F, Hanley DF, Macko RF, Forrester LW. Reliability of TMS motor evoked potentials in quadriceps of subjects with chronic hemiparesis after stroke. J Neurol Sci 2009;276:115-117.
92. Young JL, Mayer RF. Physiological alterations of motor units in hemiplegia. J Neurol Sci 1982;54:401-412.
CHAPTER 2
VALIDITY OF THE COMMUNITY BALANCE AND MOBILITY SCALE IN COMMUNITY-DWELLING PERSONS AFTER STROKE1
2.1 INTRODUCTION
Balance deficits are among the most persistent impairments and common concerns of
stroke survivors, as balance is fundamental to optimal mobility and performance of many
activities of daily living (Tyson et al., 2006). Factors such as the severity of neurologic
deficits, poor motor control and lower limb muscle weakness negatively affect the
performance of tasks involving functional balance and mobility (Flansbjer et al., 2006;
Lamontagne et al., 2002; Patterson et al., 2007). These stroke-induced deficits result in
the increased level of effort and energy expenditure during activities involving balance
and mobility (Gersten and Orr, 1971; Macko et al., 2001; Milot et al., 2006), which might
also contribute to the increased post-stroke self-reported fatigability (Ingles et al., 1999;
Michael et al., 2006; van de Port et al., 2006).
Several evaluation tools, including the Berg Balance Scale (BBS) (Berg et al., 1992),
Postural Assessment Scale for Stroke (PASS) (Benaim et al., 1999), the balance subscale
of the Fugl-Meyer test (Fugl-Meyer et al., 1975), and the Timed Up and Go (TUG)
(Podsiadlo and Richardson, 1991) have been developed and frequently used to assess
balance and mobility in patients with stroke. The psychometric properties of these scales
are found to be good; however, ceiling effects can limit their utility when assessing
patients with moderate to mild degrees of neurologic impairments (Mao et al., 2002;
Salbach et al., 2001; Wang et al., 2005).
1
A version of this chapter has been published and is used with permission.
Wang and colleagues examined the evaluative properties of the PASS (Wang et al.,
2005). This scale consists of 12 items assessing the ability to maintain or change from a
lying, sitting or standing posture with each item scored from 0 to 3. Notable ceiling
effects were found as early as 3 months following stroke, limiting the ability of the PASS
to discriminate between individual patients. While participants in the study had a wide
spectrum of trunk control abilities (asymptomatic to bedridden) at intake, at 3 months
post-stroke more than 75% of the participants achieved the highest scores for items on the
PASS. The authors concluded that the sensitivity to change and the discriminative
abilities of the PASS are limited to the first 3 months after stroke.
Similar findings were reported by Mao and colleagues who compared the
psychometric properties of the balance subscale of the Fugl-Meyer test, BBS and PASS
amongst participants with stroke of different severity (Mao et al., 2002). According to
this study, all three balance measures demonstrated excellent interrater reliability and
high internal consistency; however, all measures lacked the sensitivity to detect
participants’ improvement after 3 months post-stroke due to ceiling effects.
Salbach and colleagues evaluated the responsiveness of the TUG in stroke survivors
at 8 and 38 days post-stroke (Salbach et al., 2001). In this study, the authors chose the
value of 8.5 seconds as a point representing the maximum performance score for this test
based on the normative values reported for a sample of healthy, elderly people
(Bohannon, 2006). A greater number of participants achieved the cut-off score at the
second evaluation (32%) compared to the first (8%), which might have contributed to the
To monitor recovery over time and determine the effectiveness of rehabilitative
services, it is critical to choose an outcome measure that is suited to the patient’s level of
abilities and sensitive enough to capture improvements in balance and mobility following
strokes of varied severity. Several commonly used scales lack sensitivity to change in
those with moderate to mild impairments. The frequently reported ceiling effects
negatively affect the ability of any clinical measure to detect change over time.
Therefore, the practice of stroke rehabilitation is in need of an outcome measure of
adequate sensitivity to assess balance and mobility in moderate to high functioning
patients following stroke, who are in the process of returning to community living.
The CB&M incorporates the demanding tasks, commonly performed in the
community (e.g. walking and looking at a target), to assess a wide range of mobility and
balance abilities in ambulatory patients (Howe et al., 2006). The CB&M was initially
designed for use with ambulatory patients following traumatic brain injury who are
functioning at a high level yet have persistent balance problems. The properties of this
scale showed high reliability and moderate to high validity in this patient group (Howe et
al., 2006). Before considering the CB&M for use in stroke, it is necessary to examine
whether the items are appropriate and the resolution of scoring adequate especially for
those with moderately severe stroke. Floor effects, participants scoring the minimum
possible score, would limit the utility of the CB&M in evaluating functional balance and
mobility following stroke. To date this has not been examined.
The main objectives of the present study were: i) to examine the convergent validity
of the CB&M against the BBS and TUG; ii) to determine the relative sensitivity of the
BBS and TUG; and iii) to evaluate floor and ceiling effects of the CB&M in participants
in sub-acute and chronic phase after stroke (3 and 8 months post-stroke, respectively).
Because the CB&M incorporates activities such as running, hopping, and stair climbing,
the level of lower limb motor recovery and strength may be relevant. Thus, the
secondary objective was to identify associations between the CB&M performance and
lower limb motor recovery and strength.
We expected that convergent validity of the CB&M would be evident through a
strong positive association with the BBS and a strong negative correlation with the TUG.
We hypothesized that the CB&M would reveal the greatest sensitivity to change and the
higher scores would reflect higher function and greater lower limb torque production.
2.2 METHODS
Participants were included in the study if the following criteria were met: i) first
unilateral hemispheric stroke that required inpatient rehabilitation, ii) English speaking,
and iii) scheduled for discharge to live in the community (private house or apartment)
with or without paid health services. Those unable to follow simple verbal instructions or
with serious co-morbidities (e.g. cancer, mobility limiting arthritis) were excluded.
Ethics approval was obtained from the local institutional review board. All participants
signed an informed consent prior to their participation.
2.2.1 Participants
Age, weight, height, sex, side of hemiparesis, type of stroke, time post-stroke, and the
Functional Independence Measure (FIM) were collected to describe the sample studied.
weight (kg) ÷ (height (m))2.
The FIM scores were used to describe the overall functional independence status of
the study participants (Keith et al., 1987). This measure consists of 18 items, 13 of which
relate to motor function (e.g. grooming, transfer, locomotion) and 5 items that measure
social-cognitive abilities (e.g. comprehension, memory, social interaction, problem
solving). Each item is scored using a 7-point ordinal scale (1 = complete assistance to
perform activities of daily living and 7 = complete independence in performing basic
activities of daily living). The possible total score ranges from the lowest to the highest
level of independence (18-126, respectively). The reliability and validity of the FIM
have been studied extensively (Daving et al., 2001; Dodds et al., 1993).
2.2.2 Assessment of Lower Limb Motor Control Impairments
Chedoke McMaster Stroke Assessment. The CMSA Impairment Inventory is a valid
and reliable measure of the presence and severity of stroke-induced physical impairments
(Gowland et al., 1993). The subscales for the leg and foot were used to evaluate the
stages of motor recovery in the lower limb. The ability to perform standard movements
was scored from 1 to 7 (1 = unable to perform and 7 = normal movement). High intra-
and inter-rater reliability and moderate to high validity have been reported for the CMSA
measure (Gowland et al., 1993).
2.2.3 Assessment of Functional Balance and Mobility
Berg Balance Scale. The BBS evaluates functional balance based on the
performance of 14 tasks of varying difficulty including sitting and standing activities
and 4 = able to perform independently). The maximum BBS score is 56, with higher
scores representing better balance. Validity and reliability of the BBS have been
established in patients with stroke (Berg et al., 1995; Mao et al., 2002; Tyson and
DeSouza, 2004).
Timed Up & Go. The TUG is a functional mobility test that requires participants to
stand up from an armchair, walk 3 meters, turn around, walk back to the chair and return
to a seated position (Podsiadlo and Richardson, 1991). The time taken to complete the
task is measured with a stopwatch and recorded in seconds, with shorter time
representing better functional mobility. The TUG has been widely used as a valid and
reliable measure to monitor changes in mobility skills in patients with stroke (Ng and
Hui-Chan, 2005; Podsiadlo and Richardson, 1991; Salbach et al., 2001).
Community Balance and Mobility Scale. The CB&M evaluates balance and
mobility status on 19 tasks including advanced functional balance and mobility activities
(e.g. hopping on one leg, running) (Howe et al., 2006). Items are scored on a scale of 0
to 5 (0 = unable to perform and 5 = able to perform independently). One item is scored
from 0 to 6, with an extra point given for carrying a basket while descending stairs. The
CB&M was modified for participants with severe hemiparesis in the upper extremity by
allowing them to perform carrying tasks one-handed. The maximum score is 96 points,
with higher scores indicative of better balance and mobility. The validity and reliability
of this outcome measure have been established for participants with traumatic brain
injury (Howe et al., 2006), but not in patients with stroke.
2.2.4 Lower Limb Strength Assessment