Adaptive Thresholding for Edge Detection in
Gray Scale Images
Manisha Kaushal1, Arjan Singh 2 , Baljit Singh3
1
Manisha Kaushal,* Department of Computer Science, IET Bhaddal. Punjab [email protected] 2
Arjan Singh, Department of Computer Science Engineering, BBSBEC FatehgarhSahib. Punjab [email protected]
3
Baljit Singh, Department of Computer Science Engineering, BBSBEC FatehgarhSahib. Punjab [email protected]
Abstract
Digital image processing is a subset of the electronic domain, wherein the image is converted to an array of small integers, called pixels, representing a physical quantity. Edges characterize boundaries and edge detection is one of the most difficult tasks in image processing hence it is a problem of fundamental importance in image processing. The problem of edge detection although it is fundamental and is existing since years but it is still an area where there is still scope of research. It has been found that the previous used algorithms or methods were not able to produce ideal or optimized results. This paper presents an edge detection method applicable to gray level images in which an objective function is used to extract edge points as well as their directions. Adaptive thresholding technique is used there after to suppress non maximum points and to highlight edge points.
K e y w o r d s
Edge Detection, Objective Function, Adaptive threshold I n t r o d u c tio n
Edge detection is in the forefront of image processing. For object detection, it is crucial to have a good understanding of edge detection algorithms. It is one of the most commonly used operations in image analysis. An edge is the boundary between an object and the background. In this section, work done in the area of edge detection is reviewed and focus has been made on detecting the problems of the previous work done.
method uses the same edge intensity as that of Sobel method to define edge angle as tan-1Ey/Ex. The Canny method can detect much thinner edges than the Sobel method. However, both Canny and Sobel methods will obtain zero intensity if a line of one-pixel-width passes through the mask and then the incorrect edge called “double edges” on the both sides of this line will be generated. Furthermore, the edge intensity values obtained by the Sobel method and Canny method may be very large and out of some known range [6]. So the threshold value should be based on many heuristic attempts in an unknown range. [9] used the concept of Fuzzy Edge detector to avoid the occurrence of double edges and stated that fuzzy logic is a good edge detection method that uses a 3×3 mask containing the center pixel and its eight neighbor pixels. The theory of neural network [6] has also been applied for the problem of edge detection. [6] had proposed edge detection technique based on back propagation (BP) neural network in which different edge patterns are classified in 18 categories and neural was trained to detect such 18 patterns. The method was good as compared to Sobel and Robert’s operators and could extract corners and arcs. [7] used the concept of Cellular Neural Networks(CNN) in which image emphasis method is applied to extract edge information and then a binary image is made to decrease the noise. Although [7] produces very good results but disadvantage of [7] is that it is more time consuming as compared to simple neural network. Hence it is clear that the problem of edge detection is still demanding and happening field of image processing.
Materials and Methods
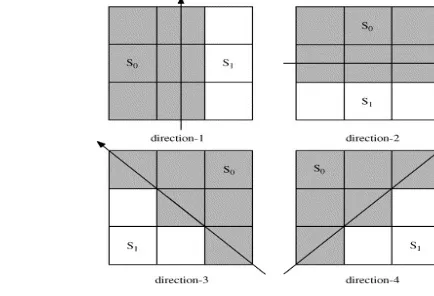
The proposed algorithm is based on Adaptive Thresholding approach of Edge Detection for gray scale images and is implemented in Matlab 7.0. The 3×3 mask shown in Fig 1 from the image is considered and two pixel sets S0 and S1 in the mask are used to define an objective function. The values of the objective function corresponding to four directions determine the edge intensity and edge direction of each pixel in the mask. After all pixels in the image have been processed, the edge map and direction map are generated by using proposed functions and methods. After all the edge points have been processed, the concept of adaptive thresholding is used to highlight edge points. The proposed technique for edge detection is given below:
Fig: 1: 3X3 mask Fig 2: Four possible directions of edges
In the edge pattern of direction-1, nine pixels can be divided into two sets, S0 and S1 as S0={p1,p2,p4,p5,p7,p8} and S1={p3,p6,p9}. Similarly, S0={p1,p2,p3,p4,p5,p6} and S1={p7,p8,p9} for the edge of direction-2, S0={p1,p2,p3,p5,p6,p9} and S1={p4,p7,p8} for the edge of direction-3, and S0={p1,p2,p3,p4,p5,p7} and S1={p6,p8,p9} for the edge of direction-4.
Consider a 3×3 mask in a local image in which any one type of edges described above may exist. Let us define an objective function in order to estimate edge intensity corresponding to the edge direction-i
where numerator and denominator are defined as below
Where
and
m n 0 m n 0
m n m n
p ,p S
p ,p S
1 1
min
p -p
1
min
p -p
f
D
2 2
15
m>n, m>n,mnw
3
mnw
Where w1 and w2 are threshold values obtained after performing numerous experiments
Four objective function’s values f1, f2, f3, f4 corresponding to four directions will be compute. The edge intensity E(x, y) and the edge direction D(x, y) for the center pixel (x, y) in the mask is defined as:-
E(x, y) = max (f1, f2, f3, f4) and D(x, y) = Arg (max (f1, f2, f3, f4)). (x-1,y+1) P1 (x,y+1) p2 (x+1,y+1) p3 (x-1,y) P4 (x,y) p5 (x+1,y) P6 (x-1,y-1) P7 (x, y-1) p8 (x+1,y-1) p9 1 0 1
m in
m -m
w
f
N
The edge map with each pixel (x,y) replaced by E(x,y) and the direction map with each pixel replaced by D(x,y) are generated. In other words E(x,y) and D(x,y) of all pixels are obtained. After that the image is divided into different segments based on its intensity values. For every segment a threshold value (T) based on averaging of the pixel values will be calculated and the following approach is used to detect edge points
If E(x,y)<T, where T is a threshold value, then the pixel will be discarded . If E(x, y) >= T, then the following technique is applied to make sure that the center pixel is an edge pixel when any one of the following four cases occurs:
(1) D(x,y) =1 and E(x,y)>E(x-1,y) & E(x,y)>E(x+1,y) (2) D(x,y)=2 and E(x,y)>E(x,y-1) & E(x,y)>E(x,y+1) (3)\D(x,y)=3and E(x,y)>E(x-1,y-1)&E(x,y)>E(x+1,y+1) (4)D(x,y)= 4 and E(x,y)>E(x-1,y+1) & E(x,y)>E(x+1,y-1)
So four objective functions f1, f2, f3,f4 are generated and by applying the above algorithm the edge intensity E(x,y) and the edge direction D(x,y) for the all the pixels (x,y) in the mask can be calculated and then adaptive threshold technique can be applied to detect pixels belonging to the edges. This adaptive thresholding technique is the heart of the proposed technique and is the pioneer in getting the ideal edges.
Results and Discussions
Example 1: Consider the “lenna” image of 256 X 256 resolution shown in Fig 3. The results show output of our
method with w1=90 and w2=40. From the figure we can clearly see that the proposed method detects edges those are of very low intensity. Canny and Sobel both failed to detect these edges even though they were implemented on optimal threshold.
Example 2: Consider the “cameraman” image Fig 4 with 8-bit gray level. The proposed method with w1=80 and w2=40, by applying adaptive threshold we extract the edges. Figure also shows the results of applying sobel and canny. The edges detected by our method are complete and true. It is observed that Canny at some places detected edges that were not true while Sobel failed to detect edges in the background.
Fig 4 Comparison of different algorithms a) Original cameraman Picture (b) Sobel (c) Canny (d) Proposed method
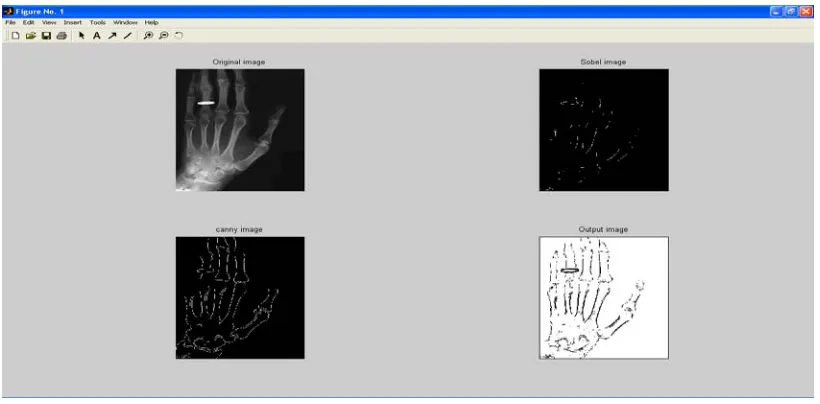
Example 3 :- Consider the X-ray image of bones of a patient in fig 5. The figure shows the results of the proposed
method . The results clearly demonstrate that the proposed method is far superior that canny and sobel algorithm. While sobel failed completely to detect any kind of edge and canny detected edges with discontinuities.
The results show that our proposed method is better than traditional approaches for edge detection as the thickness of edges found by the proposed method is very thin. Accurate edges are found and false edges are eliminated by the proposed technique. Although canny algorithm is still very good at detecting edges but still proposed method gave better results than Canny algorithm however proposed method is bit slow as compared to other methods.
References
[1] Larry S. Davis,” A survey of edge detection techniques” Computer Graphics and Image Processing, Vol 4, issue 3, September 1975.pp 248-270.
[2] John Canny. “A computational approach to edge detection” IEEE Transactions on Pattern Analysis and Machine Intelligence, 8(6), November1986. http://ieeexplore.ieee.org/stamp/stamp.jsp?arnumber=04767851.
[3] D. Marr and E. C. Hildreth. “Theory of edge detection” In Proceedings of the Royal Society of London”, volume B207, pages 187–217, 1990.
[4] Ching-Yu Tyan and Paul P. Wang, “Image Processing Enhancement, Filtering and Edge Detection Using the Fuzzy Logic Approach”, IEEE, 1993. http://ieeexplore.ieee.org/stamp/stamp.jsp?arnumber=00327420
[5] D.Ziou and S.Tabbone ” Edge detection techniques - an overview”. Technical Report AI Memo 833, Massachusette Institute of Technology, Artificial Intelligence Laboratory, 1997.
[6] Zhengquan He and M Y Siyal , “Edge Detection with BP Neural Networks” School of Electronic and Electrical Engineering, Nanyang Technological University, Singapore 1998.
[7] T. Yoshida , J Kawata, T. Tada, A. Ushida, and J. Morimoto, “Edge Detection method with CNN”,SICE annual conference in Sapporo, Hokkaido institute of Technology, Japan 2004.
[8] C. Kanga and W Wang, “A novel edge detection method based on the maximizing objective function ”, Pattern Recognition Society, Elsevier B.V, volume 40 issue 2, 18 May 2006. doi:10.1016/j.patcog.2006.03.016.
[9] Shashank Mathur, Anil Ahlawat, “Application of Fuzzy Logic on Image Edge Detection”, Proceedings of the International Conference , Intelligent Information and Engineering Systems’, Varna, Bulgaria, 2008.
[10] O. R. Vincent and O. Folorunso, “A Descriptive Algorithm for Sobel Image Edge Detection”, Proceedings of Informing Science & IT Education Conference (InSITE) 2009.
[11] Tanvir Ahmed Abbasi and Mohammad Usaid Abbasi, “A Novel Architecture for Prewitt Edge Detector”, Journal of Active and Passive Electronic Devices, vol. 8, pp. 203–211, 2009.