© 2016, IJCSMC All Rights Reserved 662
Available Online atwww.ijcsmc.com
International Journal of Computer Science and Mobile Computing
A Monthly Journal of Computer Science and Information Technology
ISSN 2320–088X
IMPACT FACTOR: 5.258
IJCSMC, Vol. 5, Issue. 5, May 2016, pg.662 – 668
Analyzing the Congestion and Flow Control
in UDP Protocol Using NS2
Nikita
1, Shikha Gupta
21
Department of Computer Engineering, Advanced institute of Technology & Management, Palwal, Haryana, India
2
Department of Computer Engineering, MDU, Faridabad, Haryana, India
1
[email protected]; 2 [email protected]
ABSTRACT: As the enormous use of computer network spread day by day to establish network connections between sending and receiving nodes to send data packets from source to destination in such a way that the data packets would send to correct destination with no loss of data packets and it also provides a router connection which routes the packets from source to destination. In this paper we introduce the wired network simulation using NS2 on UDP protocol in which we simulate the wired network design using 5-node scenario and analyze packet drop rate in this using UDP protocol in NS2 as simulator and also analyze the packet flow scenario performance of designed wired network using Xgraph.
KEYWORDS: NS2, Packet Flow, UDP, Wired network, Xgraph
I. INTRODUCTION TO SIMULATION:
Simulation is the most popular technology in modern time for performance prediction. Simulation models can also be used for simulating network on computer. Simulation is a technique which attempts to reproduce the behavior of the network in the time domain. Many types of simulators exist like graphical user interface drive, Event-Driven Simulation etc. Event driven simulation defines a network in terms of states and transitions where event triggers the transitions. Simulation is a numeric solution to utilize systems of equations and data structures to capture the behavior of the simulated network in terms of logical conditions. Three types of simulators are present which are as follows:
Test Driven, Program Driven and Distribution driven
© 2016, IJCSMC All Rights Reserved 663 II. INTRODUCTION TO NS2:
NS2 plays a very important role as a simulation tool for implementing different protocol like the physical layer protocol (ETHERNET, DSL, MAC etc.), routing protocols (RIP, IGRP), Transport layer protocol (TCP, UDP) and Network protocols(IP) of different types of network. NS2 is widely used tool to simulate the behavior of wired and wireless networks. NS2 is an open-source Event-Driven simulator designed to analyze the performance of protocols.
NS2 provide users with an executable command “ns” which takes one input argument which is the name of a Tcl simulation scripting file. [1] A simulation trace file is then created which can be used to plot graphs and/or to create animations. NS2 doesn’t support windows because package configuration is tedious in windows. As we designed a 5 wired node simulation scenario over UDP protocols to check their topologies whether they are supporting popular network protocols to offer simulation results for wireless networks or not. [6]As we know NS2 supports for simulation of both wired and wireless network and is best suitable for the projects related to networking as it works on packet transmission scenarios i.e. how packets can be transmitted or received from source to destination which offers packet level inspection i.e. how it is dropped, percentage of packet dropped and why ii is dropped using various traffic generators which generates traffic using different parameters. In this paper, we elaborate about experimental traffic generator in which we set-up a 5 nodes wired network in which TCP agents (tcp1, tcp2, tcp3) over source nodes(node0, node1, node2) respectively to connect TCP agents with each source node as we need to create a TCP agent before the data packets to be send from source to transmit data packets successfully. Need of TCP agent is to generate traffic which will be transmitted with the packets.[2] Various traffic generators are present for generating traffic at source nodes. For example, CBR, VBR, and Exponential etc. NAM stands for Network AniMator window is a visualization tool used in NS2 to provide outputs on a Window screen which shows the network scenarios like at what time and at how much rate data packets starts dropping etc.
III. INTRODUCTION TO UDP PROTOCOL IN NS2:
UDP (User Datagram Protocol) is a connectionless transport layer protocol, where no connection set-up is needed before data transfer. UDP provides minimal transport layer functionalities and non-guaranteed data packet delivery which helps in providing applications a direct access to the network layer. It provides multiplexing/ de-multiplexing functions and light error checking but it adds nothing to IP packets. [5] When application developers use UDP as a transport layer protocol then direct communication established between application and the network layer. UDP takes data packets from an application process, then connect source and destination ports for multiplexing/ de-multiplexing process and adds error checking and length information fields with them and then passes the result packets to the network layer which encapsulates the UDP packets into a network layer packet and then delivers the encapsulated packets at the receiving host.[4] When a UDP packet arrives at receiving host, it is further delivered to UDP agent at receiving end which is identified by the destination port field in the packet header.
To create connection with agents in UDP:
1. Set src[new Agent/UDP]
2. Set rcv[new Agent/null]
3. $ns connect $src$rcv
IV. NS2 ARCHITECTURE:
© 2016, IJCSMC All Rights Reserved 664
Two classes are present in Tclcl file i.e. class agent class and class application.
Class Agent: All source nodes in the network are used for sending and receiving data packets which are termed as traffic that has an agent attached to the nodes to send/ receive the data. [5] In this we are using UDP agents for this.
Class Application: Class application uses class agents to send/ receive data packets.
Fig. 1 Combination of C++ and Tcl to make OTcl
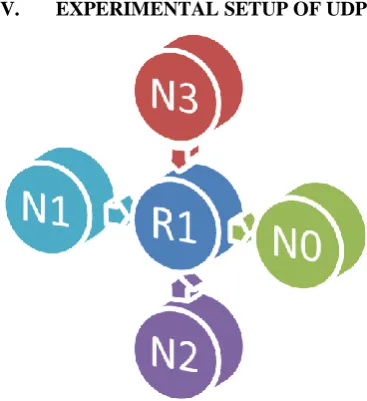
V. EXPERIMENTAL SETUP OF UDP
Fig.2 Experimental Setup of 6-node wired UDP network
The above mentioned figure is an experimental setup of 5 nodes in which N1, N2, N3 are the source nodes which are used totransfer data packets by the TCP agent and exponential packet is attached with the 3 source nodes. [11] There are mainly four Parameters of exponential traffic as follows:
1. Data Packet size
2. Transmission rate
3. Burst time of Transmission
© 2016, IJCSMC All Rights Reserved 665
These four parameters of exponential traffic generate traffic in the form of packets on the source nodes and sends to the router node R1 at that time [9] which results to congestion or the packets of some data falls down through the router node R1 and remaining packets are successfully sends to destination node N0.
VI. ALGORITHM Simulation script which creates the network using UDP:
Proc si{} {
1. Set ns[Simulator instance] 2. Set time 0.1 or 0.6 or any other
3. Set bw_name[$sink1setbytes_]
4. Set now[$ns now]
5. Now calculate the bandwidth by:
6. $bw_name/$time*8/1000000]” to calculate the bandwidth of these three files f1,f2,f3 7. Now set the byte $sink1,2,3 set bytes_1,2,3
8. Now calculate the record time for which procedure call again and again $ns at [expr$now+$time]”record”
}#then after that coding steps are followed as 9. Schedule events for the CBR agents cbr3 start”
$ns at 6.0 “$cbr1” $ns at 0.1 “$cbr1 start” $ns at 0.5 “$cbr2 start” $ns at 1.0 “$stop” $ns at 5.0 “$cbr2 stop” $ns at 4.5 “$cbr3 stop” $ns at 7.0 “finish”
10. Run the created simulation as $ns run
This algorithm works for design and performance analysis of UDP protocol.
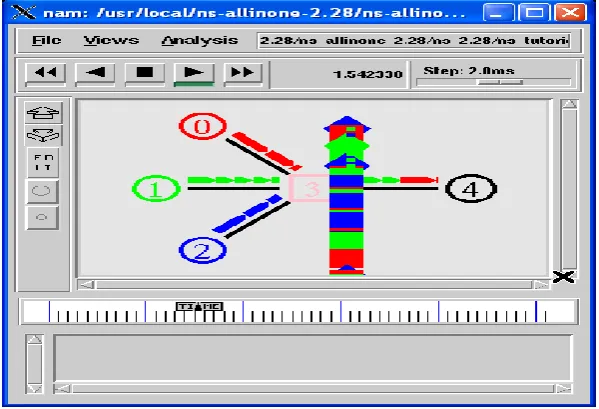
VII. RESULT ANALYSIS:
The results shown in the following figures, the packet is dropped at that instant of time when the CBR traffic rate is in mb.
© 2016, IJCSMC All Rights Reserved 666
This wired network scenario shows how n0, n1, n2 are source node and n4 as destination node and n3 as router window. Initially n0 node starts sending data packets to destination node n4 from router n3. Then node n1 also starts sending data packets to destination node n4 from router n3. Now node n0 and n1 are sending data packets to router n3 at the same time which results to congestion and packets start to drop by node n3. N2 node also starts sending data packets to node n3 which results more congestion and packet drop rate increases.
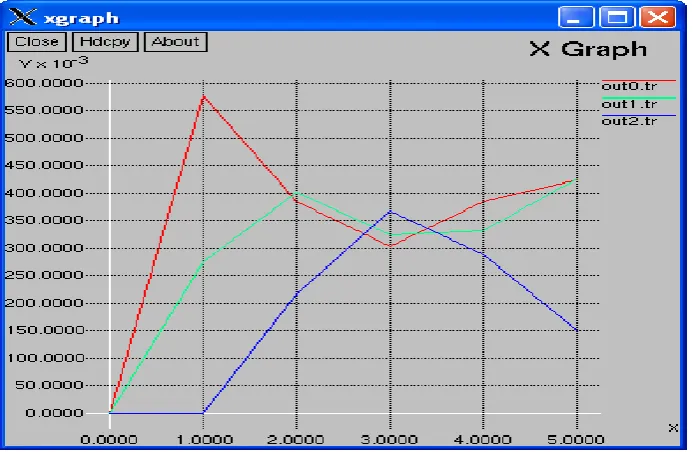
A. Performance analysis using Xgraph:
Graphical representation of transmission in which data packets are transmitted from 3 source nodes n0, n1, n2 to destination node n4.
Fig. 4Performance graph shows transmission rate
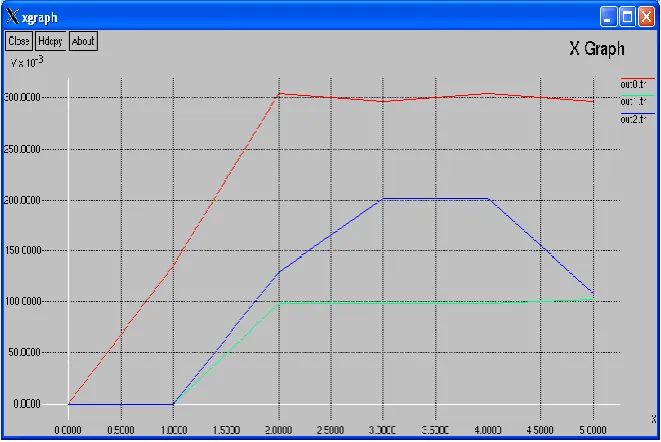
B. Results after altering the Rate parameters:
© 2016, IJCSMC All Rights Reserved 667
C. Performance Analysis through Xgraph after altering rate parameters:
Fig. 6Performance graph when no packet dropped
VIII. CONCLUSION
In this paper we discussed about the wired scenarios for UDP protocol and Packet drop rate with different Packet flow rate parameters. In this we shown how change in timer can affect packet flow rate and packet dropped rate with different timers. We used Xgraph for graphical representation of packet flow rate in which x-axis indicates megabits (mb) and y-axis indicates time in seconds (s). In this we simulated 5-wired network using NS-2 output of which is shown in NAM and analysis of output in graphical representation using Xgraph.
ACKNOWLEDGEMENT
I would like to express my profound gratitude and best regard to my project guide (Shikha Gupta), for her exemplary guidance, valuable feedbacks at each point and constant encouragement throughout the duration of the research. Her valuable suggestions/ Feedbacks were of immense help throughout my project work. Her perceptive criticism kept me working hard to complete this project in a much better way. Working under her was a knowledgeable experience for me.
R
EFERENCES[1] Ajay Singh, Dr. Pankaj Dashore, “Packet Flow Analysis in Wireless Scenario”, International Journal of Advanced Research in Computer Science and Software Engineering, Volume 3, Issue 6, June 2013.
[2] FIPS PUB 46-2, “Data Encryption Standard (DES)”, Dec.1993
[3] Sirwan A.Mohammed, Prof. Dr. Sattar B.Sadkhan, “Design of wireless network based on NS-2, Journal of Global Research in Computer Science,Volume 3, No. 12, December 2012
[4] Yun Zhou and Yuguang Fang, “Network security and attack Defense”, Institue of electrical and Electronics Engineers, 2009. [5] Johanna Antila, “TCP Performance Simulations Using Ns2”, 51189d TLT
[6] IETF RFC 2040, “The rc5,rc5-cbc, rc-5-cbc-pad, abd rc-5-cts algorithms”, Oct.1996
© 2016, IJCSMC All Rights Reserved 668
[8] W.Diffie and M.E. Hellman, “New directions in Cryptography”, IEEE Transaction on Information Theory, Vol. IT-22, no.6, Nov 1976, pp-644-654 [9] Panayiotis kotzanikolaou, Christos douligeris “computer network security: basic background and current issues”, institute of electrical and
electronics engineers, Inc. 2007.
[10] Hamza Rahmani, Nabil Sahli, Farouk Kamoun, “DDoS flooding attack detection scheme based on F-divergence”, Computer Communications 35
(2012) 1380–1391, Elsevier