Western University Western University
Scholarship@Western
Scholarship@Western
Electronic Thesis and Dissertation Repository
10-17-2011 12:00 AM
Three-Dimensional Modeling of Electrostatic Precipitator Using
Three-Dimensional Modeling of Electrostatic Precipitator Using
Hybrid Finite Element - Flux Corrected Transport Technique
Hybrid Finite Element - Flux Corrected Transport Technique
Niloofar Farnoosh
The University of Western Ontario
Supervisor
Kazimierz Adamiak
The University of Western Ontario Joint Supervisor G. S. Peter Castle
The University of Western Ontario
Graduate Program in Electrical and Computer Engineering
A thesis submitted in partial fulfillment of the requirements for the degree in Doctor of Philosophy
© Niloofar Farnoosh 2011
Follow this and additional works at: https://ir.lib.uwo.ca/etd
Part of the Numerical Analysis and Scientific Computing Commons, and the Other Electrical and
Computer Engineering Commons
Recommended Citation Recommended Citation
Farnoosh, Niloofar, "Three-Dimensional Modeling of Electrostatic Precipitator Using Hybrid Finite Element - Flux Corrected Transport Technique" (2011). Electronic Thesis and Dissertation Repository. 291.
https://ir.lib.uwo.ca/etd/291
This Dissertation/Thesis is brought to you for free and open access by Scholarship@Western. It has been accepted for inclusion in Electronic Thesis and Dissertation Repository by an authorized administrator of
THREE-DIMENSIONAL MODELING OF ELECTROSTATIC
PRECIPITATOR USING HYBRID FINITE ELEMENT - FLUX
CORRECTED TRANSPORT TECHNIQUE
(Spine title: 3-D Modeling of ESP Using Hybrid FE - FCT Technique)
(Thesis format: Monograph)
By
Niloofar Farnoosh
Graduate Program in Engineering Science
Department of Electrical and Computer Engineering
A thesis submitted in partial fulfillment
of the requirements for the degree of
Doctor of Philosophy
The School of Graduate and Postdoctoral Studies
The University of Western Ontario
London, Ontario, Canada
THE UNIVERSITY OF WESTERN ONTARIO School of Graduate and Postdoctoral Studies
CERTIFICATE OF EXAMINATION
Co Supervisors
______________________________ Dr. Kazimierz Adamiak
______________________________ Dr. G.S. Peter Castle
Examiners
______________________________ Dr. Cedric Briens
______________________________ Dr. William D. Greason
______________________________ Dr. Glenn Harvel
______________________________ Dr. Jayshri Sabarinathan
The thesis by
Niloofar Farnoosh
entitled:
Three-Dimensional Modeling of Electrostatic Precipitator Using
Hybrid Finite Element – Flux Corrected Transport Technique
is accepted in partial fulfillment of the requirements for the degree of
Doctor of Philosophy
______________________ _______________________________
ABSTRACT
This thesis presents the results of a three-dimensional simulation of the entire precipitation process inside a single-electrode one-stage electrostatic precipitator (ESP). The model was designed to predict the motion of ions, gas and solid particles. The precipitator consists of two parallel grounded collecting plates with a corona electrode mounted at the center, parallel to the plates and excited with a high dc voltage. The complex mutual interaction between the three coexisting phenomena of electrostatic field, fluid dynamics and the particulate transport, which affect the ESP process, were taken into account in all the simulations.
investigated. In some cases, the simulation results were compared with the existing experimental data published in literature.
ACKNOWLEDGEMENTS
I am appreciably grateful to Prof. K. Adamiak, my co-advisor, for his endless support and academic guidance that helped me to achieve my research goals. I would also like to express my deepest appreciation to Prof G.S.P. Castle, my advisor, for his instructive advices and also his support and encouragement during this research. I could not have made it through my studies without their encouragement and guidance. I could not have asked for more from them and they will always be my advisors. I gratefully acknowledge Dr. J. S. Chang and P. Atten for their kind consultation and helpful comments; I wish to thank my other thesis committee members: Dr. C. Briens, Dr. W. D. Greason, Dr. G. Harvel and Dr. J. Sabarinathan. I also would like to acknowledge the Natural Sciences and Engineering Research Council of Canada (NSERC) for providing grants to this study and the Shared Hierarchical Academic Research Computing Network (SHARCNET: www.sharcnet.ca) and Compute/Calcul Canada for providing facilities to make this work possible. I would like to thank Mr. B. Saunders and Mr. T. Hunt for their help with the Linux operating system and the FLUENT software. I also want to thank my officemates N. Toljic and R. Hossain for their assistance and friendship who made my life enjoyable.
TABLE OF CONTENTS
CERTIFICATION OF EXAMINATION
iiABSTRACT
iiiACKNOWLEDGMENTS
vTABLE OF CONTENTS
viLIST OF FIGURES
xiLIST OF TABLES
xxNOMENCLATURE
xxiABBREVIATIONS
xxvi1. INTRODUCTION AND OBJECTIVES
11.1 Introduction 1
1.2 Research objectives 1
1.2.1 Developing a reliable numerical algorithm to evaluate the electrical
characteristics inside an ESP 1
1.2.2 Investigating 3-D EHD flow and its effect on ESP performance 2 1.2.3 Investigating particle concentration effect on ESP performance 3 1.2.4 Investigating the effect of discharge electrode geometry on EHD flow patterns
and ESP performance in removal of fine particles 3
1.2.5 Modeling a wire-cylinder ESP for collecting submicron diesel particulates 4
2. LITERATURE REVIEW
62.1 Numerical modeling of electric corona discharge in ESP 6
2.2 EHD secondary flow and its effect on precipitation performance - Numerical
modeling and experimental studies 6
2.3 Particle charging, motion and collection efficiency in ESPs - Numerical modeling
2.4 Submicron particle collection using ESPs – Numerical modeling and experimental
studies 13
2.5 Diesel particle collection using ESPs – Numerical modeling and experimental
studies 14
3. THEORETICAL FUNDAMENTALS AND MATHEMATICAL
MODEL OF AN ESPs
183.1 Introduction 18
3.2 Mathematical Model of a Single-Stage ESP 18
3.3 Theoretical Fundamentals 20
3.3.1 Corona discharge 20
3.3.2 Eulerian approach for the continuous phase (airflow) 21
3.3.2.1 Turbulent model 22
3.3.2.2 Standard k-ε turbulent model 24
3.3.2.3 Turbulence intensity 24
3.3.3 Lagrangian approach for the dispersed phase (particle) 25
3.3.3.1 Particle motion equations 25
3.3.3.2 Particle charging equations 28
3.3.3.3 Particle migration velocity 30
3.3.4 Boundary conditions 33
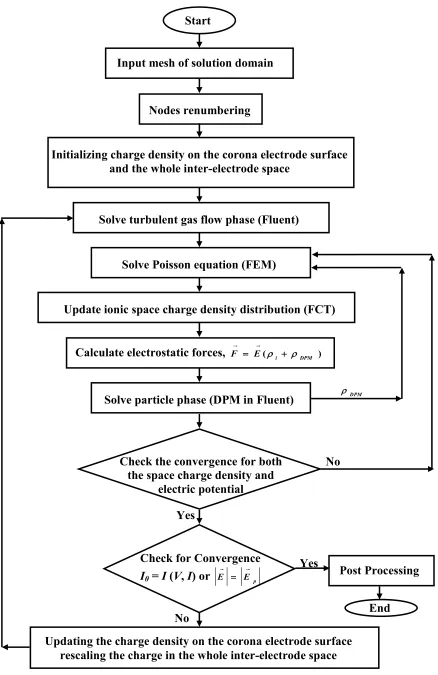
3.4 Iterative loops and calculation procedure 34
4. A SINGLE-STAGE WIRE-PLATE ESP MODELING
404.1 Introduction 40
4.2 Model description 40
4.3 Simulation results and discussions 41
4.3.1 Electrical characteristics 41
4.3.3 Particle charging, trajectories and deposition 44
4.3.4 EHD flow effect on ESP performance 52
4.3.5 Particle concentration effect on ESP performance 53
4.3.5.1 Air flow patterns and particle characteristics for c = 0.5c0 55
4.3.5.2 Air flow patterns and particle characteristics for c = 2c0 58
4.3.5.3 Air flow patterns and particle characteristics for c = 10c0 59
4.3.5.4 Air flow patterns and particle characteristics for c = 20c0 62
4.3.5.5 Comparing precipitation performance for different concentrations 64 4.3.5.6 Particle distribution at inlet and outlet for different concentrations 66 4.3.6 Particle concentration effect on corona discharge current 67
4.4 Summary 67
5. MODELING OF A SINGLE-STAGE SPIKE-PLATE ESP
695.1 Introduction 69
5.2 Model description 70
5.3 Numerical Algorithm 72
5.4 Simulation results and discussions 73
5.4.1 Electrical characteristics 73
5.4.2 3-D EHD flow patterns 76
5.4.2.1 Two-sided spiked electrode 76
5.4.2.2 One-sided spiked electrode 88
5.4.3 EHD flow effect on ESP performance 91
5.4.3.1 Two-sided spiked electrode 91
5.4.3.2 One-sided spiked electrode 94
5.4.4 Collection efficiency comparison for three spiked electrode geometries 97
5.4.6 Particle mass flow rate effect on collection efficiency 103
5.5 Summary 104
6.
COLLECTION OF ULTRAFINE DIESEL PARTICULATE
MATTER IN A CYLINDRICAL SINGLE-STAGE ESP
1066.1 Introduction 106
6.2 Model description 106
6.3 Simulation results and discussions 108
6.3.1 Electrical characteristics - analytical solution 110
6.3.1.1 Zero engine load and T= 110oC 110
6.3.1.2 High engine load and T = 210oC 111
6.3.2 3-D EHD flow patterns 112
6.3.3 Submicron particles charging, trajectories and deposition 113
6.3.3.1 Zero engine load and T = 110o C 114
6.3.3.2 High engine load and T = 210oC 117
6.3.4 Migration velocity and particle residence time 118
6.3.4.1 Zero engine load and T= 110o C 118
6.3.4.2 High engine load and T = 210o C 122
6.3.5 ESP performance on removal of submicron particles 124
6.3.5.1 Zero engine load and T = 110o C 124
6.3.5.2 High engine load and T= 210o C 127
6.3.5.3 Different channel lengths 128
6.4 Summary 130
7. SUMMARY and RECOMMENDATIONS FOR FUTURE STUDY
1317.1 Summary 131
REFERENCES
136LIST OF FIGURES
Figure 3.1. 3-D computational model of a wire-plate ESP. 19
Figure 3.2. Fields interactions inside ESPs. 19
Figure 3.3. Flow chart of simulation procedure 39
Figure 4.1. Distribution of equipotential lines in the symmetry plane of ESP (corona
wire voltage is +30 kV, voltage increment 1.2 kV). 41
Figure 4.2. Lines of equal space charge density in the symmetry plane of ESP (corona wire voltage equal to +30 kV, maximum space charge density 187.0 μC/m3,
increment 7.65 μC/m3). 42
Figure 4.3. Airflow streamlines originated in symmetry plane z = 0 for different
inlet velocities. 43
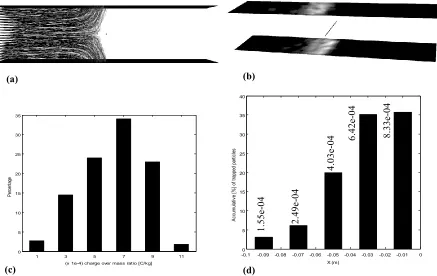
Figure 4.4. Results of numerical simulation for precipitation of 50 μm particles assuming the inlet velocity of 1.0 m/s (a) particle trajectories, (b) particle accumulation on collecting plates, (c) charge to mass ratio distribution of collected particles, (d) accumulative percentage of particles captured on the upper plane
along with average charge to mass ratio. 46
Figure 4.5. Results of numerical simulation for precipitation of 10 μm particles assuming the inlet velocity of 1.0 m/s (a) particle trajectories, (b) particle accumulation on collecting plates, (c) charge to mass ratio distribution of collected particles, (d) accumulative percentage of particles captured on the upper plane
along with average charge to mass ratio. 47
Figure 4.6. Results of numerical simulation for precipitation of 5 μm particles assuming the inlet velocity of 1.0 m/s (a) particle trajectories, (b) particle accumulation on collecting plates, (c) charge to mass ratio distribution of collected particles, (d) accumulative percentage of particles captured on the upper plane
along with average charge to mass ratio. 49
particles, (d) accumulative percentage of particles captured on the upper plane
along with average charge to mass ratio. 50
Figure 4.8. Results of numerical simulation for precipitation of 1 μm particles assuming the inlet velocity of 0.5 m/s (a) particle trajectories, (b) particle accumulation on collecting plates, (c) charge to mass ratio distribution of collected particles, (d) accumulative percentage of particles captured on the upper plane
along with average charge to mass ratio. 51
Figure 4.9. Particle trajectory for 1μm particles, inlet velocity 0.5 m/s (a) without
EHD flow (b) with EHD flow. 52
Figure 4.10. Lognormal particle size distribution. 54
Figure 4.11. Distribution of mass flow rate versus particle size at inlet. 54 Figure 4.12. Air velocity patterns in z = 0 symmetry plane of ESP (a) contours of
velocity magnitude, maximum velocity is 1.39 m/s close to the electrode and number of contours is 50 (b) flow streamlines (particle mass flow rate c = 0.5c0,
corona wire voltage +30 kV). 55
Figure 4.13. Particle trajectories for three particle sizes: (a) 1.4 μm, (b) 5 μm, (c) 10
μm (particle mass flow rate c = 0.5c0, corona wire voltage +30 kV). 56
Figure 4.14. Particle transport and deposition for the particle mass flow rate c = 0.5c0 and corona wire voltage +30 kV (a) particle concentration (b) deposition
pattern on the collection plates (c) collection performance and (d) charge to mass
ratio along the channel, for three particle sizes: 1.4, 5 and 10 μm. 57 Figure 4.15. Velocity contours in z = 0 symmetry plane (maximum velocity is 1.4
m/s close to the electrode, number of contours is 50, particle mass flow rate c = 2c0
and corona wire voltage +30 kV). 58
Figure 4.16. Particle transport and deposition for the particle mass flow rate c = 2c0,
corona wire voltage +30 kV and three particle sizes: 1.4, 5 and 10 μm (a) particle concentration (b) collection performance and (c) charge to mass ratio along the
channel. 59
Figure 4.17. Velocity contours for the particle mass flow rate c = 10c0 and corona
to the electrode, number of contours is 50) and (b) planes parallel to the corona wire
along the channel. 60
Figure 4.18. Flow streamlines beginning in z = 0 symmetry plane (particle mass
flow rate c=10c0, corona wire voltage +30 kV). 60
Figure 4.19. Particle trajectories for three particle sizes: (a) 1.4 μm, (b) 5 μm, (c) 10
μm (particle mass flow rate c = 10c0, corona wire voltage +30 kV). 61
Figure 4.20. Particle transport and deposition for the particle mass flow rate c = 10c0 and corona wire voltage +30 kV (a) particle concentration (b) deposition
pattern on the collection plates (c) collection performance and (d) charge to mass
ratio along the channel for three particle sizes: 1.4, 5 and 10 μm. 62 Figure 4.21. Velocity contours in z = 0 symmetry plane for three different stages of
the iteration process. The maximum velocity close to the electrode is (a) 1.8 m/s (b) 1.5 m/s and (c) 1.3 m/s and number of contours is 50 (particle mass flow rate c =
20c0, corona wire voltage +30 kV). 63
Figure 4.22. Airflow streamlines in z = 0 symmetry plane for three different stages of the iteration process. (particle mass flow rate c = 20c0, corona wire voltage +30
kV). 63
Figure 4.23. Particle concentrations in z = 0 symmetry plane for three different
stages of the iteration process. 64
Figure 4.24. Distribution of mass flow rate versus particle diameter (a) at inlet and outlet for the inlet particle mass flow rate of c=10c0 (b) at outlet for different inlet
particle mass flow rates (inlet velocity 1 m/s, corona wire voltage +30 kV). 66 Figure 4.25. Relative corona current versus relative particle concentration. 67 Figure 5.1. 3-D configuration of a single spike wire-plate model of ESP. 70 Figure 5.2. Schematic drawing of the discharge electrode with spikes on two sides
(top view). 71
Figure 5.3. Schematic drawing of the discharge electrode with spikes in the
upstream direction (top view). 71
Figure 5.4. Electric potential contours in z = 0 plane of ESP (number of contours
Figure 5.5. Ion charge density distribution contours in (a) y = 0 and (b) z = 0 planes (number of contours is 25, the maximum ion charge density on each spike is -485
μC/m3and the applied voltage is -30 kV). 74
Figure 5.6. Ion charge density distribution on the collecting plates (number of
contours 25 and maximum ion charge density -68.5 μC/m3). 74
Figure 5.7. Ion charge density distribution contours in the y = 0 plane for non-uniform discharge from spike surfaces (number of contours is 20, the maximum ion
charge density on each spike tip is -565 μC/m3and the applied voltage is -30 kV). 75 Figure 5.8. Contours of ion charge density distribution in the y = 0 plane for ESP
with spikes in the upstream direction (number of contours is 20, the maximum ion charge density on each spike tip is -532 μC/m3, applied voltage is -30 kV and inlet
velocity is 0.6 m/s). 76
Figure 5.9. Airflow streamlines in plane A for negative applied voltage of (a) -30 kV and discharge current 350 μA (b) 23.5 kV and discharge current 170 μA (c)
-19.2 kV and discharge current 90 μA. 78
Figure 5.10. Airflow streamlines in plane B for negative applied voltage of (a) -30 kV and discharge current 350 μA (b) 23.5 kV and discharge current 170 μA (c)
-19.2 kV and discharge current 90 μA. 80
Figure 5.11. Airflow streamlines in plane C and negative applied voltage of (a) -30 kV and discharge current 350 μA (b) 23.5 kV and discharge current 170 μA (c)
-19.2 kV and discharge current 90 μA. 81
Figure 5.12. Interaction of airflow streamlines in planes C and A for applied voltage
of -30 kV. 82
Figure 5.13. Equally spaced planes along the channel placed perpendicularly to
airflow direction. 83
Figure 5.14. Distribution of the longitudinal component of airflow velocity in
planes D-H for the applied voltage of -19.2 kV. 83
Figure 5.15. Distribution of the longitudinal component of airflow velocity in
planes D-H for applied voltage of -23.5 kV. 83
Figure 5.16. Distribution of the longitudinal component of airflow velocity in
Figure 5.17. Turbulence intensity contours in y = 0 plane for applied voltage of -19.2 kV (number of contours is 20, the maximum and minimum turbulence
intensities are 36% in vicinity of spiked electrode and 3% at the inlet) 84 Figure 5.18. Turbulence intensity contours in y = 0 plane for applied voltage of -30
kV (number of contours is 20, the maximum and minimum turbulence intensities
are 65% in vicinity of spiked electrode and 3% at the inlet) 85
Figure 5.19. (a) Uniform and (b) non uniform charge density distributions on the
spikes surfaces 86
Figure 5.20. EHD Flow streamlines when inlet velocity is zero and applied voltage
is -30 kV, assuming uniform ion charge density on spikes. 87
Figure 5.21. EHD Flow streamlines when inlet velocity is zero and applied voltage
is -30 kV, assuming non-uniform ion charge density on spikes. 88
Figure 5.22. Airflow streamlines in plane A for ESP with spikes in upstream
direction; applied voltage is -19.2 kV and inlet velocity is 0.6 m/s. 89 Figure 5.23. Airflow streamlines in plane A for ESP with spikes in upstream
direction; applied voltage is -30 kV and inlet velocity is 0.6 m/s. 89 Figure 5.24. Airflow streamlines in the plane A for ESP with spikes in downstream
direction (applied voltage is -19.2 kV and inlet velocity is 0.6 m/s). 90 Figure 5.25. Airflow streamlines in the plane A for ESP with spikes in downstream
direction (applied voltage is -30 kV and inlet velocity is 0.6 m/s). 90 Figure 5.26. Distribution of particle concentration versus particle diameter at inlet. 91 Figure 5.27. Collection efficiency of ESP with spikes on two sides versus particle
diameter for four negative applied voltages and inlet velocity of 0.6 m/s calculated
from the numerical model. 92
Figure 5.28. Numerical and experimental values of collection efficiency of ESP with spikes on two sides versus particle diameter for -19.2 kV and -30 kV applied
voltages and inlet velocity of 0.6 m/s. 93
Figure 5.29. Numerical and experimental values of collection efficiency of ESP with spike on two sides versus particle diameter for -23.5 kV and -27.5 kV applied
Figure 5.30. Numerical values of collection efficiency of the ESP with spikes pointed in the upstream direction versus particle diameter for four negative applied
voltages and inlet velocity of 0.6 m/s. 95
Figure 5.31. y component of the airflow velocity in ESP with spikes on upstream
direction in plane A (applied voltage is 30 kV and inlet velocity is 0.6 m/s). 95 Figure 5.32. Numerical values of collection efficiency of the ESP with spikes in the
downstream direction versus particle diameter for four negative applied voltages
and inlet velocity of 0.6 m/s. 96
Figure 5.33. y component of the airflow velocity vector in ESP with spikes in downstream direction in the plane A (applied voltage is -30 kV and inlet velocity is
0.6 m/s). 97
Figure 5.34. Collection efficiency versus particle diameter of ESP with spikes either in upstream or downstream direction for -19.2 kV and -30 kV applied voltages and
inlet velocity of 0.6 m/s. 97
Figure 5.35. Collection efficiency of ESP with spikes on two sides and one side directed either upstream or downstream for different negative applied voltages and particle sizes of (a) 0.25 μm, (b) 0.5 μm, (c) 0.75 μm and (d) 1.5 μm (inlet velocity
is 0.6 m/s). 98
Figure 5.36. Particle deposition rate along the channel for ESP with spikes on two sides and one side directed either upstream or downstream for particle sizes of (a) 0.25 μm, (b) 0.5 μm, (c) 0.75 μm, and (d) 1.5 μm (applied voltage is -19.2 kV and
inlet velocity is 0.6 m/s). 100
Figure 5.37. Charge-to-mass ratio of deposited particles along channel for ESP with spikes on two sides and one side directed either upstream or downstream for particle sizes of (a) 0.25 μm, (b) 0.5 μm, (c) 0.75 μm and (d) 1.5 μm (applied
voltage -19.2 kV and inlet velocity 0.6 m/s). 101
Figure 5.38. Particle deposition rate along the channel for ESP with spikes on two sides and one side directed either upstream or downstream for particle sizes of (a) 0.25 μm, (b) 0.5 μm, (c) 0.75 μm and (d) 1.5 μm (applied voltage -30 kV and inlet
Figure 5.39. Charge-to-mass ratio of deposited particles along the channel for ESP with spikes on two sides and one side directed either upstream or downstream for particle sizes of (a) 0.25 μm, (b) 0.5 μm, (c) 0.75 μm and (d) 1.5 μm (applied
voltage -30 kV and inlet velocity 0.6 m/s). 103
Figure 5.40. Particle collection efficiency versus particle diameter for ESP with spikes on two sides for the lowest (c=c*) and highest (c=20c*) particle mass flow
rates at inlet (applied voltage -30 kV and inlet velocity 0.6 m/s). 104 Figure 6.1. Schematic diagram of wire-cylinder ESP channel (a) cross section (b)
side view. 107
Figure 6.2. Number concentration versus exhaust particle diameter at inlet for (a) zero engine load and 110o C temperature (b) high engine load and 210o C
temperature 108
Figure 6.3. (a) Electric potential and (b) electric field strength distribution along the
radial direction (zero engine load at T = 110o C) 110
Figure 6.4. Charge density distribution along the radial direction for applied voltages of (a) -8 kV and -10 kV (b) -15 kV and -17 kV for the engine at zero load
and T = 110o C 110
Figure 6.5. Charge density distribution along the radial direction for applied voltages of (a) -8 kV and -10 kV (b) -15 kV and -17 kV for the engine at high load
and T = 210o C 112
Figure 6.6. EHD secondary flow streamlines for 1% offset of corona discharge
electrode from the center of the ESP channel (a) cross section view (b) side view. 113 Figure 6.7. Cunningham slip correction factor versus exhaust particle diameter (a)
zero engine load and T = 110o C (b) high engine load and T = 210o C 114 Figure 6.8. (a) Charge to mass ratio and (b) percentage of trapped particles along
the ESP channel for 30 nm particles under three inlet velocities (applied voltage is
-10 kV, channel length is -100 mm, and temperature is 1-10o C) 115
Figure 6.9. (a) Charge to mass ratio and (b) percentage of trapped particles along the ESP channel for 100 nm particles under three inlet velocities (applied voltage is
Figure 6.10. (a) Charge to mass ratio and (b) percentage of trapped particles along the ESP channel for 200 nm particles under three inlet velocities (applied voltage is
-10 kV, channel length is 100 mm, and temperature is 110oC) 116
Figure 6.11. (a) Charge to mass ratio and (b) percentage of trapped particles along the ESP channel for 500 nm particles under three inlet velocities (applied voltage is
-10 kV, channel length is 100 mm, and temperature is 110o C) 116
Figure 6.12. (a) Charge to mass ratio and (b) percentage of trapped particles along the ESP channel for 40 nm particles under three inlet velocities (applied voltage is
-10 kV, channel length is -100 mm, and temperature is 2-10o C) 117
Figure 6.13. (a) Charge to mass ratio and (b) percentage of trapped particles along the ESP channel for 100 nm particles three inlet velocities (applied voltage is -10
kV, channel length is 100 mm, and temperature is 210o C) 117
Figure 6.14. (a) Charge to mass ratio and (b) percentage of trapped particles along the ESP channel for 300 nm particles under three inlet velocities (applied voltage is
-10 kV, channel length is 100 mm, and temperature is 210o C) 118
Figure 6.15. (a) Charge to mass ratio and (b) percentage of trapped particles along the ESP channel for 500 nm particles under three inlet velocities (applied voltage is
-10 kV, channel length is 100 mm, and temperature is 210o C) 118
Figure 6.16. (a) Theoretical migration velocity calculated from Cochet particle charging model (b) particle migration velocity obtained from simulation for different applied voltages, channel length of 100 mm and inlet velocities of 0.6 m/s,
1 m/s and 1.5 m/s 121
Figure 6.17. Particle residence time of deposited particles versus exhaust particle diameter for three inlet velocities, channel length of 100 mm and different applied
voltages of (a) -8 kV, (b) -10 kV, (c) -15 kV and (d) -17 kV. 122
Figure 6.18. (a) Theoretical migration velocity calculated from Cochet particle charging model (b) particle migration velocity obtained from simulation for different applied voltages, channel length of 100 mm and inlet velocities of 0.6 m/s,
Figure 6.19. Particle residence time of deposited particles versus exhaust particle diameter for three inlet velocities, channel length of 100 mm and different applied
voltages of (a) -8 kV, (b) -10 kV, (c) -15 kV and (d) -17 kV. 124
Figure 6.20. Fractional efficiency of ESP for three inlet velocities, channel length of 100 mm and different applied voltages of (a) 8 kV, (b) 10 kV, (c) 15 kV and (d)
-17 kV. 125
Figure 6.21. Total mass collection efficiency versus exhaust gas residence time for
different applied voltages and 100 mm long ESP channel 126
Figure 6.22. Fractional efficiency of ESP for three inlet velocities at inlet, channel length of 100 mm and different applied voltages of (a) -8 kV, (b) -10 kV, (c) -15 kV
and (d) -17 kV. 127
Figure 6.23. Total mass collection efficiency versus exhaust gas residence time for
different applied voltages and 100 mm long ESP channel 128
Figure 6.24. (a) Particle residence time and (b) fractional efficiency versus exhaust particle diameter for four different length of the ESP channel (applied voltage is -10
kV, inlet velocity is 0.6 m/s and engine is at low load condition) 129 Figure 6.25. (a) Particle residence time and (b) fractional efficiency versus exhaust
particle diameter for four different length of the ESP channel (applied voltage is -10
LIST OF TABLES
Table 3.1. Boundary conditions for 3-D analysis of processes in ESP. 38 Table 4.1. Operating parameters of the ESP model and particle characteristics 44
Table 4.2. Results summary 52
Table 4.3. Comparison of particle collection efficiency for inlet velocity of 0.5 m/s 53
Table 4.4. ESP performance for different particle mass flow rates. 65
Table 5.1. Number of nodes and elements in discretization for three spiked electrode
geometries 72
Table 6.1. Number of nodes and elements from discretization for different channel lengths 108 Table 6.2. Electrical parameters of wire-cylinder ESP (engine load is zero and T = 110o C)
111 Table 6.3. Electrical parameters of wire-cylinder ESP (engine load is high and T = 210o C)
112 Table 6.4. Total mass collection efficiency of ESP (L = 100 mm and T = 110o C) 126 Table 6.5. Total mass collection efficiency (L = 100 mm and T= 210o C) 128 Table 6.6. Total mass collection efficiency for different channel length (inlet velocity is 0.6
NOMENCLATURE
Symbol Description Units
Ac Effective collecting area [m2]
Aface Area of cell face [m2]
a1, a2, a3 Model constants b1, b2, b3 Model constants
0
c , c* Particle mass flow rate reference value [kg/s]
C1ε, C2ε, Cμ Model constants
Cc Cunningham slip correction factor
CD Drag coefficient
D Ion diffusion coefficient [m2/s]
De Deutsch number
DAccumulation Increasing rate of particle accumulation depth [m/s]
p
d Particle diameter [m]
E Electric field [V/m]
p
E Peek’ corona onset field [V/m]
ps
E
Pseudo-homogeneous electric field strength [V/m]
CE
E Electric field vector near the collecting wall [V/m]
Ehd Electrohydrodynamic (EHD) number
e Electron charge ( 19
10 6 .
1 ) [C]
enorm Model constant
D
F Drag force coefficient [1/s]
s F
Viscosity force [N]
x F
External acceleration (force/unit particle mass) [m/s2]
g Gravitational acceleration [m/s2]
I Turbulence intensity
I0 Corona discharge current [A]
J Current density vector [A/m2]
K Mobility of ions at actual conditions [m2/V.s]
K0 Mobility of ions at atmospheric conditions [m2/V.s]
Kn Knudsen number
Kp Particle mean mobility [m2/V.s]
k Turbulence kinetic energy [J]
B
k Boltzmann’s coefficient (1.38066 1023 J/K) [J/K]
L Channel length [m]
p
m Particle mass flow rate [kg/s]
Min(dp) Total mass of each particle size at the inlet [kg]
Mout(dp) Total mass of each particle size at the inlet [kg]
Min Total masses of all particle sizes at the inlet [kg]
Mout Total masses of all particle sizes at the outlet [kg]
P
m Particle mass [kg]
P Actual pressure [Pa]
P0 Atmospheric pressure (1.013 10 5Pa) [Pa]
P
Q Particle charge [C]
s
Q Saturation charge [C]
on Accumulati
R Particle accumulation rate [kg/m2.s]
Re Reynolds number
RNE Distance between corona electrode and collecting surface [m]
0
r Radius of corona wire [m]
r1 Tube radius [m]
s Surface area of sphere [m2]
S Actual surface area of the particle [m2]
SMx Mass source term of x-momentum [kg]
SMy Mass source term of y-momentum [kg]
SMz Mass source terms of z-momentum [kg]
SCA Specific collection area [m2.s/m3]
T0 Atmospheric temperature (300 K) [K]
T Actual temperature [K]
t Time [s]
u0 Initial velocity of exhaust gas at inlet [m/s]
u Gas velocity vector [m/s]
P
u Particles velocity [m/s]
i
u Mean velocity component [m/s]
i
u Fluctuating velocity component [m/s]
U Mean velocity magnitude of the flow [m/s]
α Model constant
Model constant
Electric potential [V/m]
o
Electric potential on corona electrode [V/m]
ϕ Scalar
Turbulence dissipation rate [W]
0
Permittivity of vacuum/air [F/m]
r
Particle dielectric constant
i
Ionic space charge density [C/m3]
f
Gas density [kg/m3]
p
Particle density [kg/m3]
0
Ionic charge density on the corona electrode surface [C/m3]
DPM
Particle charge density [C/m3]
μ Airflow viscosity [kg/m.s]
μt Turbulent (or eddy) viscosity [kg/m.s]
σ Gas accommodation
σε, σk Model constants
Molecular mean free path at actual conditions [m]
0
Molecular mean free path at atmospheric conditions [m]
Shape factor
q
Charging time constant [s]
ηf Grade or fractional efficiency
ηt Total mass collection efficiency
ABBREVIATIONS
ac Alternating Current
BEM Boundary Element Method
CSM Charge Simulation Method
CFD Computational Fluid Dynamic
DBD Dielectric Discharge Barrier
DCM Donor Cell Method
dc Direct Current
DNS Direct Numerical Simulation
DOC Diesel Oxidation Catalyst
DPF Diesel Particulate Filter
DPM Discrete Phase Model
DRW Discrete Random Walk
EHD Electrohydrodynamic
ESP Electrostatic Precipitator
FCT Flux Corrected Transport
FDTD Finite Difference Time Domain
FEM Finite Element Method
FVM Finite Volume Method
LDV Laser Doppler Velocimetry
MoC Method of Characteristics
NPR Nonthermal Plasma Reactor
PIV Particle Image Velocimetry
Re Reynolds number
RMS Root Mean Square
SIMPLE Semi-Implicit Method for Pressure Linked Equations
SOF Soluble Organic Fraction
SOR Successive Over Relaxation
UDF User Defined Function
1.
INTRODUCTION AND OBJECTIVES
1.1 Introduction
Electrostatic precipitation (ESP) has been an important industrial technology since the early 1900s and can be regarded as the major air pollution control device in industrial applications such as purifying the flue gases from coal burning or cement production plants and diesel engine generators. In this device, the particles are charged by the ionic bombardment in the precipitator channel, transported towards the collecting plates by the electric forces and deposited on them. The electrostatic forces exerted on the ionic space charge by the electric field (Coulomb forces) induce the secondary electrohydrodynamic (EHD) flow, or the ionic wind, which increases the flow turbulence in the channel. The airflow drag forces and EHD flow also affect the particle trajectories, making them even more difficult to predict. Therefore, the complex coupled phenomena between the electric field, turbulent flow field, and particle charging and motion must be taken into account for the full analysis of ESPs [1,2].
Although most of the basic phenomena related to particle collection in an ESP are well understood, extensive numerical and experimental investigations are still being carried out on many detailed aspects of ESP, such as electrostatics fields, fluid dynamics, charging mechanism and particle dynamics.
1.2 Research objectives
1.2.1 Developing a reliable numerical algorithm to evaluate the electrical characteristics inside an ESP
For modeling the corona discharge in ESPs, many authors considered a quite simplistic model assuming uniform charge distribution along the smooth discharge electrode [7,8]. Although positive corona discharge creates a uniform sheath around the electrode, in the case of negative corona discharge discrete spots, called tufts, are generated along the electrode resulting in a non-uniform charge distribution [9,10].
In this phase of the project, a hybrid Finite Element (FEM)-Flux Corrected Transport (FCT) method was proposed to obtain electrical characteristics, including the distributions of the electric field, the electric potential and the ionic space charge density inside a one-stage single electrode ESP, assuming positive or negative corona discharge along the corona electrode. The Navier-Stokes equations for airflow were solved using the commercial FLUENT software, based on Finite Volume Method (FVM), with the aid of User-Defined-Functions (UDFs) to obtain the airflow patterns modified by EHD secondary flow produced by the corona discharge.
1.2.2 Investigating 3-D EHD flow and its effect on ESP performance
The secondary EHD flow is generated due to momentum transfer from moving charged species (ions and particles) to neutral gas molecules. The flow interaction between EHD secondary flow and primary flow is quite different for negative and positive corona leading to different patterns in flow structure [9-13]. In addition to the primary flow and electric field, the EHD flow pattern also depends on the particle properties such as particle size and concentration [7, 8, 14, 15]. Because of the complex stochastic nature of this flow, many contradictory conclusions on its influence on particle collection efficiency are reported in literature. Some researchers believe that the particle collection efficiency could be significantly improved if the EHD flows were eliminated [16]. In 2000, Soldati showed that the superposition of EHD flows onto the turbulent channel flow significantly modifies the turbulent structure in the wall region resulting in drag reduction, which changes the local behavior of particles to be collected by an ESP [17]. He also pointed out that EHD flow not only contributes to re-entrainment of particles to the central region of the channel, but also to sweeping the particles to the collecting walls, thus having negligible influence on the overall collection efficiency.
obtained for different corona discharge electrode configurations, assuming uniform corona discharge on smooth wire electrode or non-uniform corona discharge in spiked flat electrode. The effects of different electrode geometries, inlet velocities and excitation voltages on EHD flow patterns and consequently, particle trajectories and precipitation performance were also investigated.
1.2.3 Investigating particle concentration effect on ESP performance
Many authors used mathematical and experimental techniques to investigate the effect of various particle concentrations on EHD flow patterns, corona discharge current, particle trajectory and deposition in the ESP channel for different ESP configurations [18-20]. In 2009, Adamiak and Atten examined this effect on a single wire-plate ESP and demonstrated that the flow pattern is modified by the secondary EHD flow which strongly depends on the particle concentration [21].
In this phase of the project, the influence of various particle concentrations on precipitator performance was numerically evaluated for different corona electrode geometries in the ESP assuming mono-dispersed and poly-disperse particle distributions and the results were compared with the experimental data presented in [20]. It was shown that by increasing the particle concentration at the inlet, the corona discharge current is suppressed resulting in electrostatic force reduction on the particles, thus decreasing the precipitation performance.
1.2.4 Investigating the effect of discharge electrode geometry on EHD flow patterns and ESP performance in removal of fine particles
The particle mass collection efficiency of modern industrial wire-plate ESPs is of the order of 99%. However, due to changes in particle emission standards, improving the collection of sub-micron to micron diameter particles is still necessary and is a challenging problem.
and numerical simulations of this process begin to dominate. Among numerous papers on ESP, only some deal with using 3-D computational methods for modeling the electrostatic process with real geometry of discharge electrodes.
Discharge electrode design has also been a prominent factor in submicron particle removal. The rigid type discharge electrodes with spikes parallel to the collecting electrodes have been investigated by few authors. In [24], D. Brocilo et al. estimated the electric field and ion density distribution in a spike electrode precipitator and investigated the effect of smooth and spiked electrode geometry on removal of submicron particles. J. Podlinski et al. [25,26] have shown that in a spiked electrode geometry, the negative corona discharge is more efficient than positive corona discharge for collecting submicron particles by injecting higher amount of ionic charges to the channel.
In this phase of the project, ESPs with different corona discharge electrode geometries were simulated including smooth wire and spiked flat electrodes with spikes alternatively located on both sides of the electrode or located only on one side of the electrode either on upstream or downstream direction of the channel. The effect of discharge electrode geometry on EHD flow patterns and precipitation performance was evaluated and in some cases the results were compared with the existing experimental data. It was shown that the discharge electrode with spikes on two sides is more effective for collecting submicron particles in the range of 0.25-1.5 μm.
1.2.5 Modeling a wire-cylinder ESP for collecting submicron diesel particulates
A search for an effective control of diesel particulate emissions has been a topic of interest for decades. Several techniques have been proposed for reducing diesel exhaust emissions, namely engine modification, fuel additives, alternative fuels, and after-treatment systems. Nevertheless, the first three techniques cannot effectively reduce diesel particulate emissions down to a level in compliance with standards being increasingly stringent. The after-treatment systems are of particular interest because they can achieve satisfactory removal efficiency of the diesel pollutants. Currently, the after-treatment technologies are restricted to diesel oxidation catalysts (DOCs), diesel particulate filters (DPFs), and nonthermal plasma reactors (NPRs), such as ESPs and dielectric discharge barriers (DBDs).
In this phase of the project, a laboratory scale wire-tube ESP used in Fuji Heavy Industries Ltd. was simulated and the precipitation performance for the effective control of diesel emissions was evaluated. The ESP has been subjected to the following investigations:
Development of the particle collection model for a more effective prediction of the ESP collection efficiency as a function of particle size,
Effects of engine loads and gas residence time on collection efficiency of ESP,
Different channel length effect on precipitation performance,
Different excitation voltage and inlet velocity effect on particle migration velocity,
2.
LITERATURE REVIEW
2.1 Numerical modeling of electric corona discharge in ESP
During the last several decades, many efforts have been made to achieve a better understanding of all important phenomena involved in the precipitation process, and many numerical techniques have been proposed in the literature for solving the governing equations. Some authors focused their studies on two-dimensional analysis of electrical conditions only, considering the electrical forces as a primary mechanism affecting the particle trajectories [14, 15]. Various numerical techniques have been used: FEM-Method of Characteristics (MoC) [3, 6], FEM-Boundary Element (BEM)-MoC [8], FEM-Charge Simulation (CSM) [4], FEM-Donor Cell (DCM) [27] and Finite Difference (FDM)-MoC [28]. These methodologies were applied to obtain the electric field and charge density distributions, and V-I characteristics of corona discharge in a 2-D ESP model. Only a few authors focused on 3-D analysis of corona discharge in ESPs [9,10,29,30]. In most cases the results were compared with the related experimental data from the literature. However, memory requirements, computation speed and accuracy of the results were quite different for each numerical technique. Moreover, the so-called single species corona model was commonly accepted, where the ionization reactions and ionization layer were neglected and steady flow of a single dominant ion was assumed. While this substantially simplified calculations, it required additional information about the amount of generated ions. The most common approaches relied either on the experimental value of the total corona current, or on the semi-empirical Peek’s law.
2.2 EHD secondary flow and its effect on precipitation performance - Numerical modeling and experimental studies
numbers in a wire-plate ESP considering the laminar air flow model [8]. They identified at least eight different flow patterns possible for different external flow and wire voltage levels. Similar studies were also performed to obtain EHD flow patterns in multi-wire ESPs. Kallio and Stock [14] implemented a 2-D FEM-FDM algorithm for modeling a multi-wire ESP to obtain EHD flow patterns assuming the k-ε turbulent flow model. The numerical results were verified experimentally using Laser Doppler Velocimetry (LDV). In 2002, a 2-D FEM-FVM numerical method along with a perturbation analysis of 2-D Euler equations was performed by Schmid et al. for modeling a multi corona wire ESP model [15]. The influence of different flow models: turbulent (k-ε and Reynolds stress-model) and non-turbulent (Euler and laminar) were investigated. A detailed review of important mechanisms leading to formation of the secondary flows was also demonstrated.
Due to deficiencies of the 2-D approaches in the accurate modeling of a finite length corona wire and 3-D characteristics of the EHD flow patterns, some authors tried to develop 3-D computational algorithms for modeling the ESP problems, considering different corona electrode configurations. In 1996 Davidson et al. [29] applied a 3-D FEM-MoC technique to obtain electrical conditions inside an ESP, including current density distribution and electric fields in point-to-plane and barbed plate-to–plane ESP. A reasonably exact model for computing the charge distribution on the corona electrode surface was assumed and it was based on Peek’s formula. Although these numerical results had a good accuracy, the authors never tried to investigate the EHD flow pattern generated in the same configuration.
are conventionally designed to predetermine the location of tufts and to achieve steady equally spaced corona tufts. The gas flow, electrical conditions and particle transport become essentially 3-D in these configurations.
The numerical study of Yamamoto and his co-workers related to multiple-tuft wire discharges indicated that each tuft point creates a pair of donut shaped rings of airflow [9], which are more organized in a laminar flow than in a turbulent one [10]. They also pointed out that a transition from the well organized spiral motion to the complete mixing regime depends on the tuft and wire-to-plate spacing. The tuft-corona discharge also substantially increases the turbulence level. It was shown [9] that by increasing the applied voltage the number of tufts along the wire increases, they become more stable and more uniformly distributed. In [10], a 3-D FDM numerical technique (SIMPLEST algorithm) was used for modeling a multi-wire ESP. In this model, point corona electrodes were assumed to take into account the effect of negative corona discharge, which forms tufts. Using a simplistic corona model, 3-D EHD flow and electric patterns (distribution of airflow and electrostatic parameters) were obtained for both turbulent and laminar flow models. They also implemented finite difference approximation using the successive-over-relaxation (SOR) method for modeling spike electrodes in a multi-wire industrial ESP configuration to obtain 3-D EHD flow patterns considering the turbulent flow model [30]. In their model the spikes were alternatively located along the corona wire and pointed towards the ground planes. They reported a zig-zag motion generated in the direction of the main flow, which changed to spiral rings for the higher applied voltages. According to these simulations, the secondary flow distribution without the external gas flow consists of a pair of long-elliptic and circulatory cells between spiked points along the wire, which changes to a pair of long-elliptic spiral flows in the direction of the gas flow between ground planes after adding the primary flow into the model. An experimental set-up was previously employed by the same authors in [18] for demonstrating particle trajectories and investigating the effect of particle concentration on the V-I characteristic curve in a spiked electrode discharge electrode and convex-concave-type collecting electrode.
32- 37]. In [38], Larsen and Christensen examined the EHD flow pattern in a small scale barbed-wire precipitator using LDV measurements. According to these results, each discharge point along the corona wire creates a pair of highly structured recirculation vortices and the barb spacing determines the EHD flow structure. Davidson and McKinney [39] used hot-film anemometry measurements to characterize the EHD flow in a barbed plate-to-plate precipitator. They proposed the barbed plate electrode as a useful design which effectively reduces the scale of corona induced EHD flow and thus decreases particle mixing. However, greater turbulence was generated in this precipitator than in a conventional wire-plate precipitator. More recently, 3-D PIV measurements were carried out by Mizeraczyk et al. to study the EHD flow patterns and particle trajectories in various ESP configurations assuming different channel widths [40], corona electrode orientations [41] and smooth plate or flocking plane collecting electrodes (two stainless-steel plane meshes covered with nylon flocks) with the corona wire electrode located along the gas flow, where the lower flow velocity near the flocking plane electrodes prevented the re-entrainment of the deposited particles and increased the collection efficiency of fine particles up to 94% [42]. In [25], they investigated the secondary EHD flow and particle collection efficiency for submicron dust particles (0.25-1.5 μm) in a spike-plate ESP under negative and positive dc voltage using 3-D PIV measurements. Their experimental results demonstrated a complex turbulent flow with a structure depending on the applied voltage level and the position of measuring plane with respect to the spike tips. They concluded that the flow in the spike-plate ESP has a strong 3-D variation. Velocity measurements showed that the turbulence intensity, generated when a negative voltage is applied to the corona wire, is higher than for the case of positive voltage. However, no comprehensive investigations for EHD secondary flow field in ESPs with spike discharge electrode could be found in literature.
2.3 Particle charging, motion and collection efficiency in ESPs - Numerical modeling and experimental studies
One of the main concerns in numerical modeling is also how to model the particle charging process. A. Mizuno [43] confirmed that for particles greater than 2 μm field charging is dominant and for particles less than 0.2 μm diffusion charging becomes more important. In[44], H. Lei et al. proved that the movement of particles with sizes in the range of 0.5 to 5 m are very sensitive to the gas turbulence and both diffusion and field charging, which makes the particle trajectory and charging much more complicated. Recently, Z. Long and Q. Yao compared the accuracy and computational time for various particle charging models including field charging, diffusion charging and combined field-diffusion theories [45]. They evaluated the accuracy of nine particle charging models based on the existing experimental results in the same condition and concluded that the Lawless field-diffusion combined model [46] is the best choice for numerical modeling of particle dynamics in ESPs.
Eulerian and Lagrangian, showing that the Lagrangian approach is superior, and confirmed the significant turbulence effect on the electric field. In their study, particle trajectories and collection efficiency were computed in a multi–wire ESP using 2-D commercial fluid dynamics software considering a turbulent flow model. Effects of particle diameter, inlet velocity and applied voltage on particle collection efficiency were investigated. Goo and Lee applied the Lagrangian particle tracking method coupled with the 2-D Monte-Carlo method for simulating particle motion in turbulent flow fields [51]. Afterwards, Lei et al. used the same technique to simulate particle charging and motion in a 3-D multi-wire ESP model. Turbulent particle charging and tracing for a range of particle diameters were computed using a Lagrangian approach. As a result, 2-D EHD flow patterns were demonstrated for the turbulent flow model. The variation of different forces acting on particles of different sizes along their trajectories was investigated in detail as well, concluding that the electric field and drag forces are the key forces in ESP. The authors pointed out that the 3-D numerical simulation is necessary not only to investigate the EHD flow, but also to evaluate different types of forces on the particle’s movement.
Some authors used different experimental techniques to demonstrate particle motion and deposition in ESPs. Mizeraczyk and his collaborators used 2-D PIV measurements to investigate the effect of various dust concentrations on EHD flow patterns for a laminar flow model in a multi–wire ESP[20]. The results of 3-D PIV measurements of EHD flow patterns in a narrow wire-duct ESP for two wire positions: longitudinal and transverse-to-flow were investigated. The particle collection efficiency for a range of particle diameters, and negative and positive applied voltages in ESP with spike-type electrode were also presented by the same authors in [25, 41]. According to their visualizations, the flow patterns in both ESPs (with longitudinal or transverse wire electrode) are very complicated and the particle trajectories in the narrow ESP exhibit a strongly 3-D character due to the narrow cross section of the ESP duct. These experimental results also confirmed the very well known fact that decreasing the particle diameter and applied voltage results in decreasing particle collection efficiency.
wire-plate precipitator for collecting poly-dispersed particles. The continuous evolution of particle size distribution along the precipitator and its effect on the ESP performance were quantitatively determined. The model performance was validated by comparing its predictions with the existing experimental data in literature [52]. Kim and Lee designed and built a laboratory-scale eight wire single-stage ESP operating in a wind tunnel for simulating poly-dispersed aerosols [53]. They pointed out that the size distribution of most poly-dispersed aerosols is very close to the lognormal distribution. Later, the same authors developed a modified moment-lognormal model to predict the continuous change of particle size distribution for considering the flow convection, electrostatic force and particle diffusion process in a wire-plate ESP [54]. Their proposed model could predict both the overall mass and number efficiencies of poly-dispersed particles without computing the fractional efficiency of each size regime. The effects of lognormal particle size distribution parameters such as the geometric mean particle radius and standard deviation on the ESP performance were examined and quantitatively determined.
Recently, poly-dispersed particle transport in ESP has also been studied experimentally. In [55], Nobregal et al. evaluated the performance of a wire-plate ESP in the removal of particles with a wide range of diameters and investigated the effect of channel width on precipitator performance. Improvement in particle removal for wider precipitators, but also larger energy consumption, has been shown. In [56], Ivancsy and Suda considered a special case of poly-dispersed dust load particles, with the same diameter and different relative permittivities. Mizeraczyk and his collaborators carried out PIV measurements to obtain the dust-particle flow velocity patterns for various densities of submicron dust, in which the particle size distribution had a maximum at a particle diameter of 0.4 µm [20]. According to their results, increasing the dust density not only significantly modifies the mean flow pattern (which is the effect of EHD secondary flow), but also increases the flow turbulence in the downstream ESP region and decreases the average discharge current.
a specific mass flow rate and stay in the region closer to the discharge wires for a longer time than larger particles. A few articles were reported in the literature, in which the strong coupling between the motion of ions, gas, particles and particle space charge density effect on corona discharge were considered [19,21]. In 2009, Adamiak and Atten implemented a 2-D FEM-MoC numerical method along with FLUENT software to simulate the gas flow and particle trajectories of submicron particles in a single-wire ESP [21]. The effect of particle concentration on gas flow streamlines, particle distribution pattern and current-voltage characteristics was also investigated. A full coupling between electric field, space charge and flow fields was assumed in their study and both corona discharge and particles charge influence on generating the secondary EHD flow were taken into account. They concluded that the flow pattern is modified by the secondary EHD flow, which strongly depends on the particle concentration.
2.4 Submicron particle collection using ESPs – Numerical modeling and experimental studies
ESPs are widely employed as particulate control devices for collecting fly ash emissions in different industrial processes, in which the overall mass based collection efficiencies should exceed 99%. However, for very small particles the collection efficiency of conventional ESPs is as low as 70%-80% due to the decreasing charge carried by particles of smaller size.
time and space improves the submicron collection efficiency. In 2010, J. Zhu et al. developed a bipolar pre-charger to the inlet duct of an ESP, which effectively induced particle agglomeration and improved the collection efficiency to 95%-98% for all particle sizes [62]. In [63], J.-H. Kim et al. used a water electrospray prior to the ESP to produce charged fine droplets for improving particle charging and agglomeration. Using bag filters [64], a cyclone [65] or scrubber technology [66] are other techniques used to improve the submicron collection efficiency. Some others suggested smooth or spiked electrode geometries in narrow ESP channel. A. Niewulis at al. in [41,67,68] analyzed the EHD flow pattern in a narrow wire-plate ESP with either longitudinal or transverse wire electrode and evaluated the collection efficiency of submicron particles in the range of 0.25-1.5 μm ,where approximately 99% of them were of diameter below 1 μm, using 3-D PIV measurements. They proved the complex and 3-D character of particle flow in both cases. Contrary to the case of ESP with transverse wire electrode, they showed that in ESP with longitudinal wire electrode the spiral vortices generated along and across the ESP duct spread out along the channel and don’t block the main flow resulting in lower pressure drop and smoother flow in the duct. In [68], authors proved that the ESP with longitudinal wire electrode energized with negative voltage has higher collection efficiency in removal of submicron particles due to higher discharge current and also proposed flocking plate electrodes to reduce re-entrainment of the fine particles deposited on the collecting plates. They also carried out some investigations to study the EHD flow field generated by different configurations of the electrode using PIV. In [25,26], they set up an experiment for the spike-plate type ESPs and investigated the secondary flow patterns effect on particle collection efficiency for submicron particles.
2.5 Diesel particle collection using ESPs – Numerical modeling and experimental studies
Optimization of the engine combustion process using alternative fuels or special fuel additives and installing after-treatment systems, such as catalytic converters, wet scrubbers, cyclones, bag filters, DPFs and ESPs are among the conventional methods utilized during the past to reduce diesel particulate emissions. Although DPF has high removal efficiency, it still has many problems such as high pressure drop, high energy consumption and maintenance costs, durability and insufficient collection efficiency for nano-particles. On the other hand, ESPs are widely applied to control particulates in industrial applications proven to be more cost effective and capable of trapping nano-particles agglomerated to larger particles. Higher collection efficiency, lower pressure drop, low energy consumption and operating over a wide range of gas temperature have made ESPs reliable particulate control devices.
ESPs have been used by many authors to control diesel exhaust emissions [69-71]. Several authors have also worked on the electrostatic agglomeration of aerosols emitted by diesel engines [72-74] by moving their size distribution towards larger diameters (several micrometres at least).
of DPF only. In addition, they confirmed that the increase in the pressure drop of the DPF is smaller due to agglomeration.
Wire-tube ESPs, where a thin wire is placed in the center of the tube and held at high voltage are proposed by some authors to capture ultra fine particles and diesel particulates [77-81]. Saiyasitpanich et al. [70,71] performed experiments to examine the performance of a tubular single-stage wet electrostatic precipitator (wESP) in the removal of diesel particulate matter. In wESP, the charged particles are collected on the wet collecting surfaces continuously irrigated with a water-film layer. This method is very advantageous in collecting ultrafine particles comparing with dry ESPs avoiding particle re-entrainment to the system and causes particle growth and agglomeration by cooling the system [82]. Moderate energy consumption, low maintenance requirements, simplicity in operation, no back pressure, and no interference with diesel engine operations are mentioned as some advantages offered by wESP. They evaluated the ESP performance for different operational control parameters including applied voltage, gas residence time, engine load, etc. Their results proved that the total diesel particulate number concentrations in the untreated diesel exhaust are in the order of ~ 108/cm3 at all engine loads with mean particle sizes in the range of 20 and 40 nm. They showed that the precipitator performance degrades from 86% at 0 kW engine load to 67% at 75 kW engine load principally due to a decrease in gas residence time and an increase in particle concentration. The ESP performance at 75 kW engine load was increased up to 96% by creating a four times increase of the gas residence time in the channel. It was also proved that by increasing the corona power, the removal efficiency of particles was increased. In addition, they found that the ESP collection efficiency versus particle size have a minimum between 20-50 nm, but at optimal wESP operating conditions it is possible to remove 90% of the all particle sizes. The measured collection efficiencies were significantly higher than the predicted values based on the well-known Deutsch equation [83].
3.
THEORETICAL FUNDAMENTALS AND MATHEMATICAL
MODEL OF AN ESPs
3.1 Introduction
In order to investigate the fundamental phenomena affecting the ESP process, a basic configuration of the single-stage ESP with two grounded, parallel and flat electrodes, used as collection plates, and a cylindrical high-voltage wire, suspended in the mid-plane of the duct, is often considered. In this model, the particles are electrically charged in the non-uniform ionized electric field, move in combined electro- and hydrodynamic fields and are separated from the gas under the influence of electrostatic forces. Accurate evaluation of fluid mechanics and particle transport parameters, including EHD flow interaction with the turbulent flow field and turbulent particle transport, is necessary to optimize precipitator operation.
The detailed 3-D hybrid FEM-FCT numerical approach, implemented throughout the entire thesis, is explained for modeling the steady state corona discharge to obtain electrical characteristics inside a simple parallel plate channel containing a single corona wire. The whole simulation procedure and algorithm to accurately predict the electrostatic field, EHD flow, particle charging and turbulent motion, and their mutual interaction in a single wire-plate ESP model is discussed. The developed model is useful to gain insight into the particle collection phenomena that take place inside an ESP.
3.2 Mathematical Model of a Single-Stage ESP
Figure 3.1. 3-D computational model of a wire-plate ESP.
The phenomena occurring during the precipitation process are extremely complex, mainly due to three fields being present at the same time: fluid flow, electrostatic and particle motion. The three existing fields and their mutual coupling are shown in Figure 3.2 [14]. The solid and dashed lines represent the strong and weak coupling between the two fields respectively. The computational model of the ESP should include the corona discharge, the gas flow and particle charging and transport. By applying a sufficiently high voltage to the corona wire, having a small radius of curvature, and keeping the collecting plates at a ground potential, a uniform corona takes place along the wire and the ions drift towards the collecting plates. These ions adhere to particles entrained with the airflow through the channel. As a result of electrostatic and air drag forces on the particles, they move towards the collecting plates and are deposited on them.
Figure 3.2. Fields interactions inside ESPs. Wire Electrode Airflow
100 mm
Collecting Plates
100 mm 500 mm
x