Background
Observer performance measurement is not well understood by the wider audience
in medical imaging. The overview presented here should give readers a good base
knowledge of observer performance and visual assessment of images, before going
into a more detailed investigation of the receiver operating characteristic (ROC) and
location sensitive methods of analysis. Particular emphasis will be placed on the
value of the free-response method to medical imaging.
Introduction
Observer performance has been monitored in radiology using ROC methods since
the 1960’s, where the intended outcome has been to establish the combined
diagnostic performance of system and observer. The development of ROC originates
from signal detection theory (SDT), where the Rose Model was initially used to
evaluate human vision.1 In radiology the Rose Model was used to measure the
performance of imaging systems, using an absolute scale of quantum efficiency (the
quantity of photons used by the imaging system).2 These techniques were often
employed using a contrast detail phantom that provides a simple signal known
exactly (SKE) / background known exactly (BKE) test.1 However, this type of
evaluation is quite limited in scope. The decision making process is highly subjective,
and all that is required of the observer is a simple binary decision: either the signal is
present or absent, where the variable quantity is image noise. The nature of the task
detectability can be made. Furthermore, it is known that observers are inefficient in
SKE studies when noise is added.3
Noise is an important factor affecting image interpretation, leading to the loss of fine
detail and thus a reduction in the spatial frequency components in the image.3 All
imaging systems contain some form of noise, and it is natural to assume that this
impairs our ability to successfully interpret medical images. However, this is not
always true, as demonstrated by a study of lumbar spine radiography, where the
detection of lesions was found to be independent of spatial resolution and noise.4
We can take from this that the influence of noise on image interpretation is not so
easy to predict, and perhaps it is not possible to adequately quantify the influence of
noise using a binary decision making process.
The ROC method was built on the limitations of a purely binary decision, requiring a
visual search and a statement of confidence, on the basis of the observer’s decision
threshold. Whilst all ROC studies require a certain level of visual search, they do not
take the location of an abnormality into account. Consequently, this paradigm has
limited value and effectiveness in some observer tasks and methods that required
the precise localisation of suspected abnormalities have been developed to
overcome this problem. The latest and most statistically robust evolution in observer
performance, the free-response paradigm (see Location Based Analysis), will be
explored as the optimal method for observer studies that require accurate
localisation.
The interpretation of medical images relies upon perception, cognition, human
factors, technology and innate talent; beyond this the interpretation process can be
split into three phases: seeing, recognizing and interpreting.5 Despite the processes
used in interpreting medical images, errors are still made. Take the visual search of
images as the example. Visual acuity is best at the fovea and can be reduced by up to
75% at only 5° from the centre of the fovea. Consequently, a visual search is required
to adequately and effectively interpret an image. However, the visual search is
variable among observers and eye-tracking technology has revealed that search
patterns are non-uniform and unique to individuals.5 Eye tracking can be a
particularly useful addition to ROC studies since it helps the researcher decide
whether a lesion has been fixated and allows categorisation of errors into those that
are due to faulty search and those that are due to faulty recognition or decision. If a
suspicious area is fixated, the observer’s decision threshold is responsible for calling
a suspicious area a true lesion or not.
Errors of decision threshold fall into two categories: false negative (FN) and false
positive (FP). FP results can occur because of misinterpretation (lesion mimics or
overlying structure). The reasons for FN results are less clear, particularly in cases
where a ‘second look’ finds the abnormality. In perception theory, false negatives
are divided into three categories; (1) search error (no fixation), (2) recognition error
(fixation time inadequate), and (3) decision error (adequate fixation but actively
dismisses or fails to recognize the abnormality).5
Cognition may explain some of the above, as vision is inconsistent and we do not
experience and successful interpretation of an image relies upon understanding the
clinical significance of a lesion, in addition to the identification of it.6
Perceptual methods and observer performance are closely linked, highlighting the
importance of a reliable method to quantify diagnostic accuracy.
Receiver Operating Characteristic (ROC) Analysis
ROC methods are used to assess the diagnostic accuracy of imaging techniques when
the observer is considered an integral part of the system.7 The focus is on the correct
classification of two distinct classes: normal and abnormal, with ROC methods being
particularly useful in the validation of new imaging procedures on patients where the
true status is known.8 A gold standard must classify the truth (normal/abnormal) in
each case for ROC analysis to be performed; if the truth is unknown then it is not
possible to classify performance8 and other methods, such as measures of
agreement, may be preferred. However, observer agreement cannot always be truly
reliable and indeed may only show that observers are agreeing to be wrong. Cohen’s
Kappa is a well-established statistic for measuring observer agreement, but if
observers agree when making the wrong decision then we are no nearer to attaining
a correct descriptor of performance.9 However, consistent false agreement may raise
questions about the performance of either the imaging system and/or the observers.
In all aspects of radiology an accurate result is required, never more so than in
cancer screening. In mammography the practitioner interpreting the images must
decide if an abnormality is present. There are of course four possible outcomes: true
the practitioner may not know it at the time of issuing a report, the true status of the
patient can only be determined by a gold-standard, which in this instance is the
histological report gained from a biopsy. Over a series of cases the histology results
can be compared to these binary results (TP, TN, FP and FN) to calculate descriptors
of performance such as sensitivity, specificity and accuracy. However, it is well
reported that such measures can be unreliable and in some cases misleading, where
the prevalence of abnormalities can also be influential. Therefore, an alternative is
required. In mammography a solution has been found in the Breast
Imaging-Reporting and Data System (BI-RADS) scale, enabling standardization of reports. This
requires the observer to use a decision threshold to state whether the image
contains an abnormality or not.
Traditional measures of test accuracy are defined by a simple binary
(normal/abnormal) decision with a single decision threshold. This can be acceptable
for cases that are easily classified as normal or abnormal. However, these ‘easy’
cases do not usually cause any problems in medical imaging; it is the difficult cases
that require greater attention, where the boundaries between error and acceptable
variation in reporting can be less clear.9 This is where specialist scales such as the
BI-RADS classification system used in mammography, or those used in ROC studies,
come into their own, allowing a rating to be assigned to each decision made.
However, it is important to note that although the BI-RADS scale is useful clinically, it
should not be used to estimate ROC curves.10 In typical ROC studies a confidence
scale is used, where each point on the scale represents a different threshold value of
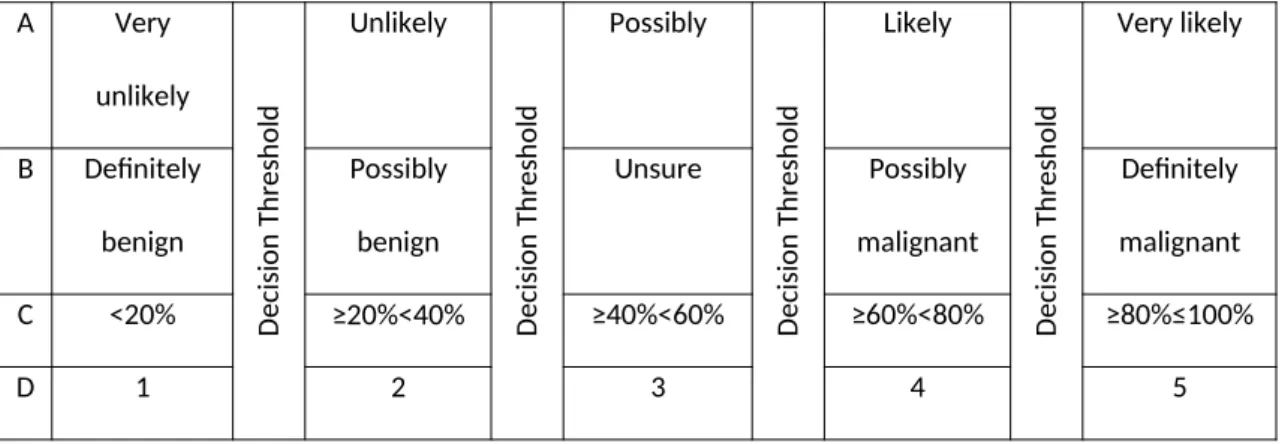
sensitivity and specificity.11 The types of rating scales used allow a measure of
and the decision threshold, Table 1. Rating scales can be ordinal or continuous (i.e.
1-100), but must be appropriate to the interpretation task.
The ROC Curve, Area Under the Curve (AUC) and Partial Area
(
p
AUC)
The ROC curves produced as a result of the analysis displays the relationship
between sensitivity and specificity for a full range of decision thresholds, Fig. 1. For
statistical evaluation of two different tests or observers, it is common to summarise
the data using the area under the curve (AUC) index. The AUC is defined as the
probability that a randomly selected abnormal case has a test result more indicative
of abnormality than that of a randomly chosen normal case.12 Since the AUC
summarises the full ROC curve, the implication is that all decision thresholds are
equally important. This may not be the case in all clinical scenarios; if overlooking a
lesion can have a serious impact on patient care then a test with high sensitivity is
required. Consider then, the partial AUC (pAUC), which can focus on the high
sensitivity or high specificity portions of the ROC Curve. The example shown in Fig. 2
illustrates the importance of analysing a small portion of the ROC curve. This
fictitious data considers two presentation states for displaying a chest X-ray (CXR),
normal and grey-scale inverted, and the relative lesion detection rates provided by
each. The diagnostic performances is summarised by similar AUCs; 0.820 for normal
display and 0.810 for grey-scale inverted display. Despite statistical similarity, Fig. 2
sensitivity portion of the curve is larger for grey-scale inverted images than it is for
normal display.
Assessment of pAUC is especially useful for the assessment of ROC curves that
intersect, since the full AUC may distract the researcher from the fact that one test
performs better for one part of the scale whereas the other performs better for the
remainder.13 This is illustrated by the example above; but some caution must be
applied here since the high level of sensitivity is achieved at the expense of a
reduced specificity on parts of the curve. When performing an ROC study, and
deciding how to analyse the data, one must always be mindful of the clinical
significance of the findings in addition to the statistical evaluation.
Location Based Analyses: Striving for Statistical Power
Traditional ROC analysis is limited, in that it does not take advantage of all the
available information in an image.14 ROC methods do not take into account location
information and thus lose some statistical power. However, it is not just statistical
power that is compromised; decision errors can also go unnoticed. Consider a CXR
containing a single lesion. If the lesion is correctly identified it is considered a TP
result. When location information is ignored, an observer could identify a lesion
mimic (FP) in a different anatomical location, overlook the true lesion but still return
a TP result for that case, since the location of abnormality is ignored in ROC. In
addition, ROC also fails to deal with multiple lesions effectively, since the image is
treated as a whole. It is easy to see from this that ROC methods are excellent for
As a consequence of these shortcomings, location based methods of analysis have
been developed. The most statistically robust method, allowing multiple lesions per
image and theoretically unlimited number of decision sites is the free-response
receiver operating characteristic (FROC) method.
Free-response Receiver Operating Characteristic (FROC)
Analysis
The FROC paradigm represents the observer performance method that is closest to
the clinical reality of image interpretation. Images are viewed globally and the
observer searches for all suspicious areas on the image. If the observer’s decision
threshold dictates that they believe a lesion to be present they create a mark-rating
pair; a localisation and confidence score.15 Conversely, if an observer believes the
entire image to be normal then no mark-rating pairs are made. If this data could be
correlated with eye-tracking movements and dwell times it may be possible to
determine whether false negative errors made by the observer were search errors
(not seeing the lesion) or decision errors (making the wrong decision). However, this
does not account for what the observer sees in their peripheral vision.
This new paradigm is bundled with new terminology and unique methods to ensure
that observer accuracy is maintained. In a move away from the traditional
descriptors of performance, localisations on an image are classified as lesion
localisation (LL) for correct mark-rating pairs and as non-lesion localisation (NL) for
for two different reasons: a lesion mimic has been localised or the localisation (mark)
is too far away from the true lesion (lack of localisation accuracy).
In order to classify mark-rating pairs as LL or NL a proximity criterion is required to
decide whether the localisation is near enough to the true lesions in an image. It is
commonplace to use an acceptance radius, emanating from the centre of a circular
lesion, or the outline of an irregular lesion as the proximity criterion. When using an
acceptance radius one must be mindful that the size (i.e. in pixels) can influence the
classification of LL and NL localisations17, with recent research indicating that this
should be determined by the largest lesion in the image.18
A new Curve and Figure-of-Merit
The FROC method can generate 2 different types of curve; the FROC curve and the
alternative FROC (AFROC) curve, Fig. 3. It is important to realise that the axes of the
curves are different to the ROC curve. The ROC curve is a plot of true positive
fraction (TPF), which is sensitivity, against false positive fraction (FPF), which is
1-specificity. The y-axis of a FROC curve is now normalised to the number of lesions
(lesion localisation fraction, LLF) rather than the number of abnormal cases, as in
ROC analysis.19 Instead of the FPF, the FROC curve displays the non-lesion localisation
fraction (NLF) on the x-axis, which is the number of NL localisations, divided by the
total number of cases.19 The AFROC curve is a hybrid of the previous two; it plots LLF
on the y-axis and FPF (in this instance the fraction of diseased cases with NL marks)
on the x-axis and is the most useful curve in FROC methods due to the fact that the
AFROC (JAFROC; see next section) figure-of-merit (FOM); frequently used in the
analysis of free-response data. The AFROC AUC defines the reward for LL marks and
penalise for NL marks, with the reward or penalty dependent on the confidence
score given.18
Testing for Statistical Significance
All observer performance studies rely on first defining FOMs and then testing for
statistical differences between them. When analysing data the test size (alpha; α) is
set to control the probability of two or more tests being declared different when in
fact they are actually similar. It is typical to set α = 0.05 in free-response studies.20 If
the value of α is set too small it is unlikely that statistical differences would be found.
On the other hand, a big α may indicate a statistical difference when in fact the tests
are similar.
For FROC studies it is typical to analyse the data using the JAFROC method, which
employs the Dorfman-Berbaum-Metz multi-reader multi-case (MRMC) analysis of
variance (ANOVA) for significance testing.21 The jackknife procedure removes
individual cases from the analysis and then re-calculates the outcome to define the
contribution of each case to the overall FOM. This produces pseudovalues that are
analysed by ANOVA; which in turn produces the 95% confidence intervals to assess
FOM difference. The JAFROC FOMs, produced in this analysis, define the probability
that a LL rating exceeds all NL ratings on normal images.22 This means that NL marks
on abnormal images are not used, and only the highest rated NL on normal images is
only a single rating is considered. The popularity of the JAFROC analysis method
arises from the ability to detect smaller differences between the imaging systems or
tests that are being compared.23
Methodological Considerations for a FROC Research Project
When planning an observer study one must be sure that the question is a suitable fit
to the techniques available. Typically, ROC/FROC methods are best suited for
assessing the diagnostic value of a new imaging technique or in the optimisation of
an existing one for a single, chosen pathology. It must also be understood that these
methods do not allow one to distinguish between co-existing abnormalities; for
example, pleural plaques and pneumonia on a CXR.
Sample size is a very important issue in observer performance, and studies are often
underpowered due to insufficient numbers of observers and cases. An
underpowered study can be of questionable value, but equally an overpowered
study can represent a waste of resources.24 A pilot study of relatively small numbers
of observers and cases can be useful for determining the required sample size for
optimal statistical power. Analysis software, such as JAFROC Version 4.225, will
provide the user with variance components that can be used in sample size
calculations. Work has been done to provide prospective researchers with a guide to
adequate numbers of observers and cases for a well-powered study,26,27 however it is
still recommended that researchers calculate sample size for their own study.26,27
A typical multi-reader multi-case (MRMC) study will assess the same presentation of
example of viewing a CXR in two different presentation states, normal display and
with grey-scale inversion. In such examples it is important that the true disease
status has previously been classified. It is also important that the level of difficulty is
controlled such that the task is not overly difficult or too simple such that
unappreciable numbers of false localisations are made on images. It has been
suggested that about 30% of the images should contain NL marks.14 From the
perspective of planning a study this does not just concern the selection of images for
use in the observer performance study but also the conspicuity, size and clinical
relevance of the pathology being localised.
In addition to optimising viewing conditions and ensuring that the monitor display is
calibrated to an appropriate standard, the method of image presentation and data
recording must be given thought. Computer programs28 and web-based software29
are both available solutions for completing an observer performance study.
FROC versus ROC: Which method should you use?
We now present a couple of examples of observer studies, indicating the most
suitable analysis method for the different type of research questions. The focus is on
making the correct decision between the FROC and ROC method.
Example 1
Research Question: How good are observers at recognising pneumonia on a
postero-anterior CXR?
Considerations: In this situation we are not looking at focal abnormalities.
Pneumonia can be patchy and/or diffuse and is not necessarily confined to a single
area that can easily be localised. In this situation the observer would be required to
take a global impression of the image and state confidence in the presence of
radiological findings indicating pneumonia. This study design assesses an observers’
ability to identify pneumonia with/without the clinical information. Similar numbers
of normal and abnormal cases are required in the set of test images.
Analysis Method: ROC; no localisation required.
Example 2
Research Question: How good are observers at detecting solitary pulmonary nodules
on a postero-anterior CXR?
Image presentation state: Normal display and grey-scale inversion.
Considerations: In this situation we are searching for a nodule. The nodule is likely to
be small and defined, occupying only a very small region of the image. To be certain
that the observer is making the correct decision, focussing on the true nodule, we
require the observer to localise the lesion with a good degree of precision in addition
to making a confidence score. In this study design we are comparing the observers’
ability to detect lesions on normal and grey-scale inverted radiographs.
Analysis Method: FROC; accurate localisation required.
ROC analysis has been an important tool in medical imaging and the development of
the FROC paradigm has enabled researchers to perform studies that are closer to the
clinical scenario. When planning an observer performance study it is important to be
aware of the methodological and statistical considerations that go towards
completing a successful study. This condensed introduction to ROC and FROC should
give researchers the base knowledge and direction to complete an observer
performance study.
Conflict of Interest
The authors have no conflict of interest to declare.
References
1. Burgess A. Signal detection theory – a brief history. In: Samei E, Krupinski E,
editors. The handbook of medical image perception and techniques. New
York: Cambridge University Press; 2010. p 26-46.
2. Burgess AE. The Rose model, revisited. J Opt Soc Am A Opt Image Sci
Vis;1999;16:633-64.
3. Manning DJ. Evaluation of diagnostic performance in radiography.
Radiography;1998;4:49-60.
4. Tingberg A, Båth M, Håkansson M, Medin J, Besjakov J, Sandborg M, et al.
Evaluation of image quality of lumbar spine images: a comparison between
5. Krupinski E. Perceptual factors in reading medical images. In: Samei E,
Krupinski E, editors. The handbook of medical image perception and
techniques. New York: Cambridge University Press; 2010. p 81-90.
6. Manning D. Cognitive factors in reading medical images. In: Samei E,
Krupinski E, editors. The handbook of medical image perception and
techniques. New York: Cambridge University Press; 2010. p 91-106.
7. Chakraborty D. Statistical power in observer-performance studies:
comparison of the receiver operating characteristic and free-response
methods in tasks involving localization. Acad Radiol;2002;9:147-56.
8. Zou KH, Liu A, Bandos AI, Ohno-Machado L, Rockette HE. Statistical Evaluation
of Diagnostic Performance: Topics in ROC Analysis. Boca Raton: Chapman and
Hall; 2012.
9. Robinson PJA. Radiology’s Achilles’ heel: error and variation in the
interpretation of the Röntgen image. Br J Radiol 1997;70:1085-98.
10. Jiang Y, Metz CE. BI-RADS data should not be used to estimate ROC curves.
Radiol;2010;256:29-31.
11. Metz CE. Receiver operating characteristic analysis: a tool for the quantitative
evaluation of observer performance and imaging systems. J Am Coll
Radiol;2006;3:413-22.
12. Hanley, JA. McNeil, BJ. The meaning and use of area under a receiver
operating characteristic curve. Radiol;1982;143:29-36.
13. Zou KH, O’Malley AJ, Mauri L. Receiever-operating characteristic analysis for
evaluating diagnostic tests and predictive models.
14. Chakraborty, DP. Recent developments in FROC methodology. In: Samei E,
Krupinski E, editors. The handbook of medical image perception and
techniques. New York: Cambridge University Press; 2010. p 216-39.
15. Chakraborty D, Yoon HJ, Mello-Thoms C. Spatial localization accuracy of
radiologists in free-response studies: inferring perceptual FROC curves from
mark-rating data. Acad Radiol;2007;14:4-18.
16. Chakraborty DP. Validation and statistical power comparison of methods for
analyzing free-response observer performance studies. Acad
Radiol;2008;15:1554–66.
17. Bandos AI, Rockette HE, Song T, Gur D. Area under the free-response ROC
curve (FROC) and a related summary index. Biometrics;2009;65:247-256.
18. Haygood TM, Ryan J, Brennan PC, Li S, Marom EM, McEntee MF, et al. On the
choice of acceptance radius in free-response observer performance studies.
Br J Radiol;2013;86:42313554.
19. Chakraborty DP. New developments in observer performance methodology
in medical imaging. Semin Nucl Med;2011;41:401-18.
20. Chakraborty DP. A status report on free-response analysis. Rad Prot
Dosimetry 2010;139:20-5.
21. Hillis SL, Berbaum KS. Monte Carlo validation of the Dorfman-Berbaum-Metz
method using normalized pseudovalues and less data-based model
simplification. Acad Radiol;2005;12:1534-41.
22. Chakraborty DP, Berbaum KS. Observer studies involving detection and
23. Chakraborty DP. Clinical relevance of the ROC and free-response paradigms
for comparing imaging system efficacies. Radiat Prot
Dosimetry;2010;139:37-41.
24. Chakraborty DP. Prediction accuracy of a sample-size estimation method for
ROC studies. Acad Radiol;2010;17:628-38.
25. JAFROC Analysis Software [computer program]. Version 4.2. Pittsburgh:
www.devchakraborty.com/downloads; 2014.
26. Obuchowski NA. Sample size tables for receiver operating characteristic
studies. Am J Roentgenol;2000;175:603-8.
27. Obuchowski NA, Hillis SL. Sample size tables for computer-aided detection
studies. Am J Roentgenol;2011;197:W821-W28.
28. Håkansson M, Svensson S, Zachrisson S, Svalkvist A Båth M, Månsson LG.
VIEWDEX: an efficient and easy-to-use software for observer performance
studies. Radiat Prot Dosimetry;2010;139:42-51.
29. Thompson J, Hogg P, Thompson S, Manning D, Szczepura K. ROCView:
prototype software for data collection in jackknife alternative free-response
receiver operating characteristic analysis. Br J Radiol;2012;85:1320-6.
Tables
Table 1: Variants of ordinal rating scales as may be used in an observer performance
study. From left to right, each rating indicates an increasing level of suspicion. Scales
Scale D is more typical of an FROC study, where a rating is applied to all suspicious areas. A Very unlikely D e ci si o n T h re sh o ld Unlikely D e ci si o n T h re sh o ld Possibly D e ci si o n T h re sh o ld Likely D e ci si o n T h re sh o ld Very likely B Definitely benign Possibly benign Unsure Possibly malignant Definitely malignant
C <20% ≥20%<40% ≥40%<60% ≥60%<80% ≥80%≤100%
D 1 2 3 4 5
Figure Captions
Figure 1: Typical ROC curve appearances. (A), a perfect test with AUC = 1; (B), a
better test; (C), a good test; (D), the chance diagonal, where a test with AUC = 0.5
represents a test that is no better than random guessing. Any test with a curve lying
below D (AUC<0.5) represents a test that is more often incorrect than correct.
Figure 2: The importance of measuring the partial area under the ROC curve (pAUC)
to assess which test offers greater sensitivity when the AUC is statistically similar.
This fictitious data shows intersecting ROC curves with statistically similar AUCs
(normal display, 0.820; grey-scale inverted 0.810).
Figure 3: Three empirical curves generated using JAFROC analysis software24 for a
single observer.
ROC Receiver Operating Characteristic
FROC Free-Response Receiver Operating Characteristic
AFROC Alternative Free-Response Receiver Operating Characteristic
JAFROC Jackknife Alternative Free-Response Receiver Operating Characteristic
AUC Area Under (the ROC) Curve
pAUC Partial Area Under (the ROC) Curve
FOM Figure of Merit
LL Lesion Localisation
NL Non-Lesion Localisation
TPF True Positive Fraction
LLF Lesion Localisation Fraction