1
Table Structure Recognition Based on Cell Relationship, a Bottom-Up
Approach
Darshan Adiga Shabir Bhat Muzaffar Shah Viveka Vyeth Datoin, Bengaluru, India
Abstract
In this paper, we present a relationship extraction based methodology for table structure recognition in PDF documents. The proposed deep learning-based method takes a bottom-up approach to table recog-nition in PDF documents. We outline the shortcomings of conventional approaches based on heuristics and machine learning-based top-down approaches. In this work, we explain how the task of table structure recognition can be modeled as a cell re-lationship extraction task and the impor-tance of the bottom-up approach in rec-ognizing the table cells. We use Multi-layer Feedforward Neural Network for ta-ble structure recognition and compare the results of three feature sets. To gauge the performance of the proposed method, we prepared a training dataset using 250 ta-bles in PDF documents, carefully select-ing the table structures that are most com-monly found in the documents. Our model achieves an overall accuracy of 97.95% and an F1-Score of 92.62% on the test dataset.
1 Introduction
Usage of digital documents have elevated dras-tically over the last two decades and a need for automatic information extraction from these doc-uments has increased. Portable Document For-mat (PDF) has been introduced by Adobe in 1993. PDF documents are the most common format of digital documents and are extensively used in sci-entific research, finance, enterprises etc. As the production and usage of PDF documents have in-creased massively, substantial research work has focused on automating the methods for
docu-ment analysis (Correa and Zander, 2017; Kava-sidis et al.,2018).
Tabular data is a powerful way to represent the data, among other elements of a document like charts, images etc. Tables are found in a variety of classes of digital documents and are very use-ful to readers to capture, search and compare the facts, summarizations and draw conclusions. Au-tomatically extracting the information from the ta-bles and representing the information in more con-venient formats for digital consumption add im-mense value in the field of document understand-ing (Gilani et al.,2017;Hao et al.,2016).
Tables contain structured data but often are ren-dered as semi-structured and unstructured on the digital documents for human consumption. Data can be represented using a variety of layouts in ta-bles without losing the meaning of data (Anand et al., 2019). The layout of tables can vary in alignment, line and word spaces, column and row spans, borders and other styling information. De-pending on the type of documents and authors, the tables may not contain any border lines and the structure of the tables will still be understandable to readers. The data represented by the tables in itself can have different semantics. For example, in a table, a column may contain a list of prices in dollars, indicating that all the values of that col-umn contain numeric data only. Similar seman-tic information is embedded in the table rows as well. Further, a column may have multiple sub-columns, making the original column to span mul-tiple table cells horizontally. In rare cases, rows can also span multiple table cells vertically. All these characteristics of a table make the automatic extraction of table information more challenging.
chal-lenged the researchers over the last two decades. An ample amount of research work has been car-ried out leading to a diverse list of approaches in-cluding heuristics, rule-engine, and recently ma-chine learning based proposals.
We believe, generalizing the patterns across the variety of table layouts in diverse type of doc-uments, is best solved by machine learning ap-proach. We propose a bottom-up approach for ta-ble structure recognition as a cell relation extrac-tion task between the table text tokens using deep learning. The way a human understands the ta-bles can be analogous to the proposed approach. Often, relation extraction task involves classifica-tion of an entity pair to a set of known relaclassifica-tions, using documents containing mentions of the en-tity pair (Kumar,2017). By considering the table recognition task as a relationship extraction prob-lem, we introduce a novel approach suitable for several document understanding solutions.
The proposed method deals with the basic building blocks of any table, the table cells. With this approach, we hope to solve the column and row spanning, the presence or absence of borders, and other challenges mentioned earlier. The table recognition system operates at token-level and in-volves learning the complex patterns in order to extract the cell relationships among the table text tokens using deep learning.
2 Related Work
According to the well-known ICDAR 2013 Table Competition (Gbel et al., 2013), the problem of table understanding can be split into table location detection, table structure recognition, and table in-terpretation. Each of these sub-problems has at-tracted a great deal of attention from researchers and has extensive work.
A peek at the literature shows that many heuris-tic solutions have been proposed for table struc-ture recognition. Most of those work consider the white space and layout analysis. Yildiz et al.
(2005) propose an algorithm to recognize the columns of a table using distances between lines and then identify the cells to find the rows. The al-gorithm makes a few assumptions about the struc-ture of the tables. The work of Kr¨upl and Her-zog (2006) takes a bottom-up approach towards structure recognition using heuristics but works on browser-rendered documents. The methodology aggregates words into columns by considering the
spatial distance of neighboring words.
Klampfl et al.(2014) experimented with two un-supervised approaches for table recognition and showcased the importance of spatial distances be-tween words of a table using vertical and horizon-tal histogram projection of words coordinates.
Experiments using rule-engine has been pro-posed by Shigarov (2015), considers the physi-cal layout of a rendered table, and the logiphysi-cal lay-out representing the relationships between the ele-ments of a table, differently. Another work of Shi-garov et al.(2016) shows promising results in rec-ognizing the columns and rows of tables by using the word and line distances, the order of appear-ance of text chunks. The methodology makes use of configurable thresholds in its heuristic decision making.
The heuristic and rule-based solutions make various assumptions on the visual, type and con-tent, structural details of tables and the thresholds used in the algorithms. These assumptions may not hold on heterogeneous documents and may even break the system.
Perez-Arriaga et al. (2016) have made use of both k-nearest neighbor and layout heuristics, making it a hybrid methodology to recognize the table structure. The method groups the words into rows and columns using spatial distances of words heuristically. Interestingly, the spatial dis-tance thresholds are learned using the k-nearest neighbor algorithm. Their work also proposes a heuristic method to identify the headers of the ta-ble. Deep learning based semantic segmentation has been used by Schreiber et al. (2017) where an image of a document is fed to the neural net-work to identify the rows and columns of a ta-ble. However, the work makes use of a heuristic post-processing step to improve the table structure recognition.
Clinchant et al. (2018) have made an exten-sive comparison of three different Machine Learn-ing approaches to recognize the table structure in hand-written register books. The method first recognizes the cell locations and then groups the cells into rows. The experimentations do a thor-ough comparison of CRF, a variation of Graph-CN called Edge-CN, and conventional Logistic Re-gression algorithms. However, the method works on already recognized headers and columns of the table and addresses only row recognition task.
re-lated work of table recognition try to identify the columns and rows of tables first and then locate the intersections of rows and columns as table cells. A few heuristics based works have considered the grouping of words into blocks and then aggregat-ing blocks into rows and columns. A common downside of these methodologies is that they fail to capture the information about rows and columns spanning multiple table cells. Few of the heuristic approaches do try to solve this issue however, they fail to generalize the solution.
We propose a purely bottom-up approach by building the table structure by recognizing the in-dividual cells of the table and their location in the document. The task of recognizing the table cells is addressed as cell-relation extraction between the tokens present in the table.
3 Methodology
In this section, we first explain how we modeled the table structure recognition as a relation extrac-tion task, then the training data preparaextrac-tion, and finally describe how the binary relationship clas-sification is modeled using a Multilayer Feedfor-ward Neural Network.
3.1 Cell Relationship Extraction in Table Structure Recognition
Humans will recognize the table structure even without a need for borders, based on visual clues, spatial distances and the content of the cells. These visual clues present in the tables help the readers to recognize the location of table cells eas-ily, by bringing all the words of a cell together both visually and semantically. The proposed method is based on this idea of identification of cell relation-ship among the table words. The first step towards the recognition of rows or columns is the identifi-cation of table cells and thus the whole process of table structure recognition is a bottom-up process. This reasoning is based on the underlying defini-tion of any table: Unit of a table is a cell, hori-zontal and vertical alignment of cells forms rows and columns, respectively. Tokens are generated by using white-space and new-line characters as delimiters. In this paper the termstokenandword
are used interchangeably.
Relation extraction is a well-known task in Nat-ural Language Processing, which deals with clas-sifying whether a given set ofnsamples have any ofmdifferent relationships. For example, in
lin-guistics, determining whether two or more expres-sions in a text refer to the same person or thing, is a relation extraction task. We take the idea of relation extraction and formulate the task of ta-ble structure recognition as identifying the cell-relationship among all the content of individual cells of a table. When the tokens that are part of a table are considered as the smallest possible ele-ments of a table, the relation extraction task will be to identify whether given two tokens of table text, belong to the same cell or not. If two tokens be-long to the same cell, then those two tokens have a
belong-to-same-cellrelation. In our experiments, this task of binary relationship extraction is con-sidered as a binary classification problem.
For every pair of tokens, the goal of binary rela-tionship classifier is to determine whether the two tokens belong to the same cell or not. An impor-tant thing to note here is that this relationship be-tween the two tokens is transitive. If a token A is related to the token B and the token B is related to the token C, then the token A is related to C. Hence, we don’t need to generate feature vectors of all the possible pairs of tokens in a cell to deter-mine all the tokens of a cell, we only need to make sure that all the tokens of a cell are connected via a chain of such transitive dependencies.
Once we predict the belong-to-same-cell rela-tion between token pairs, we group all the table tokens into different cells. This is a simple task of aggregating different token pairs into their respec-tive cells. Using this data of all the table cells and the tokens in each of the cells, we can model the recognition of rows and columns of the table again as a relation extraction task between the pairs of table cells themselves. However, in this work, we concentrate only on cell recognition.
3.2 Data Preparation
Detecting Tables and Training Data Generation
The detection of the location of tables in PDF doc-uments is the first task in the process of table ex-traction and this location information is prerequi-site to our system. There are several open source and free of charge tools for detecting table loca-tions in PDF documents. In our experiments, we usedTabulato obtain the location details of a table in the document. The location of a table is repre-sented by five values, pageNum, (startX, startY)
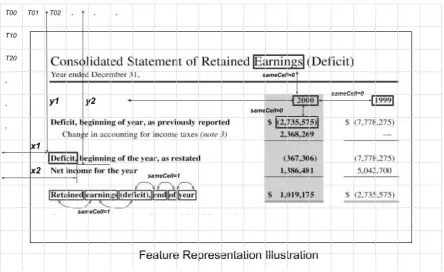
Figure 1: Features used in cell-relation extraction. A) T00, T01, T02,... are the tiles in the first row of tile matrix. B) T00, T10, T20,... are the tiles in the first column of tile matrix. C) (x1,y1) and (x2,y2) are the start and end coordinates of a token. D) sameCell=1, Pair of tokens which have sameCell relationship. E) samceCell=0, Pair of tokens which do not have sameCell relationship.
with respect to a Cartesian plane centered at the top-left corner of the document page. We used an off-the-shelf library to get the content in a PDF document inside a given region, that, along with the coordinates of characters (x,y), provides the font style for every character in the document. The characters along with their coordinates and font styles are further aggregated into tokens, by using the white-space and new-line characters as delim-iters.
With the help of table location and the loca-tion of individual tokens in the document, only those tokens which are within the given table loca-tion are collected by comparing their correspond-ing coordinate values. Specifically, all the to-kens, whose x coordinate is between startX and
endX and whose y coordinate is between startY
andendYare collected as table text tokens. After collecting all the tokens from table text using the table coordinates, we generate the train-ing data for the binary relationship classification. Training data requires a pair of tokens and a tar-get label indicating whether or not those two to-kens belong to the same cell or not. Once we have a list of all the tokens that are part of the table,
for every token, we create a pair of current to-ken with every toto-ken, which is located within an imaginary rectangular window around the current token. The size of this imaginary rectangular win-dow will help us determine the number of pairs of tokens to generate.
Training sample is a vector of all the features of a pair of tokens as denoted by1.
V = [W1Fi, W2Fi, sameCell] (1)
Where,W1Fiarenfeatures of first token,W2Fi
arenfeatures of second token, andsameCellis the target class indicatingTrue if the two tokens be-long to the same cell,Falseotherwise (see Figure
1).
The target class,sameCellis captured using Da-toin’s WYSIWYG annotation tool, that allows to select a sequence of words on the PDF document and tag those words as a table cell. The training data is generated using the annotated PDF doc-uments and the target label sameCellis assigned accordingly for all the pair of words.
Cell Relationship Features
tures of tabular data along with the mentioned fea-tures of this work can be one of the future works with the intention of improving the accuracy of the system.
We group the features used in the relation learn-ing task as four categories as below.
Location and Tile features(LTF). The absolute location of a token is important evidence to in-dicate that it is indeed part of the table. Along with the absolute location, a more generalized po-sitional information of tokens relative to the docu-ment makes the contextualization and localization of tokens easier for a reader.
To capture these relative location and distance information, for each token in the table, we con-sider (x,y) of starting of the token, and (x,y) of the ending of the token in documents (see Figure
1). In order to incorporate contextual information about a token, we split the entire document page into an imaginary matrix of tiles of size(n X m)
and for each tile, we assign a tile number. For each table token, based on its coordinates we find in which tile the token is located, and we include its tile number, the row, and columns of the tile as features of that token (see Figure1).
Neighborhood features(NF).The position of the surrounding tokens of a given token indicates the relative position of a token to its neighbors and captures the empty spatial distance around a to-ken. For a given table token, we find a list of n nearest tokens in all the four directions, left, right, top and bottom based on the neighboring tokens’ spatial distances with respect to the current token (see Figure 1). The horizontal and vertical rela-tive distances between these neighboring tokens are used as features. The Location and Tile fea-tures of neighboring tokens are also included as part of the given token’s feature set. This feature ensures that there exists a chain of transitive de-pendency connecting all the tokens of a cell.
Clustering and Alignment features(CAF).A hu-man reader makes use of the relative closeness and horizontal and vertical alignments of a given word, especially when a table is not completely bordered, to decide which cell the word belongs to. The proximity of a pair of tokens and the pres-ence of neighboring tokens for each token in four different directions captures the information about the relative closeness.
Among all the neighborhood tokens, we iden-tify whether a given token is nearer to the left
neighbor or right neighbor. Similarly, we identify whether that token is nearer to the top neighbor or bottom neighbor (see Figure1). We have used the absence of neighborhood tokens as a set of four categorical features as well, indicating whether or not a given token has left, right, top and bottom neighbor token.
Type and Style features(TSF). Another signifi-cant visual clue used by humans in determining whether two words belong to the same cell or not is the content and the styles used in the words. A binary feature representing whether a token is a number or not was used to capture the data simi-larity within a row or a column. For every pair of tokens, the comparison of font size and bold styles are used to indicate whether the two tokens have a similar font style or not. Use of semantic features of the content of words could be another important clue in differentiating the words into cells.
We find that Neighborhood, Clustering and Alignment features play a critical role in distin-guishing the tokens that do not belong to the same cell. All of the feature generation techniques are based on the coordinates of each of the tokens and the coordinates of the table itself. The number of tiles and the number of neighboring tokens are the parameters which can be tuned to achieve better table structure recognition accuracy.
3.3 Relation Classification Using Multilayer Feedforward Neural Network
We have used a Multilayer Feedforward Neural Networkto model the binary relationship classifier in the experiments. In order to learn the complex patterns that exist in the table layouts, and gen-eralize these patterns we decided that deep learn-ing is the right tool. Worklearn-ing at token-level, we have huge training data as well and deep neural networks seemed a right candidate for the task.
The generated training data is fed into the Mul-tilayer Feedforward Neural Network that usesrelu
activation function in the hidden layers and a sig-moid activation function in the output layer. The models were trained usingAdam optimizerand Bi-nary cross-entropy loss function as defined in 2
(Zhang,2019).
Loss=−[ylog(p) + (1−y) log(1−p)] (2)
Feature Parameter Value
Number of left, right, top and bottom neighbor tokens 1
Window size for token pair generation 30 x 30 pixels
Number of tiles 20 tile rows x 20 tile columns
Table 1: Word-level feature generation parameters
The input feature vector of Ndimension is fed into the network and the sigmoid output value is decoded as binary classes, 0 indicating that the two tokens do not belong to the same cell, 1 indicating that the two tokens belong to the same cell. In our experiments, the Multilayer Feedforward neu-ral network has been built usingKerasbacked by
Tensorflow, for quick experimentation and devel-opment.
4 Experiments and Results
4.1 Dataset and Evaluation Metrics
Due to the lack of publicly available datasets that suit our methodology, we prepared the training data on our own. The dataset used for the experi-ments contains a total of 250 PDF docuexperi-ments, hav-ing one table per document. We ensured that the tables present in our dataset represent the possi-ble diverse type of tapossi-bles that are most commonly used. Our dataset has tables with and without bor-ders, with and without column headings, with col-umn and row spans, with all types of text align-ments, varying line, and word spacing, and font styles. All the PDF documents were annotated us-ingDatoin’s WYSIWYG annotation tool.
Using the parameters listed in Table 1, we cre-ated approximately 0.3 million training samples from all the tokens of 250 tables, containing 83 different features. Training samples are split by a 9 to 1 ratio for training and testing, keeping ap-proximately 30,000 samples for testing.
Training data Test Data
True Class 60,000 9,000
False Class 2,10,000 21,000
Samples size 2,70,000 30,000
Table 2: Approximate distribution of target labels
The distribution of target labels in our training and testing dataset is shown in Table2. The imbal-ance in the distribution of classes makes sense be-cause for every token in the table, within an imag-inary rectangular window around that token, the
number of tokens that are in the same cell will be less than the number of tokens that are not in the same cell.
Measuring how many predicted cells are actual cells in a given table, would be a more explana-tory metric for evaluation. However, if one to-ken among all the toto-kens of a cell is wrongly pre-dicted by the relationship classification model as belonging to a different cell, then measuring the correctness of this prediction at a cell-level would be challenging. So we decided to use the accu-racy of the binary classification model itself as our evaluation metric. This token-level metric is sim-pler and straightforward.
4.2 Hyperparameters
We have experimented with the hyperparameters of the neural network architecture itself. Table3
defines the set of hyperparameters used in our ex-periments. In terms of the number of weights, Set-1is a simpler network with fewer weights to learn andSet-2is a more complex network.
Hyperparameter Set-1 Set-2
Number of layers 4 5 Number of Epochs 200 300 Batch size 300 100 Learning Rate 0.001 0.001
Table 3: Hyperparameters used in Multilayer Feedforward Neural Network
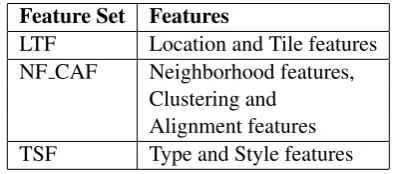
Feature Set Features
LTF Location and Tile features NF CAF Neighborhood features,
Clustering and Alignment features TSF Type and Style features
Table 4: Feature sets used in the experiments
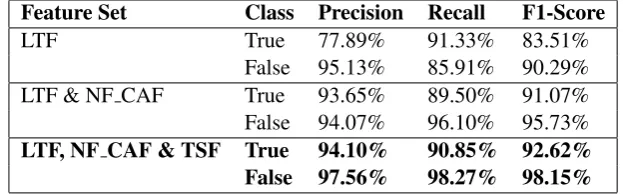
com-Feature Set Class Precision Recall F1-Score
LTF True 77.89% 91.33% 83.51% False 95.13% 85.91% 90.29% LTF & NF CAF True 93.65% 89.50% 91.07% False 94.07% 96.10% 95.73%
LTF, NF CAF & TSF True 94.10% 90.85% 92.62%
False 97.56% 98.27% 98.15%
Table 5: Results of binary relation classification using Hyperparameter Set-2
plex patterns in the data, at the cost of increased training time.
4.3 Experiments
We have experimented with many combinations of feature sets and feature generation parameters and selected the best three sets of features, as listed in Table4. TheNeighborhood featuresand Cluster-ing and Alignment featuresare combined into one set because both the features measure the togeth-erness of two given table tokens.
In each of these experiments, we have further experimented with 2 sets of neural network hyper-parameters listed in Table3.
4.4 Results and Discussion
All the experiments with the two sets of neural network hyperparameters listed in Table 3, indi-cated that Set-2 outperforms the Set-1. So, we have listed only the results of experiments carried out using hyperparametersSet-2in Table5.
Multiple experiments indicated that neighbor-hood features have sufficient information to cap-ture the table struccap-ture and the use of visual clues does increase accuracy. However, one experiment showed that increasing the number of neighboring tokens for each token, reduces theRecallmeasure ofTrueclass. Increased number ofFalse classes could be a possible explanation for this behavior. Also, increasing the number of hidden layers or hidden units of the network did not improve the accuracy further.
The model achieved an overall accuracy of
97.95% on the test set after training the network for about an hour. Clearly, the model is predicting the cell-relationships on unseen token pairs with very high accuracy. A set of 20 documents con-taining a variety of tables, which are not part of training documents, are considered as a validation set.
The F1-Score ofFalseclass is much better than
that of True class. One possible reason for this could be, the tokens that are not likely to be in the same cell will clearly have a distinguishable set of locational and neighboring features. It is clear that the recall ofTrueclass is causing the F1-Score to be low. Our training dataset has comparably fewer training samples for theTrueclass this could be a possible reason for the low recall scores.
Manual verification of individual table cells with the prediction of the relation classifier shows that the model is able to generalize the cell recog-nition task across a variety of table cells. The cell relationships are identified accurately irre-spective of the presence of borders lines, column, and row spans and text alignments. The rela-tionship among the tokens of a table is learned by the model based on Neighborhood, Clustering and Alignment features of the tokens. However, for a few tokens where the neighborhood features do not have a clear separation with tokens from nearby cells, the model combines the tokens from adjacent cells, producing wrong predictions. Be-cause of the absence of visual separation among the tokens of two closely aligned cells, the model predicts those multiple cells as a single cell.
5 Conclusion and Future Work
By applying the idea of relation extraction in ta-ble structure recognition task, we have shown the possibility of high accuracy information extraction in unstructured documents. Table structure recog-nition as relation extraction task is a novel ap-proach in table extraction process and to the best of our knowledge has never been explored. We have taken the first step towards this direction and have proved that a bottom-up approach of cell re-lationship extraction is the right way towards ta-ble structure recognition task. We have compared three sets of features and showcased the signifi-cance of cognitive features in our experiments.
adja-cent cells are wrongly identified as one cell. In-corporating the semantic features of the content of the words, especially using Natural Language Pro-cessing, will enrich the feature vector and should help the model to do better generalizations. Ex-ploring the different layout and visual features and improving the accuracy of the proposed method could be one of the possible future works.
Building on top of cell-relationship recognition work, we hope to explore the table structure ex-traction further. The knowledge of table cells can be used to build up the rest of the table structures from bottom-up. We believe that the relation ex-traction methodologies apply to other document understanding tasks and we hope to explore them as well.
References
Rahul Anand, Hye-Young Paik, and Cheng Wang. 2019. Integrating and querying similar tables from pdf documents using deep learning. CoRR abs/1901.04672.
S. Clinchant, H. Djean, J. Meunier, E. M. Lang, and F. Kleber. 2018. Comparing machine learning ap-proaches for table recognition in historical register books. In2018 13th IAPR International Workshop on Document Analysis Systems (DAS). pages 133– 138. https://doi.org/10.1109/DAS.2018.44.
Andreiwid Correa and Pr-ola Zander. 2017. Unleash-ing tabular content to open data: A survey on pdf table extraction methods and tools. pages 54–63.
https://doi.org/10.1145/3085228.3085278.
Azka Gilani, Shah Rukh Qasim, Imran Malik, and Faisal Shafait. 2017. Table detection using deep learning.https://doi.org/10.1109/ICDAR.2017.131.
M. Gbel, T. Hassan, E. Oro, and G. Orsi. 2013. Icdar 2013 table competition. In 2013 12th International Conference on Docu-ment Analysis and Recognition. pages 1449–1453.
https://doi.org/10.1109/ICDAR.2013.292.
L. Hao, L. Gao, X. Yi, and Z. Tang. 2016. A table de-tection method for pdf documents based on convo-lutional neural networks. In2016 12th IAPR Work-shop on Document Analysis Systems (DAS). pages 287–292. https://doi.org/10.1109/DAS.2016.23.
Isaak Kavasidis, Sergio Palazzo, Concetto Spampinato, Carmelo Pino, Daniela Giordano, Daniele Giuffrida, and Paolo Messina. 2018. A saliency-based convo-lutional neural network for table and chart detection in digitized documents. CoRRabs/1804.06236.
Stefan Klampfl, Kris Jack, and Roman Kern. 2014. A comparison of two unsupervised table recognition
methods from digital scientific articles. D-Lib Mag-azinehttps://doi.org/10.1045/november14-klampfl.
Bernhard Kr¨upl and Marcus Herzog. 2006. Visually guided bottom-up table detection and segmentation in web documents. InWWW.
Shantanu Kumar. 2017. A survey of deep learn-ing methods for relation extraction. CoRR abs/1705.03645.
Martha O. Perez-Arriaga, Trilce Estrada, and Soraya Abad-Mota. 2016. Tao: System for table detec-tion and extracdetec-tion from pdf documents. InFLAIRS Conference.
S. Schreiber, S. Agne, I. Wolf, A. Dengel, and S. Ahmed. 2017. Deepdesrt: Deep learning for detection and structure recognition of tables in document images. In 2017 14th IAPR Inter-national Conference on Document Analysis and Recognition (ICDAR). volume 01, pages 1162– 1167.https://doi.org/10.1109/ICDAR.2017.192.
Alexey Shigarov. 2015. Table
under-standing using a rule engine. Expert
Systems with Applications 42:929937.
https://doi.org/10.1016/j.eswa.2014.08.045.
Alexey Shigarov, Andrey Mikhailov, and An-drey Altaev. 2016. Configurable table struc-ture recognition in untagged pdf documents.
https://doi.org/10.1145/2960811.2967152.
Burcu Yildiz, Katharina Kaiser, and Silvia Miksch. 2005. pdf2table: A method to extract table infor-mation from pdf files. pages 1773–1785.