ABSTRACT
DUONG, MINH DAO. Using Novel Data Collection Methods to Evaluate Thermometer Use. (Under direction of Dr. Benjamin Chapman)
In the United States, an estimated 48 million cases of foodborne illness caused by known agents occur annually leading to 55,961 hospitalizations, 1,351 deaths, and an economic burden of $77.7 billion each year. Undercooked and/or poorly handled poultry ranks first for estimated annual disease burden because of its association with Campylobacter species and Salmonella enterica. Consumer guidance following foodborne illness outbreaks recommends: washing hands, kitchen surfaces, and utensils with soap and water and disinfecting after washing; cooking meat thoroughly to the recommended internal temperature as measured with a food thermometer; avoiding cross-contamination; and storing food under proper conditions. Incidences of foodborne illness in the home are difficult to estimate because cases are underreported, sporadic or
dependent upon estimates where data are not available. Much of the information about food safety in the home comes from two sources: analyses of foodborne illness outbreaks and consumer-based research studies. In recent years, research on food handling practices in the home has become a more explored area of food science, but the number of studies is still small. The purpose of this thesis was to collect thermometer use behaviors utilizing mixed-methods data collection techniques such as citizen science and observations – two areas where minimal work has been done in the realm of food safety.
recommended food handling practices, but focused primarily on cross-contamination and hand-washing.
A citizen science study was conducted with high school students in Pennsylvania and North Carolina over Thanksgiving break 2016 looking at thermometer use practices for whole turkeys. Results showed that most respondents used a thermometer to determine doneness of the turkey. The majority those using a thermometer preferred a dial thermometer over a digital one when measuring the internal temperature of a turkey. Citizen science uses a mixed-methods approach through a text and photograph response, and can help in overcoming potential biases associated with self-reported behaviors through direct text.
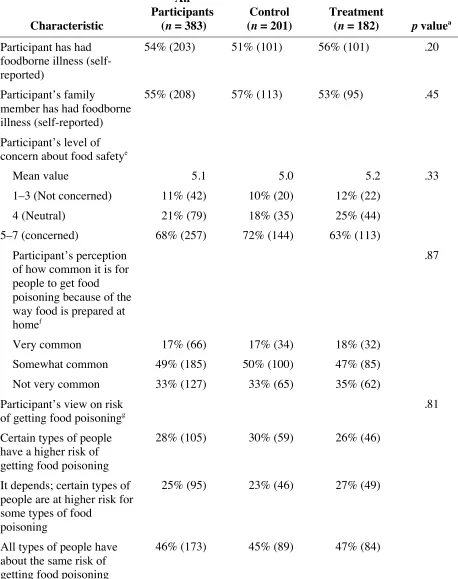
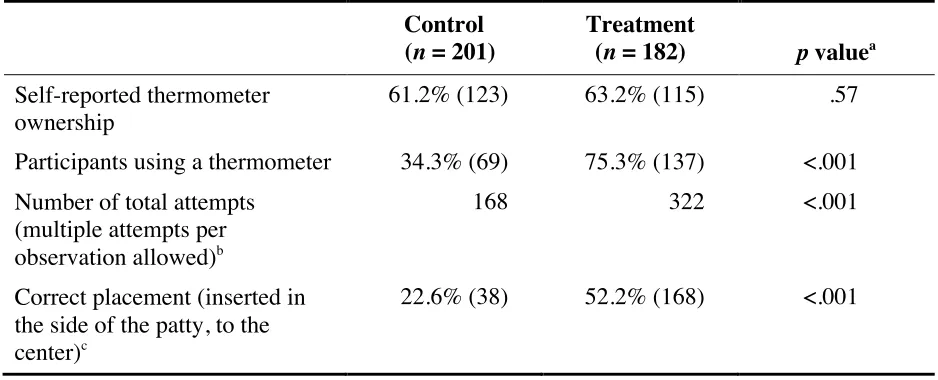
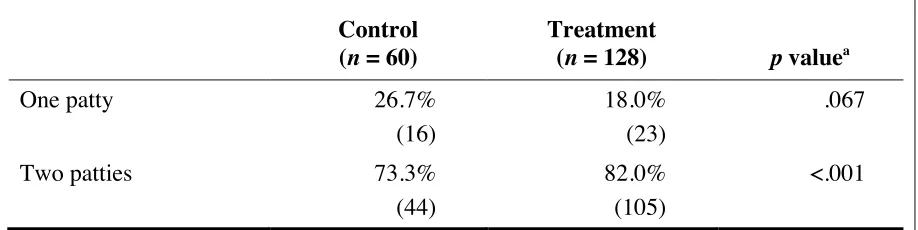
The other study was a comprehensive meal preparation study utilizing survey and observation techniques in model kitchens with 383 participants. Individuals completed a questionnaire before and after the cooking process, and were observed using video cameras set up at various locations throughout the kitchen. Study participants were randomly assigned to a treatment or control group (182, 201) with the treatment group being exposed to the USDA-produced intervention video on ““The Importance of Cooking to a Safe Internal Temperature and How to Use a Food Thermometer”. Data on thermometer usage, temperature achieved using a thermometer, placement of thermometer during measurement, and flipping of patties were collected. Results demonstrated the effectiveness of the intervention video in influencing thermometer use, but many that used the thermometer did so incorrectly.
Using Novel Data Collection Methods to Evaluate Thermometer Use
by
Minh Dao Duong
A thesis submitted to the Graduate Faculty of North Carolina State University
in partial fulfillment of the requirements for the degree of
Master of Science
Food Science
Raleigh, North Carolina 2018
APPROVED BY:
______________________________ _____________________________
Dr. Benjamin Chapman Dr. Lee-Ann Jaykus
Committee Chair
______________________________ _____________________________
ii DEDICATION
iii BIOGRAPHY
Minh Duong was born in Saigon, Vietnam and immigrated to the United States when he was two years old. He is the son of Mai Duong and Thanh Thang, and older brother to Duy Duong and Will Duong. He calls Centreville, Virginia his home. Minh’s first interaction with the world of food safety came when he was in the 4th
grade. He had gotten Salmonellosis, although it was never diagnosed, from chicken his parents had undercooked and left out. Minh called the experience as “super fun” at the time because he was able to get out of school and help his cousin with her wedding weekend. His memories of the picking up catering arrangements, preparing decorations, and dancing on the dance floor at the wedding were what he remembered – not the part of being on the toilet non-stop and being dehydrated.
iv ACKNOWLEDGMENTS
I would like to extend my deepest appreciations to Dr. Benjamin Chapman. I am truly blessed to have met such an awesome human being that cares so much about how someone is doing. His mentorship has allowed for me to grow not only as a researcher, but also a person. I also want to especially thank Dr. Lee-Ann Jaykus for her support, wisdom, and guidance these past two years. Thank you to my two other committee members, Dr. Eric Laber and Dr. Anne McLaughlin, as well for their expertise and help throughout my thesis. I would also like to thank John Luchansky and Anna Porto-Fett for their support, collaboration, and mentorship.
I want to thank all of the members of the Chapman for their friendship, companionship, and support. Thanks to Chris Rupert for keeping things chill at home and at work. For all the cubicle chats and gossip, I would like to thank Mary Yavelak and Sarah Cope. Thank you both for laughter and serious talks we’ve had while listening to “CASH money”. A special thanks to Sarah Cope for reminding me that there’s more to life than just research – especially when there’s food involved. Thank you to Katrina Levine for taking care of all the behind-the-scenes lab things. Thank you to Natalie Seymour for her words of wisdom on graduate school and life.
With the kitchen study project being so big, I could not have done it without the help of so many individuals. Thank you to Rebecca Goulter and Lisa Shelley for their kindness, her ability to lead and manage, and funny reactions to consumers not following proper practices. Thanks to Meg Kirchner who acted as my other half on this project – it was much easier
v that always kept day-long observations light. Thank you to all of the temporary employees who helped out on this kitchen study project.
Thank you to my friends who have stuck with me through the highs and lows of my thesis. Thanks for listening to me vent/rant, playing games with me, going out with me, and supporting me. A special thanks to Lily Yang for her constant encouragement, mentorship, and friendship. Thanks to my girlfriend, Susan Chen, for believing in me and reminding me of the things in life that aren’t research-related.
vi TABLE OF CONTENTS
LIST OF TABLES... vii
LIST OF FIGURES... vii
INTRODUCTION...1
References...4
Chapter 1: Literature Review...7
References...18
Chapter 2: Developing a Citizen Science Method to Collect Whole Turkey Thermometer Usage Behavior...25
Abstract...25
Introduction...26
Methods...30
Results...33
Discussion...34
References...49
Chapter 3: Meal Preparation Experiment Related to Thermometer Use...55
Abstract...55
Introduction...56
Methods...58
Results...64
Discussion...69
References...87
CONCLUSIONS...91
APPENDICES...94
Appendix A: Screening Questionnaire...95
Appendix B: Observation Scripts and Recipes...99
Appendix C: Informed Consent Forms...102
Appendix D: List of Equipment Provided in Each Test Kitchen...105
vii LIST OF TABLES
Table 3.1 Characteristics of Participants...74 Table 3.2 Prevalence of thermometer use...77 Table 3.3 Number of Patties for Which Temperature Was Checked Among Participants
Who Use a Food Thermometer...78
Table 3.4 Number of Flips per Patty (two patties per participant)...79 Table 3.5 Time-Temperature Combinations for Turkey Patties Deemed Safe...80 Table 3.6 Distribution of Maximum Internal Temperatures for Burgers Cooked by
Participants Using a Food Thermometer...81 Table 3.7 Methods Used to Determine Doneness of Burgers by Participants Who Did Not
Use a Food Thermometer...82 Table 3.8 Other Methods Used to Determine Doneness by Participants Who Used a Food
viii LIST OF FIGURES
Figure 2.1 Food safety curriculum template...40
Figure 2.2 Thermometer usage data collection instrument...44
Figure 2.3 Sample of pictures provided by data collectors...45
Figure 2.4 Thermometer type usage by citizen scientists on whole turkey...46
Figure 2.5 Thermometer recorded internal temperature of whole turkey by citizen scientists...47
Figure 2.6 Thermometer placement in whole turkey by citizen scientists...48
Figure 3.1 Turkey Patty with Heat Maps Showing Thermometer Placement by Group...84
Figure 3.2 Study Procedures for Meal Preparation Experiment on Thermometer Use...85
1 INTRODUCTION
Approximately 600 million foodborne illnesses, 420,000 deaths, and the loss of 18 million disability-adjusted life years occurs annually worldwide (The World Health
Organization, 2015). In the United States, an estimated 48 million cases of foodborne illness from known sources occur annually, leading to 55,961 hospitalizations, 1,351 deaths, and an economic burden of $77.7 billion each year (Scharff, 2012, Scallan et al., 2011). Of the possible pathogen-food combinations ranked by Batz et al. (2012), undercooked and/or poorly handled poultry ranked first for estimated annual disease burden because of its association with
Campylobacter species and Salmonella enterica, which ranked first and forth respectively. According to the United States Foodborne Disease Outbreak System data from 1998-2012, 25% of outbreaks (279 of 1114) were associated with poultry (Chai et al., 2017). The Centers for Disease Control and Prevention’s (CDC) consumer guidance following outbreaks consists of advice on: washing hands, kitchen surfaces, and utensils with soap and water and disinfecting after washing; cooking meat thoroughly to the recommended internal temperature as measured with a food thermometer; avoiding cross-contamination; and storing food under proper
conditions (CDC, 2013a, CDC, 2013b). An estimated 3.5 million cases of foodborne illness are caused specifically because of inadequate cooking of animal derived foods or
2 Much of the information about food safety in the home comes from two sources: analyses of foodborne illness outbreaks and consumer-based research studies. In recent years, the research on food handling practices in the home has become a more explored area, but the numbers of studies are still small (Griffith & Worsfold, 1994, Nesbitt et al., Redmond and Griffith, 2003). Most of the studies on domestic food handling (n=88) collect data using surveys (questionnaires and interviews), focus groups, and observations with 75% of them being surveys. The purpose of this thesis was to collect data on thermometer use behaviors use utilizing mixed-methods data collection techniques such as citizen science and observation – two areas where minimal work has been done in the realm of food safety. Self-reported data can be unreliable due to
over-reporting associated with social-desirability bias, which is where consumers have the tendency to answer based on what they perceive to be correct or acceptable (Crowne and Marlowe, 1964, Redmond and Griffith, 2003).
This thesis begins with a citizen science study conducted with high school students in Pennsylvania and North Carolina over Thanksgiving break 2016 looking at thermometer use practices for whole turkeys (Chapter 2). Citizen science is a data collection method that is used across a large geographic scale and over a long duration that attempts to conserve resources (Bonney et al.,2014). Potential biases concerning self-reported behaviors can be overcome by validation with a photograph (Daviest et al., 2012, Forys and Hevesh, 2017, Suzuki-Ohno et al., 2017). This study included the usage of photographs in addition to self-reported data, and can be a methodology worth exploring in the future.
3 were observed using video cameras set up at various locations throughout the kitchen. Study participants were randomly assigned to a treatment or control group (182,201). The treatment group watched a USDA-produced intervention video on “The Importance of Cooking to a Safe Internal Temperature and How to Use a Food Thermometer”. Participants were observed while cooking turkey burgers and preparing a chef’s salad to determine whether they used a
4 REFERENCES
1. Batz, M. B., Hoffmann, S., & Morris, J. G. (2012). Ranking the disease burden of 14 pathogens in food sources in the United States using attribution data from outbreak investigations and expert elicitation. Journal of Food Protection, 75(7), 1278–91. https://doi.org/10.4315/0362-028X.JFP-11-418
2. Bruhn, C. (2014). Chicken Preparation in the Home: An Observational Study. Food Protection Trends, 34(5), 318–330. Retrieved from
http://www.foodprotection.org/publications/food-protection-trends/article-archive/2014-09chicken-preparation-in-the-home-an-observational-study
3. Centers for Disease Control and Prevention. 2013. Multistate outbreak of Campylobacter jejuni infections associated with undercooked chicken livers – Northeastern United States, 2012. Available at: https://www.cdc.gov/mmwr/preview/mmwrhtml/mm6244a2.htm%0D. Accessed 21 August, 2017.
4. Centers for Disease Control and Prevention. 2013. Multistate outbreak of Salmonella Heidelberg infections linked to chicken (Final update). Available at:
https://www.cdc.gov/salmonella/heidelberg-02-13/index.html. Accessed 17 August, 2017. 5. Chai, S. J., D. Cole, A. Nisler, and B. E. Mahon. 2017. Poultry: the most common food in
outbreaks with known pathogens, United States, 1998–2012. Epidemiol. Infect. 145: 316– 325.
6. Crowne, D.P., Marlowe, D. (1964) The approval motive. New York: Wiley.
5 using identification photographs sourced from the public. Wildlife Research, 39(8), 696–704. https://doi.org/10.1071/WR12092
8. Forys, E. A., & Hevesh, A. R. (2017). Investigating Black Skimmer Chick Diets Using Citizen Science and Digital Photography. Southeastern Naturalist, 16(3), 317–325. https://doi.org/10.1656/058.016.0301
9. Griffith, C. J., & Worsfold, D. (1994). Application of HACCP to food preparation practices in domestic kitchens. Food Control, 5(3), 200–204.
https://doi.org/10.1016/0956-7135(94)90084-1
10.Kennedy, J., Gibney, S., Nolan, A., O’Brien, S., McMahon, M. A. S., McDowell, D., … Wall, P. G. (2011). Identification of critical points during domestic food preparation: an observational study. British Food Journal, 113(6–7), 766–783.
https://doi.org/10.1108/00070701111140106
11.Maughan, C., Chambers, E., Godwin, S., Chambers, D., Cates, S., Koppel, K. (2016). Food Handling Behaviors Observed in Consumers When Cooking Poultry and Eggs. Journal of Food Protection, 79(6), 970–977. https://doi.org/10.4315/0362-028X.JFP-15-311
12.Medeiros, L. C., Hillers, V. N., Kendall, P. A., & Mason, A. (2001). Food Safety Education: What Should We Be Teaching To Consumers? Journal of Nutrition Education, 33(2), 108– 113. https://doi.org/10.1016/S1499-4046(06)60174-7
6 14.Phang, H.S., & Bruhn, C. M. (2011). Burger Preparation: What Consumers Say and Do in
the Home. Journal of Food Protection, 74(10), 1708–1716. https://doi.org/10.4315/0362-028X.JFP-10-417
15.Redmond, E. C., & Griffith, C. J. (2003). Consumer food handling in the home: a review of food safety studies. Journal of Food Protection, 66(1), 130–61. https://doi.org/10.4315/0362-028X-66.1.130
16.Scallan, E., Hoekstra, R. M., Angulo, F. J., Tauxe, R. V., Widdowson, M. A., Roy, S. L., … Griffin, P. M. (2011). Foodborne illness acquired in the United States-Major pathogens. Emerging Infectious Diseases, 17(1), 7–15. https://doi.org/10.3201/eid1701.P11101
17.Scharff, R. L. (2012). Economic Burden from Health Losses Due to Foodborne Illness in the United States. Journal of Food Protection, 75(1), 123–131. https://doi.org/10.4315/0362-028X.JFP-11-058
18.Suzuki-Ohno, Y., Yokoyama, J., Nakashizuka, T., & Kawata, M. (2017). Utilization of photographs taken by citizens for estimating bumblebee distributions. Scientific Reports, 7(1), 1–11. https://doi.org/10.1038/s41598-017-10581-x
19.World Health Organization. (2015). WHO | WHO estimates of the global burden of
7 CHAPTER 1
Literature Review
8 Worsfold, 1994). In recent years, research on food handling practices in the home has become a more explored area of food science, but the number of studies is still small (Griffith and
Redmond, 2003 and Nesbitt, 2014).
Consumer Attitudes, Perceptions, and Knowledge of food safety
Many behavioral change models use attitudes, perception, motivation, and social norm as precursors for intentions and behavior. There are theoretical models (e.g., theory of planned behavior and the health belief model, as examples) developed by cognitive psychologists that attempt to put each of these factors into relationship constructs (Azjen et al., 1991, Rosenstock et al., 1988). Attitudes are the variables guiding or influencing behavior (Fishbein and Azjen, 1975). A study by Redmond and Griffith (2004) looked at consumer attitudes and perceptions in domestic kitchens and found that consumers have more positive than negative attitudes for safe food preparation, but attitudes expressed were not consistent with safe food-handling behaviors. Fein et al., (1995) found that consumers misperceived the nature of foodborne illness in homes and the most likely place where the food causing illness was prepared believing the preparation factor most responsible for illness was use of leftovers and old food (27%) and only
acknowledged inadequate cooking as a potential factor 10% of the time.
A study by Kennedy and colleagues (2011) in Ireland, in which participants were filmed preparing a specified recipe accompanied by microbiological testing compared differences in knowledge and attitude to observed behaviors. The group found that participants attributed a high level of importance to checking that beef burgers and poultry were sufficiently cooked, as compared to other food safety practices, but failed to employ the methods they deemed
9 Subjective indicators of cooking that are not science-based, including visual cues such as the color of the meat, are unreliable in gauging doneness (Hague et al., 1994, Hunt et al.,1995, Røssvoll et al. 2014). Coloration is impacted by factors such as pH, meat source, packaging, and fat, and meat can be brown before being cooked thoroughly (King and Whyte, 2006). Somewhat troubling was observational research shows that the majority of consumers (39%-78%) relied on visual indicators such as color to determine doneness instead of a thermometer (Bruhn et al., 2014, Phang and Bruhn, 2011, Kennedy et al.,2011, Maughan et al., 2015). Research methods used to collect consumer food safety data consist of self-completion questionnaires,
interviews/surveys, focus groups, and observational studies. Self-reported data consisting of questionnaires, interviews, and surveys account for the majority of these (Redmond and Griffith, 2003).
10 marinating food correctly, and throwing out foods according to safe storage times provided by “Be Food Safe”.
Cooking for safety knowledge, perception and messaging
Consumer knowledge of thermometer use and cooking thoroughly has been measured by researchers with various methodologies including asking consumers about their attitudes and perceptions, surveying consumer self-reported behaviors, and observing consumer behaviors (Bruhn and Schutz, 1998, Redmond and Griffith, 2003, Godwin et al., 2005, Kennedy et al.,2005, Nesbitt et al., 2014). In addition, ownership of thermometers by consumers is often associated with consumer knowledge of thermometer use or adequate cooking by researchers (Lando et al., 2012).
The inadequate cooking of animal foods or cross-contamination of these foods is estimated to be responsible for 3.5 million cases of foodborne illness annually in the United States (Medeiros et al., 2001). A literature review by Nesbitt and colleagues in Canada looked at peer-reviewed, published literature, and non-peer-reviewed public opinion research reports, and evaluated consumer food safety behaviors including “cook” based on the Partnership for
Consumer Food Safety Education’s FightBAC Program (Nesbitt et al., 2014). The study found that the majority of Canadians (7% - 32%) did not use a food thermometer when cooking and used visual cues, or time and taste to determine if the food was cooked enough (Nesbitt et al., 2014). The Redmond and Griffith (2003) review of consumer food handling studies in the home concluded that 80-93% of the United States and United Kingdom populations lacked knowledge on correct heating temperatures.
11 account for most cases of foodborne illness (Bryan, 1988, Medeiros et al.,2001). Healthy People 2020 noted that the area with the greatest need for improvement was “cook” since only 37% of consumers reported achieving the goal of heating meat and poultry to a temperature high enough to kill pathogens (US DHHS, 2010). Consumers realize that meat items are a potential pathogen source, and that there is a need to adequately cook meats to kill pathogens (Altekruse et al., 1996). The FDA’s Food Safety Survey 2016 provided insight into consumer attitudes regarding thorough cooking, finding that 40% of consumers believed that not thoroughly cooking meat or chicken will lead to illness (Lando et al., 2016). Consumers expressed similar thoughts in the International Food Information Council’s (IFIC) 2016 Food and Health Survey, in which 24% and 38% of respondents who answered “yes” to hearing of E. coli O157:H7and Salmonella as a problem in food believed that food contaminated with these pathogensrespectively, could be made safe by cooking. Hillers et al. (2003) completed a study ranking consumer food-handling behavior associated with foodborne illness caused by thirteen pathogens and found that
thermometer use is ranked of primary importance for prevention of illness with Campylobacter jejuni, Salmonella species, E. coli O157:H7, Toxoplasma gondii, and Yersinia enterocolitica.
Consumers may not always use prescribed steps to determine doneness and rely on sensory or subjective indicators. Subjective indicators that are not science-based, including visual cues such as the color of the meat are unreliable in gauging doneness (Hague et al., 1994, Hunt et al.,1995, Røssvoll et al. 2014). Coloration is impacted factors such as pH, meat source, packaging, and fat, and meat can be brown before being cooked thoroughly (King and Whyte, 2006). Somewhat troubling is observational research showing that the majority of consumers (39-78%) relied on visual indicators such as color to determine doneness instead of a
12 2015). Research methods used to collect consumer food safety data consist of self-completion questionnaires, interviews/surveys, focus groups, and observation studies. Self-reported data consisting of questionnaires, interviews, and surveys account for the majority of these (Redmond and Griffith, 2003).
Self-reported studies (Questionnaires, Interviews, and Focus Groups)
Studies done by Nesbitt et al. (2003) and Redmond and Griffith (2003) found that focus groups were underused in consumer food safety studies, accounting for only 8%-21% of the literature. Focus groups are used to help researchers understand the behaviors, customs, and insights of consumers (Lewis-Beck et al., 2004). This methodology is a focused discussion led by a moderator that engages participants on a topic (Lewis-Beck et al., 2004). Focus groups can aid in discovering barriers that might impede certain behaviors, understanding perceptions and attitudes of an idea or behavior, or discovering reasons behind behaviors, but should not be used as a methodology or test of knowledge or skills (Lewis-Beck et al., 2004).
13 The 2016 FDA Food Safety Survey found 67% of respondents reported owning a food thermometer, but 19% used one when cooking chicken parts and 10% used one for hamburgers (Lando et al., 2016). The 2016 Food and Health Survey conducted by IFIC showed that
consumers use a food thermometer 30% of the time to check doneness of meat and poultry items, but only cook to the required temperature for their meat 66% of the time. Kosa and colleagues (2014) conducted a national survey on raw poultry handling practices and found that 62% of the consumers that reported owning a food thermometer used it to check the doneness of larger cuts of poultry (56.7%-73.2%) in comparison to smaller cuts (12%-26%). IFIC’s Food and Health Survey (2016) surveyed individuals asking, what would encourage them to use a thermometer. Fifty-one percent of respondents said they would use one if given a free thermometer (IFIC, 2016). A national telephone survey by Jay and researchers in Australia asked respondents to comment on how they preferred their hamburgers and ground meat cooked on a scale from “raw”, “rare”, “medium”, “well done”, or “burned”. A total of 23.5% of survey participants preferred “raw”, “rare”, or “medium” for hamburgers, and 21.3% for ground meat (Jay et al., 1999).
14 (Lewis-Beck et al.,2004). The first method for minimizing bias was utilized by Kosa et al. (2004) by asking questions about the last time a respondent prepared the product rather than asking them to report how they would prepare the product.
Citizen science
Citizen science involves the use of volunteers to collect and/or analyze data as part of a scientific inquiry to where the participants are gaining valuable insight into the process
(Silvertown,2009). The methodology has been used widely in ecology and environmental science where over 600 Web of Science categories exist for these two fields (Kullenberg and Kasperowski, 2016). Although not trained as scientists, citizen scientists gather data quickly and efficiently that cannot otherwise be obtained, particularly if resources are limited (Bonney et al.,2014). Citizen science provides a platform to collect data that can be expanded on a large geographic scale and over a long duration, while conserving resources (Bonney et al.,2014). For example, researchers have collected data on shark behavior, black skimmer chicks, and
bumblebees using photographs taken by citizen scientists (Daviest et al., 2012, Forys and Hevesh, 2017, Suzuki-Ohno et al., 2017). Although limited research has been done using pictures to verify self-reported data, studies in ecology show that utilizing of photographs may correct mistakes associated with the identification of particular related species that may look similar (Silvertown et al., 2009, Gardiner et al. 2012). One of the ways that citizen science overcomes the potential biases associated with self-reporting of data is validation using pictures. Mixed-methods studies
15 Observational data are tested for reliability by assessing the intra- and inter-observer reliability of the observation by obtaining the same results when measuring the same action/behavior on different occasions for the former, and correlating the records from one observer to another for the latter. Observer biases and the Hawthorne Effect, defined as the alteration of behavior by a participant in a study due to an awareness of being watched, can limit the reliability of the observation technique. The observer’s perception can influence which practices are recorded or not recorded (Bowling, 2002). The observer may influence participant behavior by virtue of the fact that participants are aware they are being observed. Potential biases associated with
reliability can be overcome by employing practices such as not fully revealing to participants what practices are being observed or posing as staff members (Chapman et al., 2010, Anderson et al., 2004, Clayton et al., 2004).
16 opting for cutting with a knife or poking with a utensil to test doneness of chicken breast,
meatloaf, or halibut (Anderson et. al, 2004).
Observational research studies have utilized cuts of poultry, ground beef, eggs, and fish as main components of recipes (Anderson et al., 2004, Bruhn, 2014., Phang and Bruhn, 2011., Worsfold and Griffith, 1997, Jay et al., 1999, Maughan et al., 2016). Maughan et al. (2016) was the only research study to use ground poultry for consumer preparation, finding that only 22% of participants used a thermometer to determine doneness, while the other 78% used indicators such as color of the inside or outside of the patties and the color of the juices. Kennedy and colleagues (2011) performed a study in Ireland, in which participants were filmed preparing a specified recipe and data were compared to note differences in knowledge and attitude versus observed behaviors. The group found that participants attributed a high level of importance to checking that beef burgers and poultry were sufficiently cooked compared to other food safety practices but failed to employ this method that they deemed important. In addition, a large number of samples of the specified meats were undercooked when analyzed by researchers (Kennedy et al., 2011).
18 REFERENCES
1. Ajzen, I. (1991). The theory of planned behavior. Orgnizational Behavior and Human Decision Processes, 50, 179–211. https://doi.org/10.1016/0749-5978(91)90020-T
2. Altekruse, S. F., Street, D. A., Fein, S. B., & Levy, A. S. (1995). Consumer Knowledge of Foodborne Microbial Hazards and Food-Handling Practices. Journal of Food Protection, 59(3), 287–294. https://doi.org/10.4315/0362-028X-59.3.287
3. Anderson, J. B., Shuster, T. A., Hansen, K. E., Levy, A. S., & Volk, A. (2004). A Camera’s view of consumer food-handling behaviors. Journal of the American Dietetic Association, 104(2), 186–191. https://doi.org/10.1016/j.jada.2003.11.010
4. Bonney, R., Shirk, J. L., Phillips, T. B., Wiggins, A., Ballard, H. L., Miller-Rushing, A. J., & Parrish, J. K. (2014). Citizen science: Next steps for citizen science. Science, 343(6178), 1436–1437. https://doi.org/10.1126/science.1251554
5. Bowling, A. (2002). IN HEALTH Investigating health and health services. Health San Francisco, 171–172.
6. Bruhn, C. (2014). Chicken Preparation in the Home: An Observational Study. Food Protection Trends, 34(5), 318–330. Retrieved from
http://www.foodprotection.org/publications/food-protection-trends/article-archive/2014-09chicken-preparation-in-the-home-an-observational-study/
7. Bryan, F. L. (1988). Risks of Practices, Procedures and Processes that Lead to Outbreaks of Foodborne Diseases. Journal of Food Protection, 51(8), 663–673.
19 8. Centers for Disease Control and Prevention. (2011). Multistate Outbreak of Human
Salmonella Heidelberg Infections Linked to Ground Turkey (Final Update). Retrieved from https://www.cdc.gov/salmonella/2011/ground-turkey-11-10-2011.html
9. Centers for Disease Control and Prevention. (2011). Multistate Outbreak of Human
Salmonella Hadar Infections Associated with Turkey Burgers (Final Update). Retrieved from https://www.cdc.gov/salmonella/2011/turkey-burger-4-4-2011.html
10.Centers for Disease Control and Prevention. (2017). Surveillance for foodborne disease outbreaks United States, 2015: Annual Report, 1–24.
11.Chapman, B. J., Maclaurin, T., & Powell, D. A. (2013). Video observation and data goding methods to assess food handling practices at food service. Food Protection Trends, 33(3), 146–156.
12.Cody, M., & Hogue, M. A. (2003). Results of the Home Food Safety--it ’ s in Your Hands
2002 Survey : ... Journal of the American Dietetic Association;
13.Cressey, P., & Lake, R. (2011). Estimated incidence of foodborne illness in New Zealand : Application of overseas models and multipliers. Retrieved from
https://scholar.google.co.nz/scholar?q=Estimated+incidence+of+foodborne+illness+in+New +Zealand:+Application+of+overseas+models+and+multipliers&hl=en&as_sdt=0&as_vis=1 &oi=scholart&sa=X&ved=0ahUKEwiSubKm3fzJAhXEMKYKHXZcAyoQgQMIGTAA 14.Crowne, D.P., Marlowe, D. (1964) The approval motive. New York: Wiley.
20 16.Fein, S. B., Lin, C. J., & Levyl, A. S. (1995). Foodborne Illness: Perceptions , Experience ,
and Preventive Behaviors in the United Foodborne Illness : Perceptions , Experience , and
Preventive Behaviors in the United States. Journal of Food Protection, 58(12), 1405–1411. 17.Fishbein, M., & Ajze, I. (1975). Belief, Attitude, Intention, Behavior: An Introduction to
Theory and Research.
18.Forys, E. A., & Hevesh, A. R. (2017). Investigating Black Skimmer Chick Diets Using Citizen Science and Digital Photography. Southeastern Naturalist, 16(3), 317–325. https://doi.org/10.1656/058.016.0301
19.Gardiner, M. M., Allee, L. L., Brown, P. M. J., Losey, J. E., Roy, H. E., & Smyth, R. R. (2012). Lessons from lady beetles: Accuracy of monitoring data from US and UK citizen science programs. Frontiers in Ecology and the Environment, 10(9), 471–476.
https://doi.org/10.1890/110185
20.Griffith, C. J., & Worsfold, D. (1994). Application of HACCP to food preparation practices in domestic kitchens. Food Control, 5(3), 200–204.
https://doi.org/10.1016/0956-7135(94)90084-1
21.Hague, M. A., Warren, K. E., Hunt, M.C., Kropf, D. H., Kastner, C. L., Stroda, S. L.,
Johnson, D. E. (1994). Endpoint Temperature, Internal Cooked Color, and Expressible Juice Color Relationships in Ground Beef Patties. Journal of Food Science, 59(3), 465–470. https://doi.org/10.1111/j.1365-2621.1994.tb05539.x
food-21 handling behaviors associated with prevention of 13 foodborne illnesses. Journal of Food Protection, 66(10), 1893–9. https://doi.org/10.4315/0362-028X-66.10.1893
23.Hunt, M. C., Sørhelm, O., & Slinde, E. (1999). Color and heat denaturation of myoglobin forms in ground beef. Journal of Food Science, 64(5), 847–851.
https://doi.org/10.1111/j.1365-2621.1999.tb15925.x
24.International Food Information Council. (2016). 2016 Food and Health Survey. Retrieved from
http://www.foodinsight.org/sites/default/files/2016-Food-and-Health-Survey-Report_FINAL1.pdf
25.Jacob, C. J., & Powell, D. A. (2009). Where Does Foodborne Illness Happen—in the Home, at Foodservice, or Elsewhere—and Does It Matter? Foodborne Pathogens and Disease, 6(9), 1121–1123. https://doi.org/10.1089/fpd.2008.0256
26.Jay, L. S., Comar, D., & Govenlock, L. D. (1999). A national Australian food safety telephone survey. Journal of Food Protection, 62(8), 921–928.
27.Kendall, P. a, Elsbernd, A., Sinclair, K., Schroeder, M., Chen, G., Bergmann, V., … Medeiros, L. C. (2004). Observation versus self-report: Validation of a consumer food behavior questionnaire. Journal of Food Protection, 67(11), 2578–86. Retrieved from http://www.ncbi.nlm.nih.gov/pubmed/15553645
28.Kennedy, J., Gibney, S., Nolan, A., O’Brien, S., McMahon, M. A. S., McDowell, D., … Wall, P. G. (2011). Identification of critical points during domestic food preparation: an observational study. British Food Journal, 113(6–7), 766–783.
https://doi.org/10.1108/00070701111140106
22 refrigerators. Journal of Food Protection, 68(7), 1421–30.
https://doi.org/10.4315/0362-028X-68.7.1421
30.King, N. J., & Whyte, R. (2006). Does it look cooked? A review of factors that influence cooked meat color. Journal of Food Science, 71(4). https://doi.org/10.1111/j.1750-3841.2006.00029.x
31.KOSA, K. M., CATES, S. C., BRADLEY, S., CHAMBERS, E., & GODWIN, S. (2015). Consumer-Reported Handling of Raw Poultry Products at Home: Results from a National Survey. Journal of Food Protection, 78(1), 180–186.
https://doi.org/10.4315/0362-028X.JFP-14-231
32.Kullenberg, C., & Kasperowski, D. (2016). What is citizen science? - A scientometric meta-analysis. PLoS ONE, 11(1), 1–16. https://doi.org/10.1371/journal.pone.0147152
33.Lando, A., Verrill, L., Liu, S., & Smith, E. (2016). 2016 FDA Food Safety Survey.
34.Lewis-Beck, M., Bryman, A., & Liao, T. (2006). The SAGE Encyclopedia of Social Science Research Methods. Data Collection and Analysis.
https://doi.org/http://dx.doi.org/10.4135/9781412950589
35.Maughan, C., Chambers, E., Godwin, S., Chambers, D., Cates, S., Koppel, K. (2016). Food Handling Behaviors Observed in Consumers When Cooking Poultry and Eggs. Journal of Food Protection, 79(6), 970–977. https://doi.org/10.4315/0362-028X.JFP-15-311
36.McCurdy, S. M., Takeuchi, M. T., Edwards, Z. M., Edlefsen, M., Kang, D., Elaine Mayes, V., & Hillers, V. N. (2006). Food safety education initiative to increase consumer use of food thermometers in the United States. British Food Journal, 108(9), 775–794.
23 37.Medeiros, L. C., Hillers, V. N., Kendall, P. A., & Mason, A. (2001). Food Safety Education:
What Should We Be Teaching To Consumers? Journal of Nutrition Education, 33(2), 108– 113. https://doi.org/10.1016/S1499-4046(06)60174-7
38.Nesbitt, A., Thomas, M. K., Marshall, B., Snedeker, K., Meleta, K., Watson, B., & Bienefeld, M. (2014). Baseline for consumer food safety knowledge and behaviour in Canada. Food Control, 38(1), 157–173. https://doi.org/10.1016/j.foodcont.2013.10.010
39.Phang, H.S., & Bruhn, C. M. (2011). Burger Preparation: What Consumers Say and Do in the Home. Journal of Food Protection, 74(10), 1708–1716. https://doi.org/10.4315/0362-028X.JFP-10-417
40.Redmond, E. C., & Griffith, C. J. (2003). Consumer food handling in the home: a review of food safety studies. Journal of Food Protection, 66(1), 130–61. https://doi.org/10.4315/0362-028X-66.1.130
41.Redmond, E. C., & Griffith, C. J. (2003). A comparison and evaluation of research methods used in consumer food safety studies. International Journal of Consumer Studies, 27(1), 17– 33. https://doi.org/10.1046/j.1470-6431.2003.00283.x
42.Redmond, E. C., & Griffith, C. J. (2004). Consumer Attitudes and Perceptions Towards Microbial Food Safety in the Domestic Kitchen. Journal of Food Safety, 24(3), 169–194. https://doi.org/10.1111/j.1745-4565.2004.tb00383.x
43.Røssvoll, E., Sørheim, O., Heir, E., Møretrø, T., Olsen, N. V., & Langsrud, S. (2014). Consumer preferences, internal color and reduction of shigatoxigenic Escherichia coli in cooked hamburgers. Meat Science, 96(1), 695–703.
24 44.Scallan, E., Hoekstra, R. M., Angulo, F. J., Tauxe, R. V., Widdowson, M. A., Roy, S. L., …
Griffin, P. M. (2011). Foodborne illness acquired in the United States-Major pathogens. Emerging Infectious Diseases, 17(1), 7–15. https://doi.org/10.3201/eid1701.P11101
45.Scharff, R. L. (2012). Economic Burden from Health Losses Due to Foodborne Illness in the United States. Journal of Food Protection, 75(1), 123–131. https://doi.org/10.4315/0362-028X.JFP-11-058
46.Suzuki-Ohno, Y., Yokoyama, J., Nakashizuka, T., & Kawata, M. (2017). Utilization of photographs taken by citizens for estimating bumblebee distributions. Scientific Reports, 7(1), 1–11. https://doi.org/10.1038/s41598-017-10581-x
47.United States Department of Health and Human Services. (2010). Healthy People 2020. Retrieved from https://www.healthypeople.gov
48.United States Food and Drug Administration. (2013). Food Code 2013. Drugs. https://doi.org/10.1016/j.parint.2011.08.011
49.World Health Organization. (2015). WHO | WHO estimates of the global burden of
foodborne diseases short. Technical Report, 1–255. https://doi.org/10.1016/j.fm.2014.07.009 50.World Health Organization. (2006). Five Keys to Safer Food Manual. Five Keys to Safer
Food Manual, 30. https://doi.org/10.3390/ijerph6112833
25 CHAPTER 2
Developing a Citizen Science Method to Collect Whole Turkey Thermometer Usage Behaviors
ABSTRACT
Citizen science is a unique data collection method where non-scientists gather and interpret data in collaboration with professional scientists. The purpose of this study was to identify thermometer usage behaviors through a different process for data collection. A food safety lesson on minimum internal temperature and correct thermometer usage distributed to high school Biology in Pennsylvania and Family and Consumer Sciences in both North Carolina and Pennsylvania just prior to Thanksgiving break 2016. As homework, students inputted data into a web-based form on thermometer usage and endpoint cooking temperatures for whole turkeys. Students were asked for picture evidence of how/where the temperature of the turkey was taken. If a photo was not provided, students were asked how they knew that the turkey was “done”. Results were coded, interpreted, and compared to a broader population from the
26 thermometer usage (30%). Our data confirms that citizen science is a viable method to collect unbiased data by providing participants with tools to collect information from a primary and a photographically substantiated source of information rather than relying on self-reported data alone.
INTRODUCTION
Of the possible pathogen-food combinations, undercooked and/or poorly handled poultry ranks first for estimated annual disease burden because of its association with Campylobacter spp. and Salmonella enterica (Batz et al., 2012). In an investigation of poultry-linked outbreaks, Chai and colleagues (2016) identified food handling errors and inadequate cooking as the most common behaviors leading to poultry-associated foodborne illness. Using the United States’ Foodborne Disease Outbreak System data from 1998 to 2012, 25% of outbreaks (279 of 1114) were associated with poultry (Chai et al., 2017).
27 2015). Lastly, historic and anecdotal data on consumer preparation of holiday meals in the U.S., have resulted in seasonal-specific messages from the U.S. Centers for Disease Control and Prevention and the U.S. Department of Agriculture targeting turkey handling and cooking, as well as promoting thermometer use to determine doneness (CDC, 2016, USDA, 2015). The National Turkey Federation (NTF) (2017) estimates that 88% of Americans consume turkey at Thanksgiving, accounting for some 46 million turkeys.
Prevalence of Campylobacter and Salmonella in poultry. Campylobacter has a high prevalence in poultry products. A study conducted at two turkey processing plants over a one year period found that Campylobacter spp. were highly prevalent in carcasses at 34.9% (841 of 2412), while a survey by the Minnesota Department of Health found that 88% (80 of 91) of retail chicken products harbored Campylobacter spp. (Logue et al., 2002, Smith, 1999). Another study reported a recovery rate of Campylobacter jejuni at 98% (49 of 50) in retail grocer broiler
carcasses (Stern and Line, 1992). Zhao and colleagues (2001) assessed the prevalence of Campylobacter spp.and Salmonella serovars in retail meat and poultry products and recovered Campylobacter from 91% (84 of 92) of the samples while Salmonella was present in 3% (3 of 92) of retail samples. Mazengia et al. (2014) conducted a year-long market survey in Seattle, Washington and found that 11.3% (150 of 1,322) of chicken and turkey products were contaminated with Salmonella serovars. Yang et al. (2011)reported that the prevalence of Salmonella in raw poultry at the retail level in six provinces and two national cities was 52.2% for the 1,152 chicken carcass samples tested.
28 2008) However, only 36.9% of 4000 consumers surveyed circa 2006 cooked foods to a
temperature sufficient to kill harmful microorganisms (USDA, 2017). A U.S. national survey by Kosa and colleagues (2015) found that 62% of 1,504 consumers reported owning a food
thermometer, and that participants were more likely to use a thermometer on larger cuts of meat like whole turkeys, rather than smaller ones like ground turkey. Moreover, preparers of poultry reportedly believed that they are unlikely to become sick from eating chicken prepared within their home, believing instead that they are more likely to get sick from eating at a restaurant (Bruhn, 2014). A self-reported survey conducted by Redmond and Griffith (2003, 2004) asked consumers how much control they believed to have during food preparation with regards to food safety compared to someone else preparing their food; Respondents believed they had more control when preparing their own versus others preparing it. Consumers also underestimate the likelihood that the unsafe food-handling behaviors are associated with elevated foodborne disease risk (Redmond and Griffith, 2003, 2004). Less than 5% of 120 poultry preparers
surveyed used a thermometer to record the temperature of chicken and 40% of the ones that did, used a thermometer but cook poultry products to less than the minimum internal temperature of 165°F (Bruhn, 2014). The 2016 IFIC survey on “Food and Health” provided self-reported consumer data on food thermometer usage and safe endpoint cooking temperatures for meat and poultry products. The survey showed an increase from 49% (494 of 1,007) to 66% (662 of 1,003) between 2015 and 2016 in consumers cooking food to safe endpoint temperatures (IFIC, 2016)
29 socially undesirable ones (Kosa et al., 2015, Zerbe eand Paulhus, 1987). Consumers’
self-reported practices are different when compared to their observed behavior (Anderson et al., 2004, Jay et al., 1999). Anderson and colleagues (2004) observed participants in their homes preparing an entrée and salad followed by a food handling survey and discovered that consumers demonstrated knowledge of food safety, but it did not correspond to their behaviors when
preparing food. Jay and colleagues (1999) investigated practices in home kitchens in Melbourne, Australia, wherein participants’ food handling practices were monitored and compared to a food safety questionnaire they completed prior to being observed;significant variations were noted between stated and observed food handling practices. Due to the limitations of self-reported data, food researchers have increasingly sought alternative data collection methods, including
ethnography and observation, to provide a more accurate and robust data set (Chapman et al., 2010, Chapman et al., 2013, DeDonder et al., 2009)
Purpose of citizen science study. Citizen science can be used to collect data across a large geographic scale and over a long duration while conserving resources (Bonney et al., 2004). The goal of this study was to investigate the applicability of a citizen science approach to data collection for consumer food safety practices. Study objectives included piloting a data collection instrument, recruiting citizen scientists through high school Biology and Family and Consumer Sciences classes in Pennsylvania and North Carolina, and Biology classes in
Pennsylvania, and evaluating the utility of the resulting data.
MATERIALS AND METHODS
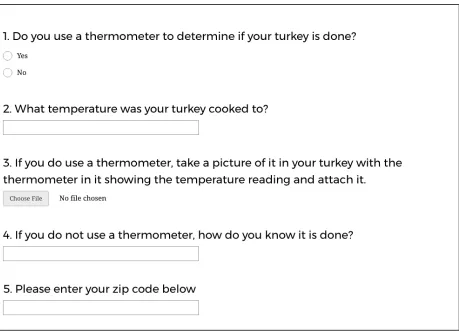
30 cooking temperatures and thermometer placement information practiced by consumers without the limitations of self-reported approaches. Citizen scientists for this study were high school students grades 9-12 in Pennsylvania and North Carolina. The survey questions (Fig. 1) asked were developed using information and recommendations in the USDA-FSIS’ Food Safety Information Sheet on Kitchen Thermometers (USDA, 2015). The resulting web-based survey was designed to be used over Thanksgiving break as a way for students to collect data on behalf of their families and the primary meal-preparers in their homes. Data were collected through the end of December 2016.
Fifty-seven high school students volunteered to complete the above-mentioned survey on thermometer usage behaviors for whole turkeys over Thanksgiving break. Volunteers for this experiment were recruited through Biology and Family and Consumer Sciences (FCS) classes at Souderton Area High School, Souderton, Pennsylvania; and Family and Consumer Sciences classes in North Carolina. FCS classes in North Carolina were e-mailed the curriculum outlined in Fig 2. containing the survey through the FCS listserv, an application that allows for
distribution of messages to subscribers on a mailing list. Souderton Area High School was recruited through partnerships and connections through previous work together. Approximately 400 students from PA and 1000 from NC were able to participate. The lesson was distributed to teachers the first week of October. The fifty-seven participants of this study make up a
convenience sample. A five-question survey was created using SurveyMonkey (San Mateo, CA) focusing on the food safety topics of thermometer usage, minimal internal endpoint cooking temperature, and indicators of doneness for whole turkeys (Fig. 1). Teachers were provided the survey as part of the lesson plan. The survey was distributed to students as a homework
31 classroom lesson. North Carolina State University’s Institutional Review Board (IRB)
determined that the survey and lesson plan were exempt from being human subject research (IRB #9491).
Recruiting citizen scientists through a high school food safety lesson. A food safety class lesson was developed using North Carolina State University’s Family and Consumer Sciences lesson template that focused on cross-contamination, the minimal internal temperature of meats, and correct thermometer usage. The template consisted of the following components: the topic; the goals and objectives; the materials needed, the grade level of the target student volunteers; the time the lesson needed to be completed by; and the activities to be completed during the lesson (Fig 1). The objectives of the lesson were for students to: i) apply previous knowledge on sanitation to new food safety principles like cross-contamination and cooking; ii) understand how and why cross-contamination can lead to foodborne illness; iii) undestand safe handling of foods through learning about the importance of thorough cooking; and iv)
32 prevention of the foodborne illness were provided to teachers to promote further discussion in class. A lecture was developed with content from USDA-FSIS’ food safety information on kitchen thermometers (USDA, 2015a). Concepts taught to students were thorough cooking to a minimum internal temperature for pathogen destruction, color as a poor indicator of doneness, and how to correctly use a thermometer.
Analyses and evaluation of data. Data collected on thermometer use through Survey Monkey was obtained as a text response, as well as a pictorial response if students stated they used a thermometer. Analyses of the survey responses were performed via Microsoft Excel Office 365 (Redmond, WA). Responses were downloaded from Survey Monkey and each one was reviewed to remove unnecessary information like survey response times and IP addresses. Responses were coded using both the text and pictures provided by participants. Some data were only obtainable through text, like indicators of doneness if a thermometer was not used, whereas other data were only obtainable through pictures, like thermometer placement in the turkey. Thermometer-type data were collected through picture, but not text. For pictures showing two thermometers in a single turkey, each thermometer was coded separately (Fig 3D). Thermometer usage and internal temperature data were obtained through text responses and verified pictures. Thermometer placement was coded for dial, digital, and glass thermometers, but not for pop-up thermometers.
RESULTS
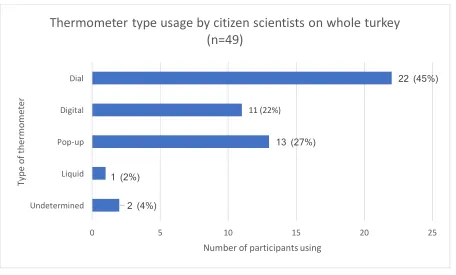
33 thermometer. Dial thermometers were defined as having a dial display and containing a probe that expands when heated up due to coils of two different metals being present (USDA, 2015a). Pop-up thermometers were used by 29% (13 of 45) of participants, sometimes in conjunction with other thermometers. Pop-up thermometers were defined as a single-use, disposable cooking device made of food grade nylon that has an inside with a stainless-steel spring and organic firing material that will spring, or “pop-up”, at a specific predetermined temperature (USDA, 2015a). No survey questions were asked on if the pop-up thermometer was inserted by the manufacturer or by the participant themselves. Some respondents answered “yes” to thermometer use but did not provide a temperature instead providing a picture of a pop-up thermometer rather than a dial, digital, or liquid. Only pictorial responses of pop-up
thermometers were coded. Digital thermometers were used by 24% (11 of 45) of meal preparers. Digital thermometers were defined as having a digital display and are thermistors, meaning it has a resistor within a temperature-sensitive tip (USDA, 2015a). One participant reported using both a digital and pop-up thermometer in their turkey, while two other participants reported using both a dial and pop-up thermometer. One participant preferred a liquid thermometer (Fig 2D), which was defined as having metal or glass stems that were filled with a colored liquid (USDA, 2015a). Thermometer type data was recorded as “undetermined” when pictures were not
accessible/attached or if a thermometer was not present in the picture.
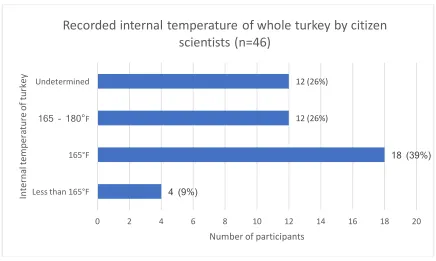
Endpoint temperatures reached by citizen scientists. A safe internal temperature was defined as 165°F, that being the recommended minimum internal temperature for turkey
34 Results were recorded as “undetermined” for the internal temperature of the turkey if: i.) the text response provided an oven temperature instead of the internal temperature of the bird, or ii.) if the picture provided was inaccessible or the temperature could not be determined by looking at the picture.
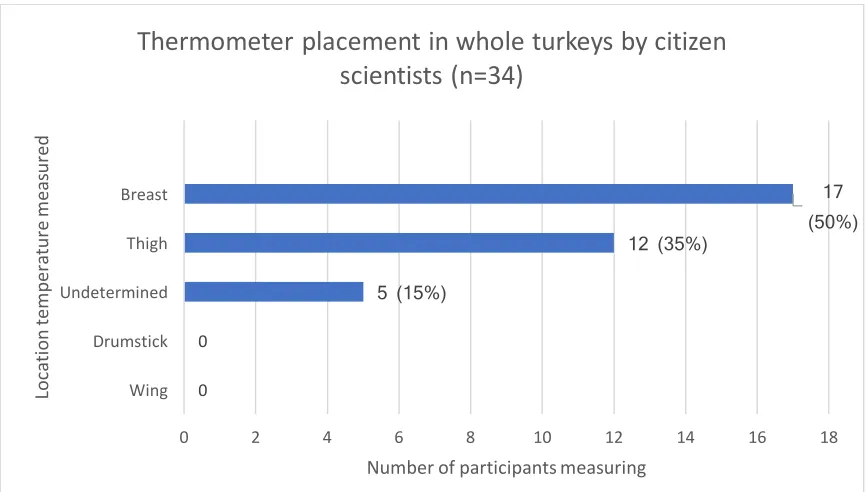
Thermometer placement in whole turkeys by citizen scientists. Participants preferred either the breast region (53%, 17 of 32) or thigh region (38%, 12 of 32) when checking the internal temperature of their turkey. No participants measured the temperature with a thermometer in the drumstick or wing region. Five samples were undetermined due to an inability to establish thermometer placement, inaccessibility of the picture or use of a pop-up thermometer solely. Fig 3. shows examples of raw data types from pictures uploaded. DISCUSSION
35 all citizen scientists received equal training. Training was not provided on the data collection instrument of the survey so certain responses to questions were unusable due to the wrong
information being provided. For example, when asking for the internal temperature of the turkey, students provided oven temperatures rather than that of the bird. Training could also benefit from clarification and specifying specific details of the question such as participants should only provide a picture of their turkey if they used a thermometer or participants should provide internal temperatures of turkeys only if it is associated with a thermometer and a picture.
Comparison of citizen scientist thermometer usage behaviors versus existing self-reported data. Participants’ thermometer usage behaviors for the citizen scientists was higher compared to studies with self-reported data (IFIC, 2016, Kosa et al., 2015). In the present study, 78.9% (n=45) of participants reported using a food thermometer through text or pictorial
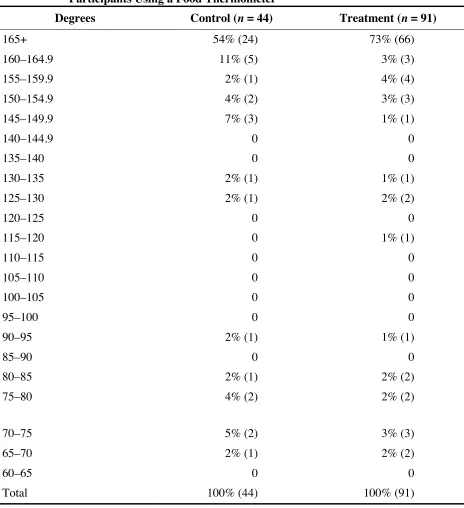
36 Thirty-four participants provided a usable temperature value through text or picture,
while twelve participants provided unusable data that was categorized as “undetermined.” Of these thirty-four participants, 66.7% (n=30) cooked their turkey to the required internal
temperature of 165°F or higher. This percentage is lower compared to IFIC’s data, in which 66% (n=1,003) of consumers cooked their meat and poultry items to the required temperature of 165°F (IFIC, 2016). Most participants correctly placed thermometers in their turkey. Only four participants (8.9%) undercooked their turkey.
Citizen scientist exposure to materials. Citizen science participants were exposed to educational materials on the importance of thermometer use; of cooking turkey to a safe internal temperature; and on correctly placing a thermometer in food. Results could be influenced by exposure to educational materials. The Theory of Planned Behavior (TPB) contains three variables: perceived behavioral control (PBC), attitudes, and subjective norms (Azjen, 1991). PBC is a person’s perception of ease or difficulty when performing an intended behavior;
attitudes are a person’s favorable or unfavorable evaluation of the behavior; and subjective norm is the perceived social pressure from the expectation of others (Azjen, 1991). Exposure to the food safety lesson provided may have influenced students’ thermometer use during
Thanksgiving. Students could develop positive or negative attitudes associated with usage from the lesson and/or be influenced by their peers’ or parent’s attitudes on thermometer use. This could have affected whether students used a thermometer or not and whether they completed the survey.
37 expertise of the contributor (Foster-Smith and Evans, 2003), although, in this study, knowledge and expertise were not specifically measured. Ratnieks and colleagues (2016)quantified the effectiveness of training methods during their data collection seeking to identify insects and flowers, and found that training method has a significant effect on accuracy of citizen science results. A limitation in our study was a lack of direct teacher training or citizen science instruction. Levels of information taught from the curriculum and training done was not contrasted between participants that were exposed to food safety material and those who were not. Some teachers used the material fully, some used it partially, and some did not use it at all. For instance, Souderton Area High School, Family and Consumer Science classes only utilized the survey and Biology classes used the lesson varyingly dependent on if a lesson on food safety was taught earlier in the year. Some teachers have a school, county or state curriculum they need to follow to prepare students for standardized tests, and this may have affected their ability to fully use the lesson as intended. The food safety lesson is heavily science-based and may fit better in a Biology class curriculum or teaching schedule rather than a Family and Consumer Sciences class.
The quality of data collected by citizen scientists is dependent on how well the data fits its purpose. Wiggins and colleagues (2011) describe this as a “multifaceted evaluation of states such as completeness, validity, consistency, precision, and accuracy”. In this study, everything from recruitment through data collection and evaluation was important to ensure that data was accurate, and the lack of complete implementation may have altered the study outcomes. Council and Horvath (2016) offer suggestions to promote citizen science recruitment such as like
38 students as citizen scientists could include social media components to gain a wider geographic range or through local partnerships that promote science communication.
Engagement with citizen science. Classroom engagement in this project involved 57 participants but may increase with a tool Council and Horvath (2016) used, where scientists researching particular topics related to the citizen science project were invited into classrooms and could directly interact with students. The importance of engagement of partnerships was noticeable when comparing participation from Souderton Area High School (45 of 57
participants) and North Carolina (12 of 57 participants). Teachers at SAHS were distributed the food safety curriculum with the help of individuals who had previous involvement with NC State’s researchers on a previous project while teachers from NC were distributed the lesson through a listserv of two-hundred plus classes where no follow-up was done.
Response Rates and Comparison of Data. The recruitment process allowed for over 1,400 high school students to be reached in both PA and NC; however, the study only had 57 participants. Although the citizen science and existing data on thermometer use are discussed above, the low response rate and the potential exposure to a lesson plan on food safety makes it difficult to make direct comparisons.
41
Cross-contamination
and Cooking
Temperatures
Figure 2-1 (continued).
Grade Level(s): 9-12 Program Topic:
Food Safety: Cross-contamination and Cooking temperatures
Timeframe: Before Thanksgiving
FCCLA National Program(s): Prepared By: Dr. Benjamin Chapman and Minh Duong
Goals & Objectives
(Specify skills/information that will be learned.)
• Students will be able to apply previous knowledge on sanitation to new food safety principles of cross-contamination and cooking temperatures
• Students will be able to understand why cross-contamination can lead to foodborne illnesses
• Students will be able to practice safe handling of foods through learning the importance of thorough cooking
• Students will be able to differentiate between safe and unsafe cooked foods
National/State FACS Standards Addressed, Career Clusters or Pathways
What standards does this lesson satisfy?
Materials Needed
• Paper
• Pencil
• Camera
42 Figure 2-1 (continued).
Anticipatory Set
(Introduce lesson topic, grab student’s attention, and activate prior knowledge)
Students have already been exposed to prior concepts like handwashing to spread germs. Hone in on this idea and use it as a bridge into your
conversation on cooking temperatures. Students will watch a YouTube video from Giada de Laurentiis’s cooking show (https://youtu.be/-caQEzeEuyo .)
Ask the class to focus on what possible cross-contamination is occurring, incidents of possible temperature abuse, and what surfaces need to be sanitized.
Possible cross-contamination
-Starts at beginning with not washing hands after usage of eggs. From there, every surface she touches has a potential to be contaminated.
-These surfaces include the pantry handles, the knife, olive oil bottle, stove burner, salt and pepper, refrigerator handle, milk bottle, cheese, pepper, sausage, parsley and baking dish
Surfaces that need to be sanitized
-All of the following surfaces she touched above are in consideration for sanitation. Additionally, when she puts whisk down on the counter before adding cheese (5:10)
Incidents of temperature possible abuse
-Using color as an indicator for the sausage
-Using time and temperature as indicators of doneness in the baked omelet
Points to emphasize here are: washing of hands after usage, cross-contamination, and usage of a thermometer
Activity 1
(Describe the independent activity to reinforce this lesson)
Students will be asked to answer a writing exercise on “Have you ever been affected by foodborne illness?” and then they will discuss as a class their answers.
Probing questions for students choosing to share are:
1. What were the symptoms and how did it affect them?
2. Where was it from? (What type of food? What microorganism if they know)
43 Activity 2
(Describe the independent
activity to reinforce this lesson)
During the lecture, the focus given should be on the following: thorough cooking of food and correct thermometer usage.
Thorough cooking of food
For thorough cooking of food, emphasize the importance of cooking thoroughly to a minimum internal temperature to kill off harmful bacteria and have good quality food. Here, you can bring the temperature danger zone into the lesson and talk about why it is important to keep food out this temperature range (food kept out will have all pathogens either killed off or inactivated since the range for bacteria to grow the best falls in this zone.)
You may also discuss color vs. time vs. temperature as an indicator here. Discuss the common perceptions associated with clear running juices and looking at the color of the meat to determine doneness OR the idea that baking a turkey for “X” hours does not necessarily mean it is cooked thoroughly and the only way to know is using a thermometer.
*Good points to bring up: Research has been done regarding juices running clear. When juices run clear, the turkey is often overcooked. Another point of emphasis is 1 in 4 burgers will turn brown before they are fully done on the inside
Correct thermometer usage
-Correct readings can be done only if the temperature is taken in the thickest part of the meat that is not touching the directly
-Each food is different for the minimum temperature that it is needed to be cooked to. For turkeys, it is 165 degrees Fahrenheit; readings can be taken from three locations: innermost part of the thigh, the innermost part of the wing, and the thickest part of the breast.
At the end of the lecture, a video provided by the FSIS on cooking to the minimum temperature and thermometer use will be shown through YouTube (https://youtu.be/-2KkV2yFiN0 .)
In this video, focus on the points mentioned earlier about how to know if food is correctly done and what types of false indicators exist for doneness as well as how to correct insert a thermometer.
Summary/Evaluation
(Assign Homework, or Reflect
on the Outcomes)
Students will be asked to take time over Thanksgiving break to reflect on what they’ve learned and apply this knowledge to a worksheet on thermometer usage. Questions will be asked on whether they use a thermometer on the turkey or not and if they do not, how do they determine the turkey is done.
Source/Other Resources (If Applicable then required to cite any published or
copyrighted materials used in this lesson plan)
Images were used from https://www.fsis.usda.gov/
Videos used were from “The Food Network” and FSIS’s YouTube channel
https://youtu.be/-caQEzeEuyo (Food Network) https://youtu.be/-2KkV2yFiN0 (FSIS)
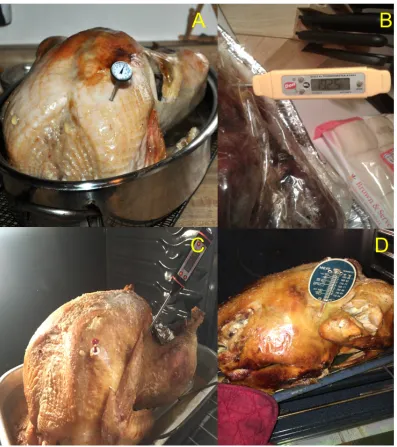
45 Figure 2-3. Representative pictures provided by data collectors.
(A) is a dial thermometer that measured the specific temperature of the turkey at the breast region. (B) is an example of a digital thermometer that measured a specific temperature; however, the specific measurement region here was not discernable. (C) is an example of two
46 Figure 2.4. Thermometer type usage by citizen scientists on whole turkey.
2 (4%) 1 (2%)
13 (27%)
11 (22%)
22 (45%)
0 5 10 15 20 25
Undetermined Liquid Pop-up Digital Dial
Number of participants using
Ty
pe
o
f t
he
rm
om
et
er
47
Figure 2.5. Thermometer recorded internal temperature of whole turkey by citizen scientists.
4 (9%)
18 (39%)
12 (26%) 12 (26%)
0 2 4 6 8 10 12 14 16 18 20
Less than 165°F 165°F 165 - 180°F Undetermined
Number of participants
In
te
rn
al
te
m
pe
ra
tu
re
o
f t
ur
ke
y
48 Figure 2.6. Thermometer placement in whole turkeys by citizen scientists.
0 0
5 (15%)
12 (35%)
17 (50%)
0 2 4 6 8 10 12 14 16 18
Wing Drumstick Undetermined Thigh Breast
Number of participants measuring
Lo
ca
tio
n
te
m
pe
ra
tu
re
m
ea
su
re
d
49 REFERENCES
1. Ajzen, I. 1991. The theory of planned behavior. Organ. Behav. Hum. Decis. Process 50:179-211.
2. Anderson, J. B., T. A. Shuster, K. E. Hansen, A. S. Levy, and A. Volk. 2004. A camera’s view of consumer food-handling behaviors. J. Am. Diet. Assoc. 104:186–191.
3. Batz, M. B., S. Hoffmann, and J. G. Morris. 2012. Ranking the disease burden of 14 pathogens in food sources in the United States using attribution data from outbreak investigations and expert elicitation. J. Food Prot. 75:1278-1291.
4. Bonney, R., J. L. Shirk, T. B. Phillips, A. Wiggins, H. L. Ballard, A. J. Miller-Rushing, and J. K. Parrish. 2014. Citizen science: next steps for citizen science. Sci. 343:1436–1437. 5. Brewer, M. S., and M. Rojas. 2008. Consumer attitudes toward issues in food safety. J. Food
Saf. 28:1-22.
6. Bryan, F. L., McKinley, T., & Mixon, B. (1971). Use of Time-Temperature Evaluations in Detecting the Responsible Vehicle and Contributing Factors of. Milk and Food Technology, 34(12), 576–582.
7. Bruhn, C. 2014. Chicken preparation in the home: an observational study. Food Prot. Trends 34:318–330. Available at: http://www.foodprotection.org/files/food-protection-trends/Sep-Oct-14-Bruhn.pdf. Accessed 13 September, 2017.