A SIMULATION STUDY OF QUASI-FIXATION OF GENES DUE TO RANDOM FLUCTUATION O F
SELECTION INTENSITIES
J. S. F. BARKER AND J. C. BUTCHER‘
Departments of Animal Husbandry and Applied Mathematics. University of Sydney, Sydney, Australia
Received September 20, 1965
K I M U R A (1954) investigated the process of change in the gene frequency distribution due to random fluctuation of selection intensities. Assuming a pair of alleles lacking dominance, and the selection coefficient (s) fluctuating from generation to generation around a mean value of zero, where s equals the selection coefficient against the heterozygote (i.e. heterozygote fitness = 1
-
s, disadvantageous homozygote fitness = 1 - 2s), he showed that the gene fre-quency distribution will accumulate toward the terminal values of 0 or 1 with increasing time. However, the probability at these terminal values was always zero. That is, given sufficient generations, almost all populations will have the gene either almost fixed in the population or almost lost from it. To describe this phenomenon,
KIMURA
proposed the terms quasi-fixation and quasi-loss.KIMURA
(1955) pointed out that only forS
= 0 could the equations be solved in closed form, but he discussed briefly other cases. In particular, he asked if S and V , (the variance of the selection coefficient) are of the same order of magnitude,or
s
( > 0) is much smaller than V,, is quasi-fixation of the disadvantageous allele possible? He argued that if the initial gene frequency of the advantageous allele is very low, this latter situation might allow some probability of quasi-fixationof the disadvantageous allele.
TO answer these questions more definitively, a Monte Carlo type programme was developed for the University of Sydney automatic computer (SILLIAC), and results obtained using this programme are presented in this paper.
However,
KIMURA
( 1962) has extended his earlier theoretical investigations in developing a more general formula for the probability of eventual fixation, which allows for random drift because of small population number, and also for that due to random fluctuations in selection intensity. Further, he could then solve for cases other than S = 0, so that he was then able to answer his question relating to the probability of quasi-fixation of the disadvantageous allele. Results presented here are of interest in confirmingKIMURA’S
theoretical analysis, and in providing information on the time required for the quasi-fixation process.Present address: Stanford Linear Accelerator Center, Stanford, California, U.S.A.
262 J. S. F. BARKER A N D J. C. B U T C H E R
Operations of the Programme
Given the initial gene frequency (x,) in each of IO00 populations (assumed infinitely large), the programme takes these through any specified number of generations operating on each i n each generation with a selection coefficient sampled uniformly in the interval (a - (3V,) %,
5
+
(3V,) %), so that the mean and variance of the selection coefficient will agree with the given 5 and V,. At any specified generation, the gene-frequency distribution can be printed out as the number of populations whose gene frequency falls within each of 190 specified gene- frequency ranges. As we are more interested in the distributions towards the termini, these ranges are not equally spaced, but become progressively narrower from the centre of the distribu- tion towards each terminus. Thus the ranges are of width 10-1 from 0.1 to 0.9, 10-2 from 0.01 to 0.1 and from 0.9 to 0.99, 10-3 from 0.001 to 0.01 and from 0.99 to 0.999, and so on to a width ofTogether with this distribution, the programme output gives the numbers of populations with gene frequency greater than z,, and less than x,, and the mean gene frequencies of these, as well as the overall mean gene frequency.
with two terminal classes O t o le11 and 1 - 10-11 to 1.
Test of the Programme
To test the programme, parameters the same as those investigated by KIMURA (1954) were used, uiz.: xo = 0.5, s = 0, V , = 0.0483, with the distribution printed out for generations IO,
28, 40, and 100. The numbers in each frequency range were tested against those expected from solution of Equation (5) of KIMURA (1954). using the chi-squared test. The distributions for each of the four generations were not significantly different.
If for two computer runs, the ratio 5 : V , were constant, but both were some fraction (a) in the second run of their value in the first, one would expect (KIMURA 1955) that the gene- frequency distribution after t generations in the first would be the same as in the second after
t / a generations. The programme was tested to see that it satisfied this condition as follows: Run 1: x, = 0.5, 3 = 0.05, V , = 0.3125, t = 1,2,3,4, 5, and 10 generations;
Run 2: x, = 0.5,5 = 0.025, V , = 0.15625, t = 2,4, 6,8, IO, and 20 generations.
The distributions for the consecutive pairs of generations were compared using the chi- squared test, and were not significantly different, except for the first pair, where x2(,) = 36.84, P
<
0.001. In this first pair, although the distributions in the two runs were in fact different, both correspond to the same Fokker-Planck equation, which is an approximation to the genetic model in which we are interested. The agreement as the number of generations increased is a p parently due to the fact that the approximations are better in these cases. As we are interested in the form of the distributions after many generations, this difference was not considered im- portantRESULTS A N D DISCUSSION
KIMURA (1962) presents an equation for the probability of quasi-fixation of
the desirable allele, in terms of its initial frequency (z,), and a parameter
k
(= 2F/V,). These probabilities are given in Table 1 for a range of values of zo and
k.
For a particular value ofk (
<
1 .O), the probability of quasi-fixation of the desirable allele increases as its initial frequency increases. For a particular value of z,, and constants,
the probability of quasi-fixation increases ask
increases (i.e. as V , decreases).S I M U L A T I O N O F QUASI-FIXATION 263
TABLE 1
Probabilities of fixation of the desirable allele for various ualues of xo (its initial frequency) and k (2S/V,) (Solution of equation 19 of Kimura 1962)
k 0.01
0.1 0.2 0.3 0.4 0.5 0.6 0.7 0.8 0.9 1
.o
,01731 ,02935 ,04876 ,07947 ,12711 ,19957 ,30753 ,46491 ,68902 1
.ooooo
0.1 .I3692 ,18364 ,24158 ,31200 ,39582 ,49345 ,60458 .72793 ,86102 1
.ooooo
xo 0.5 ,56908 ,63674 .70163 ,76251 ,81831 ,86818 ,91151 ,94794 ,97739 1
.ooooo
0.9 ,92858 ,95025 .96632 .97795 .98615 ,991 77 ,99548 ,99783 ,99923 1 .00000 0.99 ,99435 ,99689 ,99834 ,99914 ,99957 ,99980 .99991 .99997 9 9 9 9 1
.ooooo
used in a series of “experiments,”
k
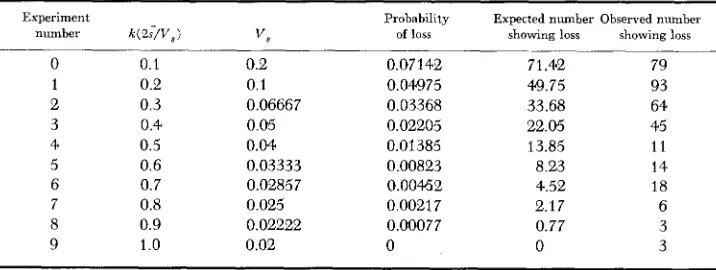
being varied by varying V , (values given in Table 2 ) . Each experiment was continued at least until the gene frequency in all populations was either less than 0.001 or greater than 0.999. Two experiments were run for a further 200 generations, but as no population with frequency less than 0.001 increased above this, these values were taken as convenient end points. The numbers of populations showing such quasi-loss, together with the num- bers theoretically expected, are given in Table 2. Generally, the observed num- ber was greater than that expected. The distributions of gene frequencies were output every 20 generations to generation 420, then for generation 450, and thereafter, every 25 generations, so that changes in the number tending to quasi- loss can be followed (Table 3 ) . It is difficult to account for the observed quasi-loss being higher than that expected. Over all generations, it is unlikely that the actual mean selection coefficient would be less than that specified. However, ifTABLE 2
Expected probabilities of loss of the desirable allele (from Table 1 ) . and expected and observed numbers of populations (of 1000 in each experiment) showing such loss,
where xo = 0.9 and 3 = 0.01
E:xperiment Probability Expected number Observed number
number k ( 2 ; / V , 1 vs of loss showing loss showing loss
0 1 2 3 4 5 6 7 8 9 0.1 0.2 0.3 0.4 0.5 0.6 0.7 0.8 0.9 1
.o
264 J. S. F. BARKER A N D J. C . BUTCHER
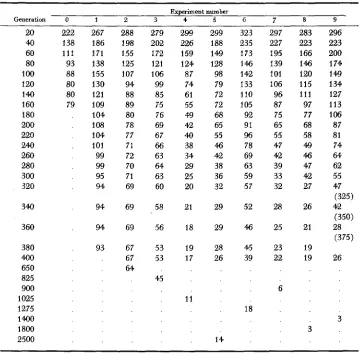
TABLE 3
Number of populations with gene frequency less than initial frequency (x, = 0.9), and final number tending to quasi-loss, with generation after which this number remains stable
~ ~~~~~~~~~ ~
Experiment number
Generation 0 1 2 3 4 5 6 7 8 9
U) 222
40 138
60 111
80 93
100 88
120 80
I40 80
160 79
180 200 220 240 260 280 300 320 340 360 380 400 650 825 900 1 025
1275 14QO 1800 2500 267 186 171 138 155 130 121 109 104 I08 104 101 99 99 95 94 94 94 93 288 1 98 155 125 107 94 88 89 80 78 77 71 72 70 71 69 69 69 67 67 64 279 202 172 121 106 99 a5 75 76 69 67 66 63 64 63 60 58 56 53 53 45 299 226 159 124 87 74 61 55 49 42 40 38 34 29 25 20 21 18 19 17 11 299 188 149 128 98 79 72 72 68 65 55 46 42 38 36 32 29 29 28 26 14 323 235 173 146 1 42 133 110 1 05 92 91 96 78 69 63 59 57 52 46 45 39 18 297 227 195 139 101 106 96 87 75 65 55 47 42 39 33 32 223 25 23 22 6 283 223 166 146 120 115 111 97 77 68 58 49 46 47 42 27 26 21 19 19 3 296 223 200 174 149 134 127 113 106 a7 81 74 64 62 55 47 (325) 42 (350) 28 (375) 26 3
over a small number of generations a greater than expected number of frequen- cies drift to less than 0.5, they will tend to continue towards zero. That this may partly account for the observed excess of quasi-loss is shown in Figure 1, which gives the numbers of frequencies less than zo for two experiments where observed and expected were similar (Nos. 0 and 4), and two where they were more dis- crepant (Nos. 1 and 6 ) . It will be seen that for the former there was generally a steady decline to the final stable value. However, for the latter there were pe- riods where the number remained fairly steady or actually increased (e.g. EX-
periment 1-generations 80 to 100, Experiment 6-generations 200-220). A
SIMULATION O F QUASI-FIXATION 265
periment 1. If z, were less than 0.5, the probability of fixation of the undesirable allele then might be less than that predicted from
KIMURA’S
equation. One ex- periment was done, using the same parameters as for Experiment 1, but withz, = 0. I . The expected number of populations showing fixation of the undersirable
allele (from Table 1) is then 816, while the number observed was 815. I n itself,
this
is hardly critical evidence, but it seems likely that the discrepancies between observed and expected probabilities of quasi-loss are the result of stochastic effects in the populations when the gene frequency is around 0.5.The number of generations to final stability of quasi-loss is given in Table 3. As might be expected, this number of generations generally increased as
V ,
de- creased (i.e., ask
increased). For Experiments l to 4 inclusive, the relationship between number of generations andk
is linear, but the number of generations to stability in the remaining experiments deviate markedly from this linear rela- tionship. Some of the exceptions to the trend, such as Experiment 5, are of in- terest. Here, the number of frequencies less than z, was 1 7 in Generation 925, three of which were between 0.01 and 0.9. These three eventually tended toquasi-fixation, one becoming greater than 0.9 by Generation 1250, one by Gen- eration 1800, and the last by Generation 2500. Thus, with randomly fluctuating selection intensity, the gene frequency may drift over intermediate values for long periods of time, producing an apparent, but unstable polymorphism.
266 J. S. F. BARKER A N D J. C. B U T C H E R
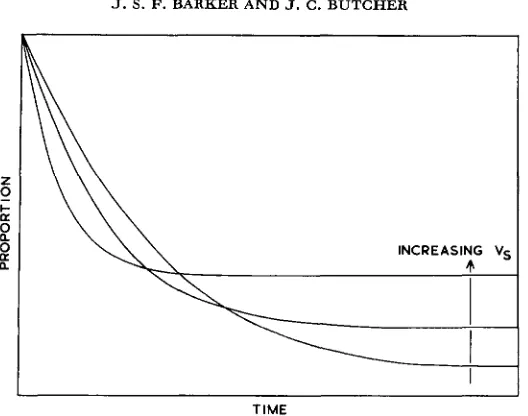
TIME
FIGURE 2.-Expected pattern oE changes in the proportion of populations with frequencies less than zo for varying values of V,.
tion sizes. Since random sampling of gametes is important near the terminal classes even for large population sizes, this does not necessarily reflect the proba- bility of fixation, but is a reasonable definition of quasi-fixation. Thus, in the computer simulation experiments, gene frequencies greater than 0.9999 and 0,99999 respectively imply quasi-fixation for population sizes of 5,000 and
50,000. These probabilities of quasi-fixation can be obtained from the gene- frequency distribution output, and results for Experiments 1, 3, and 7 are given in Figure 3. Progress towards quasi-fixation was more rapid, but its ultimate probability was less, as V , increased.
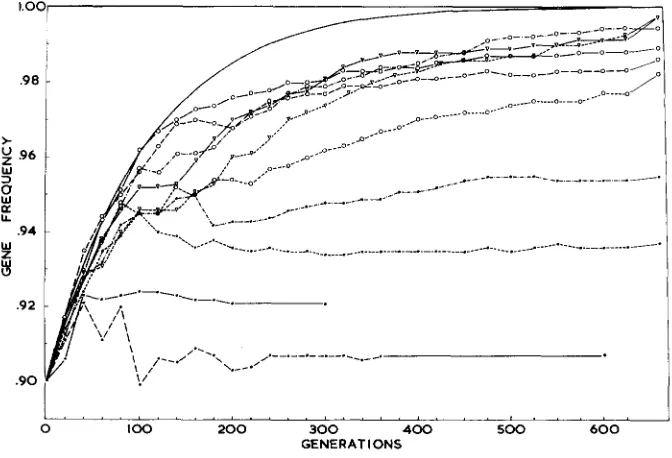
Changes in the mean gene frequency of the desirable allele for those popula- tions with frequency less than zo, and for all populations, are shown in Figures
SIMULATION O F QUASI-FIXATION 26 7
GENERATIONS
FIGURE 4.-Changes, with time, in the mean gene frequency of the desirable allele for those populations with frequency less than zo.
4
and 5 . I n Figure4,
a difference in the trend of change to quasi-loss is apparent between the experiments where V , was highest (0, 1,2, and 3), and the remain- ing experiments, whereas one might expect something resembling a family ofI . I . . I . . . . , . . . . , . . , , , . , , , , , , , ,
0 1 0 0 2 0 0 3 0 0 4 0 0 5 0 0 6 0 0
GENERATIONS
268 J. S. F. BARKER A N D J. C. B U T C H E R
negative exponential curves. No explanation for this apparent difference has been found, but if it is real, and not simply a product of stochastic variation in
the present series of experiments, it would repay further theoretical investiga- tions. A further difference between these two sets of experiments is seen in Figure
5.
Whereas mean gene frequency in Experiments 4 to 9 shows a relatively steady increase from xo to the final value, in Experiments 0, 1 and 2 it tends to increase to a maximum, and then decrease to the final value. Experiment 3 is intennedi- ate, in that it increases to somewhat less than the final value and then decreases before steadily increasing to the final value. Clearly, the difference in trend is mainly due to the rate of movement of the distribution towards the termini (Fig- ure 4), but there is again the apparent break at a value ofk
of about 0.4.This study was supported by a University of Sydney Research Grant to J.S.F.B.
S U M M A R Y
A Monte Carlo computer programme has been developed to investigate quasi- fixation of genes due to random fluctuation of selection intensities. Starting with the gene frequency of the desirable allele = 0.9, and a constant mean selection coefficient = 0.01, ten simulation experiments have been done with the variance of the selection coefficient (V,) ranging from 0.02 to 0.2. In terms of the proba- bility of quasi-loss of the desirable allele, the results confirm the theoretical ex- pectations of KIMURA (1962), although the observed probabilities were generally somewhat higher than the expected. The number of generations to final stability of quasi-loss tended to increase as
k
(= 2$/7/,) increased, and could be expected to be at least 1000 for 0.5<
k
<
1 .O. A difference in the trend of change to quasi- loss is apparent between those experiments wherek <
0.5, and those wherek
>
0.5. If real, this would repay further theoretical investigation.LITERATURE CITED
KIMURA, M., 1954 Process leading to quasi-fixation of genes in natural populations due to ran-
dom fluctuation in selection intensities. Genetics 39: 280-295. __ . 1955 Stochastic
processes and distribution of gene frequencies under natural selection. Cold Spring Harbor
Symp. Quant. Biol. 20: 33-53.