Title
Pan-tropical prediction of forest structure from the largest trees Short Title header
Pan-tropical forest structure from the largest trees Authors
Jean-François Bastin1,2,3,4, Ervan Rutishauser4,5,James R.Kellner6,7, Sassan Saatchi8, Raphael Pélissier9, Bruno Hérault10,11,Ferry Slik12, Jan Bogaert13, Charles De Cannière2, Andrew R. Marshall14,15,16, John Poulsen17, Patricia Alvarez-Loyayza18, Ana Andrade19, Albert Angbonga-Basia20, Alejandro Araujo-Murakami21, Luzmila Arroyo22, Narayanan Ayyappan23,24, Celso Paulo de Azevedo25, Olaf Banki26, Nicolas Barbier9, Jorcely G. Barroso26, Hans
Beeckman27, Robert Bitariho28, Pascal Boeckx29, Katrin Boehning-Gaese30,31, Hilandia
Brandão32, Francis Q.Brearley33, Mireille Breuer Ndoundou Hockemba34, Roel Brienen35, Jose Luis C.Camargo19, Sto36, Benoit Cassart37,38, Jérôme Chave39, Robin Chazdon40, Georges Chuyong41, David B.Clark42, Connie J.Clark17, Richard Condit43, Euridice N. Honorio Coronado44, Priya Davidar22,Thalès de Haulleville13,27, Laurent Descroix45,Jean-Louis Doucet13,Aurelie Dourdain46,Vincent Droissart9,Thomas Duncan47, Javier Silva Espejo48, Santiago Espinosa49,Nina Farwig50,Adeline Fayolle13, Ted R. Feldpausch51, Antonio Ferraz8, Christine Fletcher36,Krisna Gajapersad52, Jean-François Gillet13, Iêda Leão do Amaral32, Christelle Gonmadje53, James Grogan54, David Harris55,Sebastian K.Herzog56, Jürgen Homeier57, Wannes Hubau27, Stephen P. Hubbell58,5, Koen Hufkens29, Johanna Hurtado59, Narcisse.G.Kamdem60, Elizabeth Kearsley61, David Kenfack62, Michael Kessler63, Nicolas Labrière10,64, Yves Laumonier10,65, Susan Laurance66, William F.Laurance66, Simon L. Lewis35, Moses B. Libalah60, Gauthier Ligot13, Jon Lloyd67,68, Thomas E. Lovejoy68, Yadvinder
Malhi69, Beatriz S. Marimon70, Ben Hur Marimon Junior70, Emmanuel H.Martin71, Paulus Matius72, Victoria Meyer8, Casimero Mendoza Bautista73, Abel Monteagudo-Mendoza74, Arafat Mtui75, David Neill76, Germaine Alexander Parada Gutierrez77, Guido Pardo78,Marc Parren79, N. Parthasarathy23,Oliver L. Phillips35, Nigel C.A. Pitman79, Pierre Ploton9,Quentin Ponette37, B.R.Ramesh23, Jean-Claude Razafimahaimodison80,Maxime Réjou-Méchain9, 1
Samir Gonçalves Rolim81, Hugo Romero Saltos82, Luiz Marcelo Brum Rossi81, Wilson
Roberto Spironello32, Francesco Rovero75, Philippe Saner83, Denise Sasaki84, Mark Schulze85, Marcos Silveira86, James Singh87, Plinio Sist10,88, Bonaventure Sonke60,J.Daniel Soto89, Cintia Rodrigues de Souza24, Juliana Stropp90, Martin J.P. Sullivan35, Ben Swanepoel34, Hans ter Steege25,91,John Terborgh92,93,Nicolas Texier94, Takeshi Toma95, Renato Valencia96, Luis Valenzuela74, Leandro Valle Ferreira97, Fernando Cornejo Valverde98, Tinde R Van Andel25,Rodolfo Vasque76, Hans Verbeeck61,Pandi Vivek22,Jason Vleminckx99, Vincent A.Vos78,100, Fabien H.Wagner101, Warsudi102,Verginia Wortel103, Roderick J. Zagt104,Donatien Zebaze60
1. Institute of Integrative Biology, Department of Environmental Systems Science, ETH Zürich, 8092 Zürich, Switzerland
2. Landscape Ecology and Plant Production System, Université libre de Bruxelles. CP264-2, B-1050 Bruxelles, Belgium
3. Affiliated during analysis and writing at NASA, Jet Propulsion Laboratory, California Institute of Technology, 4800 Oak Grove Drive, Pasadena, CA 91109, USA
4. Carboforexpert (carboforexpert.ch), 1248 Hermance, Switzerland
5. Smithsonian Tropical Research Institute, Box 0843-03092, Balboa, Ancon, Panama
6. Department of Ecology and Evolutionary Biology, Brown University, Providence, RI 02912, USA
7. Institute at Brown for Environment and Society, Brown University, Providence, RI 02912, USA
8. NASA, Jet Propulsion Laboratory, California Institute of Technology, 4800 Oak Grove Drive, Pasadena, CA 91109, USA
9. AMAP Lab, IRD, CIRAD, CNRS, INRA, Univ. Montpellier, Montpellier, France
10. Cirad, UR Forest & Societies, 34398 Montpellier Cedex 5, France 29
30 31 32 33 34 35 36 37
38 39
40 41
42 43
44
45
46 47
48 49
50 51
52
11. INPHB (Institut National Polytechnique Félix Houphouet Boigny), Yamoussoukro, Ivory Coast
12. Faculty of Science, Universiti Brunei Darusallam, Gadong, BE1410, Brunei Darussalam
13. Gembloux Agro-Bio Tech, Université de Liège, B-5030 Gembloux, Belgium
14. CIRCLE, Environment Department, Wentworth Way, University of York, Heslington, York, YO10 5NG, UK
15. Tropical Forests and People Research Centre, University of the Sunshine Coast, QLD 4556, Australia
16. Flamingo Land Ltd., Kirby Misperton, YO17 6UX, UK
17. Nicholas School of the Environment, Duke University, PO Box 90328, Durham, NC 27708, USA
18. Field Museum of Natural History, Chicago, USA.
19. Biological Dynamics of Forest Fragment Project (BDFFP - INPA/STRI), Manaus - Amazonas, Brazil
20. Institut Facultaire des Sciences Agronomiques de Yangambi. DRC
21. Museo de Historia Natural Noel Kempff Mercado, Santa Cruz, Bolivia
22. Department of Ecology and Environmental Sciences, Pondicherry University, Kalapet, Pondicherry 605014, India
23. French Institute of Pondicherry (IFP), 11 Saint Louis Street, Pondicherry 605 001, India
24. Embrapa Amazônia Ocidental, Brazil
25. Naturalis Biodiversity Centre, PO Box 9517, 2300 RA Leiden, The Netherlands 54
55
56 57
58
59 60
61 62
63
64 65
66
67 68
69
70
71 72
73 74
75
26. Universidade Federal do Acre, Campus Floresta, Cruzeiro do Sul, Acre, Brazil
27. Service of Wood Biology, Royal Museum for Central Africa, Tervuren, Belgium
28. Institute of Tropical Forest Conservation, Mbarara University of Science and Technology, Uganda.
29. Isotope Bioscience Laboratory – ISOFYS, Ghent University, Belgium
30. Senckenberg Biodiversity and Climate Research Centre (BiK-F), Frankfurt am Main, Germany
31. Dept of Biological Sciences, Goethe Universität, Frankfurt am Main, Germany
32. National Institute for Amazonian Research (INPA), Manaus, Amazonas, Brazil
33. School of Science and the Environment, Manchester Metropolitan University, Chester Street, Manchester, M1 5GD, UK
34. Wildlife Conservation Society, New York, USA
35. School of Geography, University of Leeds, Leeds, UK
36. Malaysia Campus, Jalan Broga, Semenyih 43500, Selangor, Malaysia
37. UCL-ELI, Earth and Life Institute, Université catholique de Louvain, Louvain-la-Neuve BE-1348, Belgium
38. Ecole Régionale Post-universitaire d’Aménagement et de Gestion Intégrés des Forêts et Territoires Tropicaux, Kinshasa, DRC
39. Laboratoire Evolution et Diversité biologique, CNRS & Université Paul Sabatier, Toulouse 31062, France
40. Department of Ecology and Evolutionary Biology, University of Connecticut, Storrs, Connecticut 06268-3043, USA
41. Department of Botany and Plant Physiology, University of Buea, Cameroon 77
78
79 80
81
82 83
84
85
86 87
88
89
90
91 92
93 94
95 96
97 98
42. Department of Biology, University of Missouri-St Louis, Missouri, USA
43. Field Museum of Natural History and Morton Arboretum, Illinois, USA
44. Coronado, Inst. de Investigaciones de la Amazonia Peruana, Iquitos, Peru
45. ONF pôle R&D, Cayenne, France
46. Cirad, UMR EcoFoG (AgroParisTech, CNRS, Inra, Universite des Antilles, Universite de la Guyane), Kourou, French Guiana
47. Department of Botany and Plant Pathology, Oregon State University, Corvallis, OR 97331, USA
48. Departamento de Biología, Universidad de La Serena, Casilla 554 La Serena, Chile
49. Universidad Autónoma de San Luis Potosí, San Luis Potosí, México
50. Department of Conservation Ecology, Philipps-Universität Marburg, Karl-von-Frisch-Straße 8, 35032 Marburg, Germany
51. Geography, College of Life and Environmental Sciences, University of Exeter, Exeter, EX4 4RJ, UK
52. Conservation International Suriname, Paramaribo, Suriname
53. Department of Plant Biology, Faculty of science, University of Yaounde I, BP 812 Yaoundé, Cameroon
54. Smith College Botanic Garden, Northampton, MA 01063, USA
55. Royal Botanic Garden Edinburgh, Edinburgh EH3 5LR, UK
56. Museo de Historia Natural Alcide d’Orbigny, Cochabamba, Bolivia
57. Plant Ecology, University of Goettingen, Untere Karspuele 2, 37073 Goettingen, Germany
100
101
102
103
104 105
106 107
108
109
110 111
112 113
114
115 116
117
118
119
58. Department of Ecology and Evolutionary Biology, University of California, Los Angeles, California 90095, USA
59. Organization for Tropical Studies, Costa Rica
60. Plant Systematic and Ecology Laboratory, Higher Teacher’s Training College, University of Yaoundé I, P.O. Box 047, Yaoundé, Cameroon.
61. CAVElab – Computational and Applied Vegetation Ecology, Ghent University, Belgium
62. CTFS-ForestGEO, Smithsonian Tropical Research Institute, MRC 166, NMNH, P.O. Box 37012, Washington, DC 20013-7012, USA
63. Department of Systematic and Evolutionary Botany, University of Zurich, Zollikerstrasse 107, Zurich 8008, Switzerland
64. AgroParisTech, Doctoral School ABIES, 19 Avenue du Maine, 75732 Paris Cedex 15, France
65. Center for International Forestry Research, Jl. CIFOR, Situ Gede, Bogor Barat 16115, Indonesia
66. Centre for Tropical Environmental and Sustainability Science, College of Science and Engineering, James Cook University, Cairns, Queensland 4870, Australia.
67. Department of Life Sciences, Imperial College London, SL5 7PY, Ascot, UK
68. Department of Environmental Science and Policy, George Mason University, Fairfax, VA, USA
69. Environmental Change Institute, School of Geography and the Environment, University of Oxford, Oxford, UK
70. Universidade do Estado de Mato Grosso, Campus de Nova Xavantina, Nova Xavantina, MT, Brazil
122 123
124
125 126
127 128
129 130
131 132
133 134
135 136
137 138
139
140 141
142 143
71. Udzungwa Ecological Monitoring Centre, Udzungwa Mountains National Park, Tanzania, Sokoine University of Agriculture, Morogoro, Tanzania
72. Faculty of Forestry, Mulawarman University, Indonesia
73. Escuela de Ciencias Forestales, Unidad Académica del Trópico, Universidad Mayor de San Simón, Sacta, Bolivia
74. Jardín Botánico de Missouri, Oxapampa, Pasco, Peru.
75. MUSE - Museo delle Scienze, Trento, Italy
76. Universidad Estatal Amazónica, Puyo, Pastaza, Ecuador
77. Museo de Historia Natural Noel Kempff Mercado, Santa Cruz, Bolivia
78. Universidad Autónoma del Beni, Riberalta, Bolivia
79. Science and Education, The Field Museum, 1400 South Lake Shore Drive, Chicago, Illinois 60605–2496, USA
80. Centre ValBio, Ranomafana, Madagascar
81. Embrapa Florestas, Colombo/PR, Brazil
82. Yachay Tech University, School of Biological Sciences and Engineering. Urcuquí, Ecuador
83. Department of Evolutionary Biology and Environmental Studies, University of Zurich, CH-8057 Zurich, Switzerland
84. Fundação Ecológica Cristalino Alta Floresta, Brazil
85. HJ Andrews Experimental Forest, PO Box 300, Blue River, OR 97413, USA
86. Museu Universitário, Universidade Federal do Acre, Rio Branco 69910-900, Brazil
87. Guyana Forestry Commission, Georgetown, Guyana
146 147
148
149 150
151
152
153
154
155
156 157
158
159
160 161
162 163
164
165
166
88. Forests and Societies, Univ. Montpellier, CIRAD, Montpellier, France
89. Museo de Historia Natural Noel Kempff Mercado, Santa Cruz, Bolivia
90. Institute of Biological and Health Sciences, Federal University of Alagoas, Maceió, Brazil
91. Systems Ecology, Free University, De Boelelaan 1087, Amsterdam, 1081 HV, Netherlands
92. Florida Museum of Natural History and Department of Biology, University of Florida - Gainesville, Gainesville, FL 32611, USA
93. Department of Biology, James Cook University, Cairns, Australia
94. Laboratoire d’Evolution Biologique et Ecologie, Faculté des Sciences, Université libre de Bruxelles, CP160/12, 1050 Bruxelles, Belgium
95. Forestry and Forest Products Research Institute, Matsunosato 1, Tsukuba 305-8687, Japan
96. Escuela de Ciencias Biológicas, Pontificia Universidad Católica del Ecuador, Quito, Ecuador
97. Coordenação de Botânica, Museu Paraense Emilio Goeldi, Belém, Brazil
98. Andes to Amazon Biodiversity Program, Madre de Dios, Peru
99. Department of Integrative Biology, University of California, Berkeley, 1005 Valley Life Sciences Building 3140, Berkeley, CA 94720-3140, USA
100. Centro de Investigación y Promoción del Campesinado - Norte Amazónico, Riberalta, Bolivia
101. Remote Sensing Division, National Institute for Space Research - INPE, São José dos Campos 12227-010, SP, Brazil
168
169
170 171
172 173
174 175
176
177 178
179 180
181 182
183
184
185 186
187 188
102. The Center for Reforestation Studies in the Tropical Rain Forest (PUSREHUT), Mulawarman University, Jln. Kihajar Dewantara Kampus Gunung Kelua, Samarinda 75123, East Kalimantan, Indonesia
103. Center for Agricultural Research in Suriname (CELOS), Suriname
104. Tropenbos International, PO Box 232, Wageningen 6700 AE, The Netherlands 191
192 193
194
Abstract
Aim. Large tropical trees form the interface between ground and airborne observations, offering a unique opportunity to capture forest properties remotely and to investigate their variations on broad scales. However, despite rapid development of metrics to characterize the forest canopy from remotely sensed data, a gap remains between aerial and field inventories. To close this gap, we propose a new pan-tropical model to predict plot-level forest structure properties and biomass from just the largest trees.
Location. Pan-tropical
Time period. Early 21st century Major taxa studied. Woody plants
Method. Using a dataset of 867 plots distributed among 118 sites across the tropics, we tested the prediction of the quadratic mean diameter, basal area, Lorey’s height, community wood density and aboveground biomass from the ith largest trees.
Result. Measuring the largest trees in tropical forests enables unbiased predictions of plot and site-level forest structure. The 20 largest trees per hectare predicted quadratic mean diameter, basal area, Lorey’s height and community wood density and aboveground biomass with 12%, 16%, 4%, 4% and 17.7% of relative error. Most of the remaining error in biomass prediction is driven by differences in the proportion of total biomass held in medium size trees (50-70 cm), which shows some continental dependency with American tropical forests presenting the highest proportion of total biomass in these intermediate diameter classes relative to other continents.
Conclusion. Our approach provides new information on tropical forest structure and can be employed to accurately generate field estimates of tropical forest carbon stocks to support the calibration and validation of current and forthcoming space missions. It will reduce the cost of field inventories and contribute to scientific understanding of tropical forest ecosystems and response to climate change.
Introduction
The fundamental ecological function of large trees is well established for tropical forests. They offer shelter to multiple organisms (Remm & Lõhmus, 2011; Lindenmayer et al., 2012), regulate forest dynamics, regeneration (Harms et al., 2000; Rutishauser et al., 2010) and total biomass (Stegen et al., 2011), and are important contributors to the global carbon cycle (Meakem et al., 2017). Being major components of the canopy, the largest trees may also suffer more than sub-canopy and understory trees from climate change, as they are directly exposed to variations in solar radiation, wind strength, temperature seasonality and relative air humidity (Laurance et al., 2000; Nepstad et al., 2007; Lindenmayer et al., 2012; Thomas et al., 2013; Bennett et al., 2015; Meakem et al., 2017). Because they are visible from the
sky, large trees are ideal for monitoring forest responses to climate change via remote sensing (Bennett et al., 2015; Asner et al., 2017).
Large trees encompass a disproportionate fraction of total aboveground biomass (AGB) in tropical forests (Chave et al., 2001; Lutz et al., 2018), with some variations in their relative contribution to the total AGB among the tropical regions (Feldpausch et al., 2012). In Central Africa, the largest 5% of trees in a forest sample plot, i.e. the 5% of trees with the largest diameter at 130 cm, store 50% of forest plot aboveground biomass on average (Bastin et al., 2015). Consequently, the density of large trees largely explains variation in forest AGB at local (Clark & Clark, 1996), regional (Malhi et al., 2006; Saatchi et al., 2007), and continental scales (Stegen et al., 2011; Slik et al., 2013). Detailing the contribution of each single tree to the diameter structure, we showed previously that plot-level AGB can be predicted from a few large trees (Bastin et al., 2015), with the measurement of the 20 largest trees per hectare being sufficient to estimate plot-level biomass with less than 15% error in reference to ground estimates. These findings suggested that a substantial gain of cost-effectiveness may be achieved by focusing forest inventories on the largest trees rather than all size classes. Similarly, it suggested that remote sensing (RS) approaches could focus on the measurement of the largest trees, instead of properties of the entire forest stand.
Several efforts are underway to close the gap between remote sensing of forest biomass and field surveys (Coomes et al., 2017; Jucker et al., 2017). However, existing RS approaches typically require ground measurement of all trees above or equal to 10 cm of diameter (D) for calibration (Asner et al., 2012; Asner & Mascaro, 2014). Collecting such data in the field is costly and time-consuming, which therefore limits the spatial representativeness of available plot networks. Besides, extrapolation methods of ground-based biomass estimations on RS data still faces important limits. For instance, using mean canopy height extracted from active sensors (Mascaro et al., 2011; Ho Tong Minh et al., 2016), or canopy grain derived from optical images (Proisy et al., 2007; Ploton et al., 2012, 2017; Bastin et al., 2014), the biomass is predicted with an error of only 10-20% compared to ground-based estimates. However, this good level of accuracy is limited to the extent of the RS scene used, which considerably decrease in the upscaling step necessary for national of global maps (Xu et al., 2017). A promising development to alleviate this spatial restriction lies in the ‘universal approach’, proposed by Asner et al. (2012) and further adapted in Asner and Mascaro (2014), in which plot-level biomass is predicted by a linear combination of ground-based and remotely-sensed metrics. The ‘universal approach’ relies upon canopy height metrics derived from radar or LiDAR (top of canopy height, TCH), and basal area (BA, i.e. the cumulated cross-sectional stems area) and community wood density (i.e. weighted by basal area, WDBA) derived from field inventories. Plot AGB is then predicted as follows (Asner et al., 2012): AGB = aTCHb1BAb2WD
BAb3(1)
While generally performing better than approaches based solely on remote sensing of tree height (Coomes et al., 2017), this model relies on exhaustive ground measurements (i.e. wood density and basal area of all trees above 10 cm of diameter at 130 cm, neither of which is measured using any existing remotely sensed data).
Recent advances in remote sensing allow the identification of single trees in the canopy (Ferraz et al., 2016), estimation of adult mortality rates for canopy tree species (Kellner & Hubbell, 2017), description of the forest diameter structure (Stark et al., 2015), depiction of crown and gap shapes (Coomes et al., 2017), and even identification of some functional 249
traits of canopy species (Asner et al., 2017). As routine retrieval of some canopy tree metrics is within reach, we test here the capacity of the largest trees, i.e. trees that can be potentially derived using remote sensing, to predict plot-level biomass. To this end, we adapted equation (1) as follows:
AGB = a(DgLT iHLT iWDLTi)b1 (2)
where for the ith largest trees, Dg
LT is the quadratic mean diameter, HLT the mean height, and WDLT the mean wood density among the ith largest trees.
Using a large database of forest inventories gathered across the tropics (Figure 1), including secondary and old growth forest plots, we test the ability of the largest trees to predict various metrics estimated at 1-ha plot level, namely the mean quadratic diameter, the basal area, the Lorey’s height (i.e. plot-average height weighted by basal area), the community wood density (i.e. plot-average wood density weighted by basal area) and mean aboveground live biomass (supplementary figure 1). By testing different numbers of largest trees as predictors, we aim to propose a threshold of the minimal number of largest trees required to predict forest plot metrics at a pan-tropical level with no bias and low uncertainty (i.e. error inferior to 20%). While previous work focused on estimating biomass in Central African forests (Bastin et al., 2015), the present study aims at generalizing the potential of large trees to predict these different plot metrics at continental and pan-tropical scales. Taking advantage of a unique dataset gathered across the tropics (867 1-ha plots), we also investigate major differences in forest structure across the three main tropical regions: the Americas, Africa and Asia. We further discuss how this approach can be used to guide innovative RS techniques and increase the frequency and representativeness of ground data to support global calibration and validation of current and planned space missions. These include the NASA Global Ecosystem Dynamics Investigation (GEDI), NASA-ISRO Synthetic Aperture Radar (NISAR), and ESA P-band radar (BIOMASS) (Le Toan et al., 2011; Dubayah et al., 2014). This study is a step forward in bringing together remote sensing and field
sampling techniques for quantification of terrestrial C stocks in tropical forests. 277
Material & Methods Database
For this study, we compiled standard forest inventories conducted in 867 1-ha plots from 118 sites across the three tropical regions (Figure 1), including mature and secondary forests. Each site comprises all the plots in a given geographical location, i.e. within a 10 km radius and collected by a Principal Investigator and its team. These consisted of 389 plots in America (69 sites), 302 plots in Africa (35 sites) and 176 plots in Asia (14 sites). Data were provided by Principal Investigators (see supplementary Table 1), and through datasets available on the following networks: TEAM (http://www.teamnetwork.org/), CTFS (http://www.forestgeo.si.edu/; Condit et al., 2012) and ForestPlots (https://www.forestplots.net/) for AfriTRON (the African Tropical Rainforest Observation Network; www.afritron.org) and RAINFOR (the Amazon forest inventory network; http://www.rainfor.org/) networks.
We selected plots located between 23°N and 23°S, including tropical islands, with an area of 1-ha to ensure stable intra-sample variance in basal area (Clark & Clark, 2000). Plots in which at least 90% of the stems were identified to species, and in which all stems with the diameter at 130 cm greater than or equal to 10 cm had been measured were included. Wood density, here recorded as the wood dry mass divided by its green volume, was assigned to each tree using the lowest available taxonomic level of botanical identifications (i.e. species or genus) and the corresponding average wood density recorded in the Global Wood Density Database (GWDD, Chave et al., 2009; Zanne et al., 2009). Botanical identification was
harmonized through the Taxonomic Names Resolution Service
(http://tnrs.iplantcollaborative.org), for both plot inventories and the GWDD. For trees not identified to species or genus (~5%), we used plot-average wood density. We estimated heights of all trees using Chave et al.’s (2014) pan-tropical diameter-height model which accounts for heterogeneity in the D-H relationship using an environmental proxy:
Ln(H) = 0.893−E+0.760ln(D)−0.0340 ln(D)2 (3) 304
Where D is the diameter at 130 cm and E is a measure of environmental stress (Chave et al., 2014). For sites with tree height measurements (N=20), we developed local D-H models, using a Michaelis-Menten function (Molto et al., 2014). We used these local models to validate the predicted Lorey’s height (i.e. plot average height weighted by BA) from the largest trees, of which height has been estimated with a generic H-D model (equation 3, Chave et al. 2014).
We estimated plot biomass as the sum of the biomass of live tree with diameter at 130 cm superior or equal to 10 cm, using the following pan-tropical allometric model (Réjou-Méchain et al., 2017):
AGB=exp(-2.024-0.896E+0.920ln(WD)+2.795ln(D)-0.0461(ln(D2))) (4) Plot-level metric estimation from the largest trees
The relationship between each plot metric, namely basal area (BA), the quadratic mean diameter (Dg), Lorey’s height (HBA; the mean height weighted by the basal area) and the community wood density (WDBA; the mean wood density weighted by the basal area), and those derived from largest trees was determined using an iterative procedure following Bastin et al. (2015). Trees were first ranked by decreasing diameter in each plot. An incremental procedure (i.e. including a new tree at each step) was used to sum or average information of the i largest trees for each plot metric. Each plot-level metric was predicted by the respective metric derived from the ith largest trees. For each increment, the ability (goodness of fit) of the i largest trees to predict a given plot-metric was tested through a linear regression. To avoid overfitting, a Leave-One-Out procedure was used to develop independent site-specific models (N=118). Specifically, the model to be tested at a site was developed with data from all other sites. Errors were then estimated as the relative root mean square error (rRMSE) computed between observed and predicted values (X):
rRMSE=
√
∑
(
Xobs−Xpred)
2n /X (5)
The form of the regression model (i.e. linear, exponential) was selected to ensure a normal distribution of the residuals.
331 332 333 334 335 336 337 338 339 340 341 342 343 344 345 346 347 348 349 350 351 352 353 354
355
To estimate plot basal area, we used a simple power-law constrained on the origin, as linear model resulted in non-normal residuals. Plot-level basal area (BA) was related to the basal area for the i largest trees (BAi) using:
BA = b1 ΣBAiγ1 (6)
To estimate the quadratic mean diameter, Lorey’s height and the wood density of the community, we used simple linear models relating the plot-level metrics and the value of the metrics for the i largest trees:
Dg = a2 + b2 Dgi (7) HBA = a3 + b3(8) WDBA = a4 + b4(9)
Both Lorey’s height (HBA) and the average height () of the ith largest trees depend on the same D-H allometry, which always contains uncertainty whether we use a local, a continental or a pan-tropical model. To test the dependence of the prediction of HBA from on the allometric model, we used measurement from Malebo in the Democratic Republic of the Congo, where all heights were measured on the ground (see supplementary figure 2).
The quality of the predictions of plot-level metrics from the largest trees is quantified using the relative root mean square error (rRMSE) between measured and predicted values, and displayed along the cumulated number of largest trees. Model coefficients are estimated for each metric derived from the largest trees (NLT) and averaged across the 118 models (see supplementary table 2).
Mean rRMSE is plotted as a continuous variable, while its variation is presented as a continuous area between 5th and the 95th percentiles of observed rRMSE.
The optimal number of largest trees for plot-level biomass estimation
The optimal number of largest trees NLT was determined from the prediction of each plot-level
metric considered above, i.e. keeping a small number of trees while ensuring a low level of error for each structural parameter. We then predicted plot-level biomass from the NLT model
(equation 2). The final error was calculated by propagating the entire set of errors related to 358
equation 4 (Réjou-Méchain et al., 2017) in the NLT model (i.e. error associated to each
allometric model used). The model was then cross-validated across all plots (N=867). Investigating residuals: what the largest trees do not explain
To understand the limits of predicting AGB through NLT, we further investigated the relationship between AGB residuals and key structural and environmental variables using linear modelling. Forest structure was investigated through the total stem density (N), the quadratic mean diameter (Dg), Lorey’s height (HBA) and community wood density (WBBA). As environmental data, we used the mean annual rainfall and the mean temperature computed over the last 10 years at each site using the Climate Research Unit data (New et al., 1999, 2002), along with rough information on soil types (Carré et al., 2010). Major soil types were computed from the soil classification of the Harmonized World Soil Database into IPCC (intergovernmental panel on climate change) soil classes. In addition, considering observed differences in forest structure across tropical continents (Feldpausch et al., 2011, 2012) and recent results on pan-tropical floristic affinities (Slik et al., 2015), we tested for an effect of continent (America, Africa and Asia) on the AGB residuals. Differences in forest structure and AGB among continents were also illustrated through the analysis of their distribution.
The importance of each variable was evaluated by calculating the type II sum of squares that measures the decrease in residual sum of squares due to an added variable once all the other variables have been introduced into the model (Langsrud, 2003). Residuals were investigated at both plot and site levels, the latter analyzed to test for any influence of the diameter structure, which is usually unstable at the plot level due to the dominance of large trees on forest metrics at small scales (Clark & Clark, 2000). Here we use a principal component analysis (PCA) to summarize the information held in the diameter structure by ordinating the sites along the abundance of trees in each diameter class (from 10 to +100 cm by 10 cm bins).
385 386 387 388 389 390 391 392 393 394 395 396 397 398 399 400
Results
Plot-level metrics
Plot metrics averaged at the site level (867 plots, 118 sites) present important variations within and between continents. In our database, the quadratic mean diameter varies from 15 to 42 cm2ha-1, the basal area from 2 to 58 m2ha-1, Lorey’s height from 11 to 33 m and the wood density weighted by the basal area from 0.48 to 0.84 gcm-3 (supplementary figure 1). Such important differences between minimal and maximal values are observed because our database cover sites with various forest types, from young forest colonizing savannas to old growth forest. However, most of our sites are found in mature forests, as shown by relatively high average and median value of each plot metric (average aboveground biomass = 302 Mgha-1; supplementary figure 1). In general, highest values of aboveground biomass are found in Africa, driven by highest values of basal area and highest estimations of Lorey’s height. Highest values of wood density weighted by basal area are found in America.
Plot-level estimation from the i largest trees
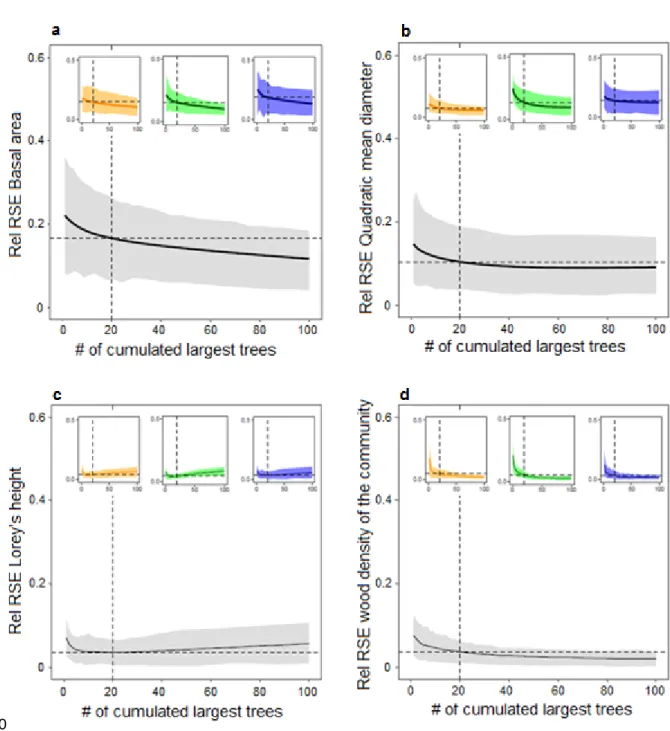
Overall, plot metrics at 1-ha scale were well predicted by the largest trees, with qualitative agreement among global and continental models (Figure 2). When using the 20 largest trees to predict basal area (BA) and quadratic mean diameter (Dg), the mean rRMSE was < 16% and 12%, respectively (Figs 3a and 3b). Lorey’s height (HBA) and wood density weighted by basal area (WDBA) were even better predicted (Figs 3c and 3d), with mean rRMSE of 4% for the 20 largest trees. The prediction of Lorey’s height from the largest trees using local diameter-height model (supplementary figure 2a) yielded results similar to those obtained using equation 3 of Chave et al. (2014). More importantly, it also yielded similar results to prediction of Lorey’s height from the largest trees using plots where all the trees were measured on the ground (supplementary figure 2b). This suggests that our conclusions are robust to the uncertainty introduced by height-diameter allometric models.
AGB prediction from the largest trees
We selected “20” as the number of largest trees to predict plot metrics. The resulting model predicting AGB (Mg ha-1) based on the 20 largest trees is:
AGB = 0.0735 × (Dg20H20WD20)1.1332 (rRMSE=0.179; R2=0.85; AIC= -260.18) (10)
Because the exponent was close to 1, we also developed an alternative and more operational model with the exponent constrained to 1, given by:
AGB = 0.195 × (Dg20H20WD20) (rRMSE=0.177; R2=0.85; AIC=-195) (11)
Ground measurements of plot AGB were predicted by our NLT model with the exponent constrained to 1, with a total error of 17.9% (Figure 4), a value which encompass the error of the NLT model and the error related to the allometric model chosen. The Leave-One-Out cross-validation procedure yielded similar results (rRMSE=0.19; R2=0.81), validating the use of the model on independent sites.
Determining the cause of residual variations
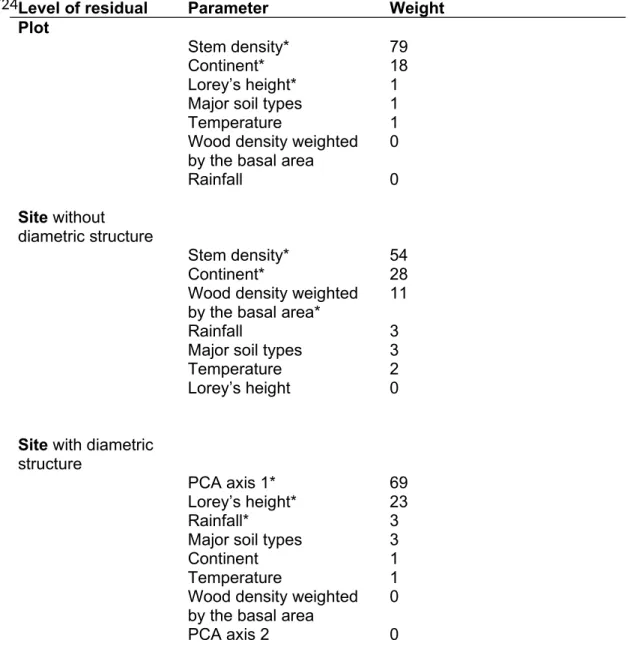
The explanatory variables all together explain about 37% of the variance in AGB both at plot and site levels when omitting the diameter structure, and about 63% at site level when included (Figure 5). In general, forest structure and particularly the stem density explained most of the residuals (table 1; weights: 79% and 54% at plot- and site-level respectively). The stem density was followed by a continental effect (weights: 18%, 28% and 1%, respectively for Africa, America and Asia) and by the effect of HBA and WDBA (respective weights: 1% and 0% at the plot level, 0% and 11% at the site level, and 23% and 0% when accounting for the diameter structure at the site level). Inclusion of the diameter structure provided the best explanation of residuals, with 63% of variance explained, and a weight of 69% for the first axis of the PCA (supplementary figure 3). This first axis of the PCA was related to the general abundance of trees at a site, and in particular medium-sized trees (40-60cm). Among environmental variables, only rainfall was significantly related to the residuals at the site level when the diameter structure was considered (2%).
Differences among continents
While diameter structure explained a large fraction of the residual variance of our global model, there was marked difference in forest structure across continents (Figure 6). Consequently, we investigated differences between continents in the distribution of residuals of the pan-tropical model (Figure 6a), in the relative contribution of the 20 largest trees to plot 438
total biomass (Figure 6b), and in the contribution to the total aboveground biomass per diameter class (Figs. 6c-f). To this end, we considered the following four classes of diameter at 130 cm: 10 to 30 cm, 30 to 50 cm, 50 to 70 cm and above 70 cm. Results show that the prediction of biomass from the 20 largest trees using the pan-tropical model tends to be slightly overestimated in Africa (+ 3%) and underestimated in America 3%) and in Asia (-5%) (Figure 6a). The proportion of biomass is higher in high diameter class (over 70 cm) in Africa, in intermediate diameter classes (between 30 and 70 cm) in America and is equally distributed among the different diameter classes in Asia (Figure 6 c-d).
Discussion
The largest trees, convergences and divergences between continents
Sampling a few largest trees per hectare generally allows an unbiased prediction of four key descriptors of forest structures across the tropics. There is generally no improvement in predicting biomass, quadratic mean diameter, Lorey’s height (HBA) or community wood density beyond the first 10-to-20 largest trees (Figure 2, Figure 3a). But when a forest plot presents an abundant number of large trees (Figure 5d), increasing the number of trees sampled does improve the model’s accuracy. This is due to the fact that the higher total AGB in a plot, the lower the proportion of total AGB encompassed by the largest trees. This is particularly true for BA for which rRMSE continues to decrease up to 100 largest trees (Figure 2a). In contrast, Lorey’s height predictions are altered when a large number of trees are included (Figure 2c), i.e. when smaller, often suppressed, trees draw the average down (Farrior et al., 2016). This might explain why the prediction of AGB does not mirror that of basal area (Figure 2b, Figure 3a), and suggest that the number of largest trees shall be set independently to each predictor considered. Interestingly, the evolution of relative error in AGB prediction as a function of the number of largest trees considered does not follow the same path between continents. For instance, the error of prediction saturates more quickly in Africa and Asia than America. Investigation of residuals showed that the diameter structure (Figure 5c, supplementary Figure 3b), and in particular the number of medium size trees (Figure 5d), drives variability in AGB predictions. It is therefore not surprising to see that in our dataset the site with higher levels of underestimations is the one with the highest number of medium size trees, which is found in Asia in the Western Ghats of India.
The good performance of models based on the 20 largest trees in predicting Lorey’s height and community wood density at site level was not surprising. Both metrics were indeed weighted by basal area, driven de facto by the largest trees. Their consistency across sites and continents was not expected though, which emphasize the generality of our approach. The predictability of plot-level forest structure metrics from the largest trees implies that characteristics of smaller trees do not vary completely independently from those of the larger 474
trees. For example, plots where the largest trees have low basal area tend to have low plot-level basal area (Figure 3a), meaning that the total size of the smaller trees is sufficiently constrained so that it does not compensate for the small size of the largest trees. Such constraints could arise through size-frequency distributions being set by allometric scaling rules (Enquist et al., 2009), or could be due to the largest trees responding in the same way as the remaining smaller trees to environmental drivers.
Despite the general consistency of these relationships across continents, slight differences are evident when comparing the pan-tropical model residuals across continents (Figure 6, supplementary figure 4). These differences indicate biogeographic variation in forest structure. In America, our pan-tropical model tends to slightly underestimate basal area (mean: -5%) and overestimate Lorey’s height (mean: +3%) (supplementary figure 4). This suggests that large trees make up a smaller proportion of basal area in America and that for a given diameter we find higher trees (supplementary figure 2), the later confirming that the shape of height-diameter allometries varies between continents (Banin et al., 2012; Sullivan et al., 2018). In Africa, large trees (i.e. DBH > 70 cm) are more abundant and account for a large fraction of plot biomass (figure 6f). This supports previous observations that African forests are characterized by fewer but larger stems (Feldpausch et al., 2012; Lewis et al., 2013), while forests in the Americas have more stems but generally have lower biomass (Sullivan et al., 2017). In Asia, the distribution of the biomass across diameter classes appears more balanced (Figure 6c-f). Such differences in forest structure, even if being quite limited, suggest tropical forests differ between continents in terms of dynamics, carbon cycling, response and feedback to climate and resilience to external forcings (e.g. climate change, forest degradation and deforestation).
Interestingly, while a recent global phylogenetic classification of tropical forest groups American with African forests vs. Asian forests (Slik et al., 2018), our study of forest structure properties tends more to single out American forests, and particularly highlight the contrast in between African and American forests. Although this deserves further investigations, it might reveal a lack of close relationship between forest structure properties and phylogenic 502
similarity, which echoes recent results on the absence of relationship between tropical forest diversity and biomass (Sullivan et al., 2017).
Largest trees, a gateway to global monitoring of tropical forests
Revealing the predictive capacity held by the largest trees, our results constitute a major step forward to monitor forest structures and biomass stocks. The largest trees in tropical forests can therefore be used to accurately predict various ground-measured properties (i.e. the quadratic mean diameter, the basal area, Lorey’s height and community wood density), while previous work has predicted only biomass “estimates” (e.g. Slik et al., 2013; Bastin et al., 2015). Our approach allows us to (i) describe forest structure independently of any biomass allometric model (ii) and integrates environmental-based variations in D-H relationship, known to vary locally (Feldpausch et al., 2011; Kearsley et al., 2013;). It is also (iii) relatively insensitive to differences in floristic composition and community wood density (Poorter et al., 2015).
Furthermore, the “largest trees” models were developed for each plot-level metric and for any number of largest trees. Thus, they do not rely on any arbitrary threshold of tree diameter. Note that the optimal number of largest trees to be measured (i.e. 20) was set for demonstration and can vary depending on the needs and capacities of each country or project (see supplementary table 2). In the same way, local models could integrate locally-developed biomass models, when available. Consequently our approach (i) can be used in young or regenerating un-managed forests with a low “largest tree” diameter threshold and (ii) is compatible with recent remote sensing approaches able to single out canopy trees and describe their crown and height metrics (Ferraz et al., 2016; Coomes et al., 2017).
Aboveground biomass model from the largest trees, a multiple opportunity
Globally, the NLT model for the 20 largest trees allows plot biomass to be predicted with 17.9% error. This result is a pan-tropical validation of results obtained in Central Africa (Bastin et al., 2015). It opens new perspectives towards cost-effective methods to monitor forest structures and carbon stocks through largest trees metrics, i.e. metrics of objects directly intercepted by remote-sensing products.
Developing countries willing to implement Reduction of Emissions from Deforestation and Forest Degradation (REDD+) activities, shall also report on their carbon emissions and develop a national reference level (IPCC, 2006; Maniatis & Mollicone, 2010). However, most tropical countries lack capacities to assume multiple, exhaustive and costly forest carbon inventories (Romijn et al., 2012). By measuring only a few large trees per hectare, our results show that it is possible to obtain unbiased estimates of aboveground C stocks in a time and cost-efficient manner. Assuming that 400 to 600 trees D > 10 cm are measured in a typical 1-ha sample plot, monitoring only 20 trees is a significant improvement. Although finding the 20 largest trees in a plot of several hundred individuals requires evaluating more than 20 trees, in practice, a conservative diameter threshold could be defined to ensure that the 20 largest trees are sampled. An alternative approach could also be found in the development of relascope-based approach adapted to detection of the largest trees in tropical forests. Using such approach would facilitate rapid field sampling in extensive areas to produce large scale AGB estimates. Those could fulfil the needs in calibration and validation of current and forthcoming space missions focused on aboveground biomass.
Our findings also point towards the potential effectiveness of using remote sensing techniques to characterize canopy trees for inferring entire forest stands attributes. Remote sensing data could be used for direct measurement (e.g. tree level metrics such as height, crown width, crown height) of the largest trees as a potential alternative to indirect development of complex metrics (e.g. mean canopy height, texture) used to extrapolate forest properties. While the use of single-tree approach has shown some limitations to extrapolate plot metrics (Coomes et al., 2018), we have still to investigate their potential to identify largest trees. Some further refinements are needed, but most of the tools required to develop “largest trees” models are readily available. In particular, Ferraz et al. (2016) developed an automated procedure to locate single trees based on airborne LiDAR data, to measure their height and crown area. Crown area could further be linked to basal area, as the logarithm of crown area is consistently correlated with a slope of 1.2-1.3 to the logarithm of tree diameter across the tropics (Blanchard et al., 2016). Regarding wood density, 558
hyperspectral signature and high resolution topography offers a promising way to assess functional traits remotely (e.g. Asner et al., 2017; Jucker et al., 2018) which could potentially provide proxies of wood density. Alternative approaches could focus on the development of plot-level AGB prediction by replacing the basal area of the largest trees with their crown metrics. While the measurement of crown areas has yet to be generalized when inventorying plots, several biomass allometric models already partition trunk and crown mass (Ploton et al., 2016; Coomes et al., 2017; Jucker et al., 2017).
The main limitation of our approach lies in the limited inference that can be made on the understory and sub-canopy trees. We show that most of the remaining variance is explained by variations in diameter structures, and in particular among the total stem density. Interestingly, stem density was generally identified as a poor predictor of plot biomass in tropical forests (Slik et al., 2010; Lewis et al., 2013). However, our results show that stem density explains most of the remaining variance (Table S1). This suggests that, in addition to trying to understand large-scale variations in large trees and other plot metrics, which can be directly quantified from remote sensing, we should also put more effort into understanding variation in smaller trees, which mainly drives total stem density and the total floristic diversity. Smaller trees are also essential to characterize forest dynamics and understand changes in carbon stocks. Several options are nonetheless possible from remote sensing, considering the variation in lidar point density below the canopy layer (D’Oliveira et al., 2012), the distribution of leaf area density (Stark et al., 2012, 2015; Tang & Dubayah, 2017; Vincent et al., 2017) or the use of multitemporal lidar data to get information on forest gap generation dynamics and consequently on forest diameter structure (Kellner et al., 2009; Farrior et al., 2016).
Large trees in degraded forests
If large trees are a key feature of unmanaged forests, they are conspicuously absent from managed or degraded forests. Indeed, large trees are targeted by selective or illegal logging, and are the first to disappear or to suffer from incidental damages when tropical forests are exploited for timber (Sist et al., 2014). The loss of largest trees drastically changes forest 586
structures and diameter distributions, and their loss is likely to counteract the consistency in forest structures observed through this study. Understanding how, or whether, managed forests deviate from our model predictions could help characterize forest degradation, which accounts for a large fraction of carbon loss worldwide (Baccini et al., 2017), acknowledging that rapid post-disturbance biomass recovery (Rutishauser et al., 2015) will remain hard to capture.
Conclusion – towards improved estimates of tropical forest biomass
The acquisition, accessibility and processing capabilities of very high spatial, spectral and
temporal resolution remote sensing data has increased exponentially in recent years (Bastin et al., 2017). However, to develop accurate global maps, we will have to obtain a greater
number of field plots and develop new ways to use remote sensing data. Our results provide a step forward for both by (i) drastically decreasing the number of individual tree measurements required to get an accurate, yet less precise, estimate of plot biomass and (ii) opening the way to direct measurement of plot metrics measured from remote sensing to estimate plot biomass.
As highlighted by Clark and Kellner (2012), new biomass allometric models relating plot-level biomass measured from destructive sampling and plot-level metric measured from remote-sensing products should be developed, as an alternative to current tree-level allometric models. Such an effort will largely lower operational costs and uncertainties surrounding terrestrial C estimates, and consequently, will help developing countries in the development of national forest inventories and aid the scientific community in better understanding the effect of climate change on forest ecosystems.
Acknowledgments
J.-F.B. was supported for data collection by the FRIA (FNRS), ERAIFT (WBI), WWF and by the CoForTips project (ANR-12-EBID-0002); T.d.H. was supported by the COBIMFO project (Congo Basin integrated monitoring for forest carbon mitigation and biodiversity) funded by the Belgian Science Policy Office (Belspo); C.H.G was supported by the “Sud Expert Plantes” project of French Foreign Affairs, CIRAD and SCAC. Part of data in this paper was 614
provided by the RAINFOR Network, the AfriTRON network, TEAM Network, the partnership between Conservation International, The Missouri Botanical Garden, The Smithsonian Institution and The Wildlife Conservation Society, and these institutions and the Gordon and Betty Moore Foundation. This is [number to be completed] publication of the technical series of the Biological Dynamics of Forest Fragment Project (INPA/STRI). We acknowledge data contributions from the TEAM network not listed as co-authors (upon voluntary basis). We thank Jean-Phillipe Puyravaud, Estação Científica Ferreira Penna (MPEG) and the Andrew Mellon Foundation and National Science Foundation (DEB 0742830). The forest plots in Nova Xavantina and Southern Amazonia, Brazil was funded by grants from Project
PELD-CNPq/FAPEMAT (403725/2012-7; 441244/2016-5; 164131/2013); CNPq-PPBio
(457602/2012-0); productivity grants (CNPq/PQ-2) to B. H. Marimon-Junior and B. S.
Marimon; Project USA-NAS/PEER (#PGA-2000005316) and Project ReFlor FAPEMAT
0589267/2016.
And finally, we thank Helen Muller-Landau for her careful revision and comments of the manuscript.
Contributions
J.F.Bastin and E.Rutishauser conceptualized the study, gathered the data, performed the analysis and wrote the manuscript. All the co-authors contributed by sharing data and reviewing the main text. A.R.Marshall, J.Poulsen and J.Kellner revised the English.
Conflict of interest
The authors declare there is no conflict of interest associated to this study.
Figures
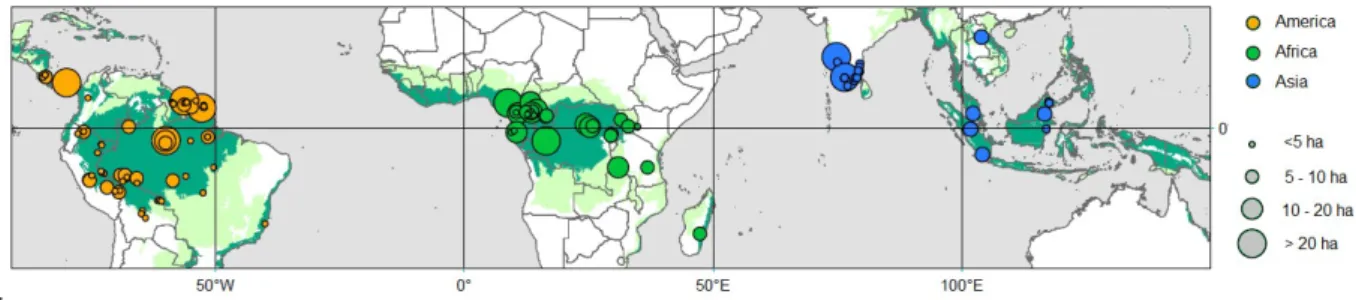
Figure 1. Geographic distribution of the plot database. We used 867 plots of 1 hectare from 118 sites. Dots are colored according to floristic affinities (Slik et al. 2015), with America, Africa and Asia respectively in orange, green and blue. They are also sized according the total area surveyed in each site.In the background, moist forests are displayed in dark green and dry forest in light green.
663
Figure 2. Quality of the prediction of plot metrics from largest trees. Variation of the relative Root Mean Square Error (rRMSE) of the prediction of plot metric from i largest trees versus the cumulative number of largest trees for (a) basal area, (b) quadratic mean diameter, (c) Lorey’s height and (d) wood density weighted by the basal area. Results are displayed at the pan-tropical level (main plot in grey) and at the continental level (subplots; orange = America; green = Africa; blue = Asia). The solid line and shading shows the mean rRMSE and the 5th and the 95th percentiles. Dashed lines represent the mean rRMSE observed for each model, when considering the 20 largest trees.
Figure 3. Prediction of plot metrics (y-axis) from the 20 largest trees (x-axis). Results are shown for (a) basal area, (b) quadratic mean diameter, (c) Lorey’s Height and (d) wood density weighted by the basal area. Each dot corresponds to a single plot, colored in orange, green and blue for America, Africa and Asia respectively. Both pan-tropical (black dashed lines) and continental (coloured lines) regression models are displayed. These results show that substantial part of remaining variance, i.e. not explained by largest trees, is found when predicting the basal area and the quadratic mean diameter, with slight but significant differences between continents.
Figure 4. Prediction of AGB from plot metrics of the 20 largest trees. Results are shown for the 867 plots, among the three continents colored orange, green and blue for America, Africa and Asia respectively. The regression line of the model is shown as a continuous black line while the dashed black line shows a 1:1 relationship. The figure shows an unbiased prediction of AGB across the 867 plots, with slight but significant differences between the 3 continents.
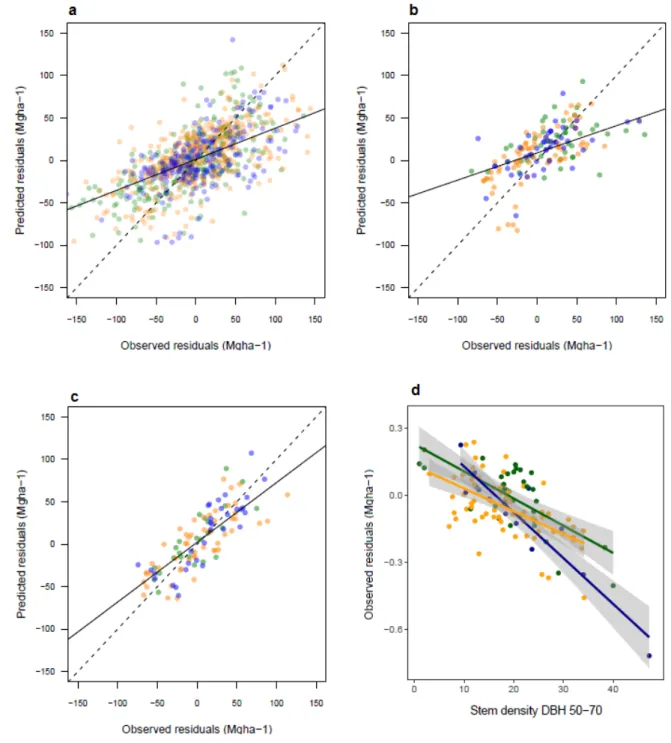
Figure 5. Predicted vs. observed residuals of aboveground biomass predicted from the 20 largest trees. Residuals are explored at three different levels: (a) plot, (b) site [without considering the diameter structure as an explanatory variable], (c) site [considering the diameter structure] and (d) along the stem density of medium size trees.America, Africa and Asia are colored in orange, green and blue respectively. The figures show a good prediction of residuals in (a) and (b), driven by stem density, and a less biased prediction in 695
(c), driven by the diameter structure. Variance of observed residuals are also well explained by the stem density of medium size trees (d), which mainly drive the first axis of the PCA. 702
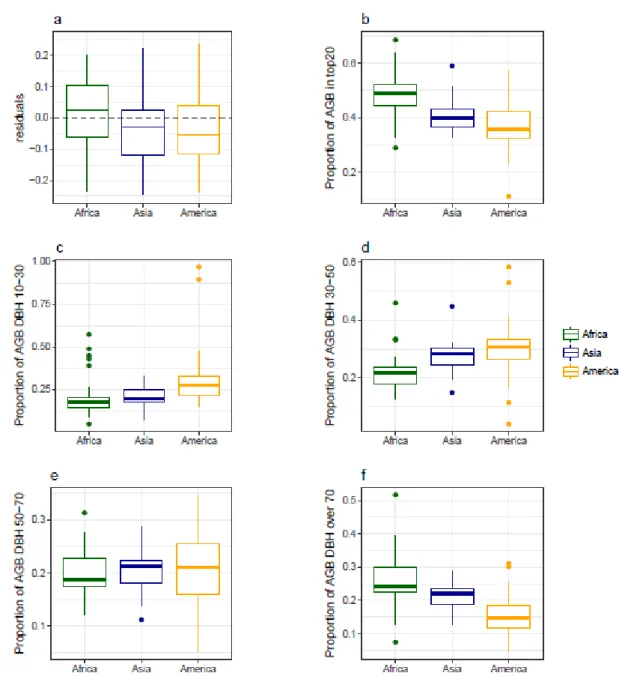
Figure 6. Comparison across continents of aboveground biomass prediction per site and their contribution to different share of the diameter structure. Africa, Asia and America, are colored in green, blue and orange, respectively. The distribution of the residuals of pan-tropical aboveground biomass prediction from the 20 largest trees (a) shows predictions are slightly overestimated in Africa (+3%), and slightly underestimated in Asia (-3%) and America (-5%). The proportion of aboveground biomass in the 20 largest trees (b) is highest in Africa (48%), followed by Asia (40%) and America (35%). The decomposition across four diameter classes (c-f, i.e. from 10 to 30, 30 to 50, 50 to 70 and beyond 70 cm) of their relative share of the total biomass shows that most of the biomass is found in the large trees in Africa, and in 704
the small to medium trees in America. Asia presenting a more balanced distribution of biomass across the diameter structure.
Tables
Table 1. Weight of each variable retained for the explanation of AGB residuals. Weights are calculated as a type ll sum of squares, which measures the decreased residual sum of squares due to an added variable once all the other variables have been introduced into the model. Results are shown for the exploration of residuals at the plot and at the site level, with and without consideration of the diameter structure. Weights are dominated by structural variables, and in particular the stem density and the diameter structure. Height, wood density and continent have also a non-negligible influence on residuals.
Level of residual Parameter Weight
Plot
Stem density* 79
Continent* 18
Lorey’s height* 1
Major soil types 1
Temperature 1
Wood density weighted by the basal area
0
Rainfall 0
Site without diametric structure
Stem density* 54
Continent* 28
Wood density weighted by the basal area*
11
Rainfall 3
Major soil types 3
Temperature 2
Lorey’s height 0
Site with diametric structure
PCA axis 1* 69
Lorey’s height* 23
Rainfall* 3
Major soil types 3
Continent 1
Temperature 1
Wood density weighted by the basal area
0
PCA axis 2 0
References
Asner, G.G.P., Mascaro, J., Muller-Landau, H.H.C., Vieilledent, G., Vaudry, R., Rasamoelina, M., Hall, J.S. & van Breugel, M. (2012) A universal airborne LiDAR approach for tropical forest carbon mapping. Oecologia, 168, 1147–1160.
Asner, G.P., Martin, R.E., Knapp, D.E., Tupayachi, R., Anderson, C.B., Sinca, F., Vaughn, N.R. & Llactayo, W. (2017) Airborne laser-guided imaging spectroscopy to map forest trait diversity and guide conservation. Science, 355.
Asner, G.P. & Mascaro, J. (2014) Mapping tropical forest carbon: Calibrating plot estimates to a simple LiDAR metric. Remote Sensing of Environment, 140, 614–624.
Baccini, A., Walker, W., Carvalho, L., Farina, M., Sulla-Menashe, D. & Houghton, R.A. (2017) Tropical forests are a net carbon source based on aboveground measurements of gain and loss. Science (New York, N.Y.), 358, 230–234.
Banin, L., Feldpausch, T.R., Phillips, O.L., Baker, T.R., Lloyd, J., Affum-Baffoe, K., Arets, E.J.M.M., Berry, N.J., Bradford, M., Brienen, R.J.W., Davies, S., Drescher, M., Higuchi, N., Hilbert, D.W., Hladik, a., Iida, Y., Salim, K.A., Kassim, a. R., King, D. a., Lopez-Gonzalez, G., Metcalfe, D., Nilus, R., Peh, K.S.-H., Reitsma, J.M., Sonké, B.,
Taedoumg, H., Tan, S., White, L., Wöll, H. & Lewis, S.L. (2012) What controls tropical forest architecture? Testing environmental, structural and floristic drivers. Global Ecology and Biogeography, 21, 1179–1190.
Bastin, J.-F., Barbier, N., Couteron, P., Adams, B., Shapiro, A., Bogaert, J., De Cannière, C., De Canniére, C. & De Cannière, C. (2014) Aboveground biomass mapping of African forest mosaics using canopy texture analysis: toward a regional approach. Ecological Applications, 24, 1984–2001.
Bastin, J.F., Barbier, N., Réjou-Méchain, M., Fayolle, A., Gourlet-Fleury, S., Maniatis, D., De Haulleville, T., Baya, F., Beeckman, H., Beina, D., Couteron, P., Chuyong, G., Dauby, G., Doucet, J.L., Droissart, V., Dufrêne, M., Ewango, C., Gillet, J.F., Gonmadje, C.H., Hart, T., Kavali, T., Kenfack, D., Libalah, M., Malhi, Y., Makana, J.R., Pélissier, R., Ploton, P., Serckx, A., Sonké, B., Stevart, T., Thomas, D.W., De Cannière, C. & 725
Bogaert, J. (2015) Seeing Central African forests through their largest trees. Scientific Reports, 5, 13156.
Bastin, J.-F., Berrahmouni, N., Grainger, A., Maniatis, D., Mollicone, D., Moore, R., Patriarca, C., Picard, N., Sparrow, B., Abraham, E.M., Aloui, K., Atesoglu, A., Attore, F., Bassüllü, Ç., Bey, A., Garzuglia, M., García-Montero, L.G., Groot, N., Guerin, G., Laestadius, L., Lowe, A.J., Mamane, B., Marchi, G., Patterson, P., Rezende, M., Ricci, S., Salcedo, I., Diaz, A.S.-P., Stolle, F., Surappaeva, V. & Castro, R. (2017) The extent of forest in dryland biomes. Science, 356, 635–638.
Bennett, A.C., Mcdowell, N.G., Allen, C.D. & Anderson-Teixeira, K.J. (2015) Larger trees suffer most during drought in forests worldwide. Nature Plants, 1, 15139.
Blanchard, E., Birnbaum, P., Ibanez, T., Boutreux, T., Antin, C., Ploton, P., Vincent, G., Pouteau, R., Vandrot, H., Hequet, V., Barbier, N., Droissart, V., Sonké, B., Texier, N., Kamdem, N.G., Zebaze, D., Libalah, M. & Couteron, P. (2016) Contrasted allometries between stem diameter, crown area, and tree height in five tropical biogeographic areas. Trees, 30, 1953–1968.
Carré, F., Hiederer, R., Blujdea, V. & Koeble, R. (2010) Background guide for the calculation of land carbon stocks in the biofuels sustainability scheme drawing on the 2006 IPCC
Guidelines for National Greenhouse Gas Inventories, p128.
Chave, J., Coomes, D., Jansen, S., Lewis, S.L., Swenson, N.G. & Zanne, A.E. (2009) Towards a worldwide wood economics spectrum. Ecology letters, 12, 351–66.
Chave, J., Réjou-Méchain, M., Búrquez, A., Chidumayo, E., Colgan, M.S., Delitti, W.B.C., Duque, A., Eid, T., Fearnside, P.M., Goodman, R.C., Henry, M., Martínez-Yrízar, A., Mugasha, W.A., Muller-Landau, H.C., Mencuccini, M., Nelson, B.W., Ngomanda, A., Nogueira, E.M., Ortiz-Malavassi, E., Pélissier, R., Ploton, P., Ryan, C.M., Saldarriaga, J.G. & Vieilledent, G. (2014) Improved allometric models to estimate the aboveground biomass of tropical trees. Global change biology, 20, 3177–3190.
Chave, J., Riera, B., Dubois, M.-A. & Riéra, B. (2001) Estimation of biomass in a neotropical forest of French Guiana : spatial and temporal variability. Journal of Tropical Ecology, 753
17, 79–96.
Clark, D.B. & Clark, D.A. (1996) Abundance, growth and mortality of very large trees in neotropical lowland rain forest. Forest Ecology and Management, 80, 235–244.
Clark, D.B. & Clark, D.A. (2000) Landscape-scale variation in forest structure and biomass in a tropical rain forest. Forest Ecology and Management, 137, 185–198.
Clark, D.B. & Kellner, J.R. (2012) Tropical forest biomass estimation and the fallacy of misplaced concreteness. Journal of Vegetation Science, 23, 1191–1196.
Coomes, D.A., Dalponte, M., Jucker, T., Asner, G.P., Banin, L.F., Burslem, D.F.R.P., Lewis, S.L., Nilus, R., Phillips, O.L., Phua, M.-H. & Qie, L. (2017) Area-based vs tree-centric approaches to mapping forest carbon in Southeast Asian forests from airborne laser scanning data. Remote Sensing of Environment, 194, 77–88.
Coomes, D.A., Šafka, D., Shepherd, J., Dalponte, M. & Holdaway, R. (2018) Airborne laser scanning of natural forests in New Zealand reveals the influences of wind on forest carbon. Forest Ecosystems 2017 5:1, 5, 10.
D’Oliveira, M.V.N., Reutebuch, S.E., McGaughey, R.J. & Andersen, H.-E. (2012) Estimating forest biomass and identifying low-intensity logging areas using airborne scanning lidar in Antimary State Forest, Acre State, Western Brazilian Amazon. Remote Sensing of Environment, 124, 479–491.
Dubayah, R., Goetz, S.J., Blair, J.B., Fatoyinbo, T.E., Hansen, M., Healey, S.P., Hofton, M.A., Hurtt, G.C., Kellner, J., Luthcke, S.B. & Swatantran, A. (2014) The Global Ecosystem Dynamics Investigation. American Geophysical Union, Fall Meeting 2014, abstract id. U14A-07.
Enquist, B.J., West, G.B. & Brown, J.H. (2009) Extensions and evaluations of a general quantitative theory of forest structure and dynamics. Proceedings of the National Academy of Sciences, 106, 7046–7051.
Farrior, C.E., Bohlman, S.A., Hubbell, S. & Pacala, S.W. (2016) Dominance of the suppressed: Power-law size structure in tropical forests. Science, 351.
Fayolle, A., Loubota Panzou, G.J., Drouet, T., Swaine, M.D., Bauwens, S., Vleminckx, J., 781
Biwole, A., Lejeune, P. & Doucet, J.-L. (2016) Taller trees, denser stands and greater biomass in semi-deciduous than in evergreen lowland central African forests. Forest Ecology and Management, 374, 42–50.
Feldpausch, T.R., Banin, L., Phillips, O.L., Baker, T.R., Lewis, S.L., Quesada, C. a., Affum-Baffoe, K., Arets, E.J.M.M., Berry, N.J., Bird, M., Brondizio, E.S., de Camargo, P., Chave, J., Djagbletey, G., Domingues, T.F., Drescher, M., Fearnside, P.M., França, M.B., Fyllas, N.M., Lopez-Gonzalez, G., Hladik, a., Higuchi, N., Hunter, M.O., Iida, Y., Salim, K. a., Kassim, a. R., Keller, M., Kemp, J., King, D. a., Lovett, J.C., Marimon, B.S., Marimon-Junior, B.H., Lenza, E., Marshall, a. R., Metcalfe, D.J., Mitchard, E.T. a., Moran, E.F., Nelson, B.W., Nilus, R., Nogueira, E.M., Palace, M., Patiño, S., Peh, K.S.-H., Raventos, M.T., Reitsma, J.M., Saiz, G., Schrodt, F., Sonké, B., Taedoumg, H.E., Tan, S., White, L., Wöll, H. & Lloyd, J. (2011) Height-diameter allometry of tropical forest trees. Biogeosciences, 8, 1081–1106.
Feldpausch, T.R., Lloyd, J., Lewis, S.L., Brienen, R.J.W., Gloor, M., Monteagudo Mendoza, A., Lopez-Gonzalez, G., Banin, L., Abu Salim, K., Affum-Baffoe, K., Alexiades, M., Almeida, S., Amaral, I., Andrade, A., Aragão, L.E.O.C., Araujo Murakami, A., Arets, E.J.M.M., Arroyo, L., Aymard C., G.A., Baker, T.R., Bánki, O.S., Berry, N.J., Cardozo, N., Chave, J., Comiskey, J.A., Alvarez, E., de Oliveira, A., Di Fiore, A., Djagbletey, G., Domingues, T.F., Erwin, T.L., Fearnside, P.M., França, M.B., Freitas, M.A., Higuchi, N., E. Honorio C., Iida, Y., Jiménez, E., Kassim, A.R., Killeen, T.J., Laurance, W.F., Lovett, J.C., Malhi, Y., Marimon, B.S., Marimon-Junior, B.H., Lenza, E., Marshall, A.R.,
Mendoza, C., Metcalfe, D.J., Mitchard, E.T.A., Neill, D.A., Nelson, B.W., Nilus, R., Nogueira, E.M., Parada, A., Peh, K.S.-H., Pena Cruz, A., Peñuela, M.C., Pitman, N.C.A., Prieto, A., Quesada, C.A., Ramírez, F., Ramírez-Angulo, H., Reitsma, J.M., Rudas, A., Saiz, G., Salomão, R.P., Schwarz, M., Silva, N., Silva-Espejo, J.E., Silveira, M., Sonké, B., Stropp, J., Taedoumg, H.E., Tan, S., ter Steege, H., Terborgh, J., Torello-Raventos, M., van der Heijden, G.M.F., Vásquez, R., Vilanova, E., Vos, V.A., White, L., Willcock, S., Woell, H. & Phillips, O.L. (2012) Tree height integrated into 809
pantropical forest biomass estimates. Biogeosciences, 9, 3381–3403.
Ferraz, A., Saatchi, S., Mallet, C. & Meyer, V. (2016) Lidar detection of individual tree size in tropical forests. Remote Sensing of Environment, 183, 318–333.
Gibbs, H.K., Brown, S., Niles, J.O. & Foley, J. a (2007) Monitoring and estimating tropical forest carbon stocks: making REDD a reality. Environmental Research Letters, 2, 1–13. Harms, K.E., Wright, S.J., Calderón, O., Hernández, a & Herre, E. a (2000) Pervasive
density-dependent recruitment enhances seedling diversity in a tropical forest. Nature, 404, 493–5.
Ho Tong Minh, D., Le Toan, T., Rocca, F., Tebaldini, S., Villard, L., Réjou-Méchain, M., Phillips, O.L., Feldpausch, T.R., Dubois-Fernandez, P., Scipal, K. & Chave, J. (2016) SAR tomography for the retrieval of forest biomass and height: Cross-validation at two tropical forest sites in French Guiana. Remote Sensing of Environment, 175, 138–147. IPCC (2006) 2006 IPCC Guidelines for National Greenhouse Gas Inventories, Prepared by the National Greenhouse Gas Inventories Programme, IGES. (ed. by H.S. Eggleston),
L. Buendia), K. Miwa), T. Ngara), and K. Tanabe) Japan, Japan.
Jucker, T., Bongalov, B., Burslem, D.F.R.P., Nilus, R., Dalponte, M., Lewis, S.L., Phillips, O.L., Qie, L. & Coomes, D.A. (2018) Topography shapes the structure, composition and function of tropical forest landscapes. Ecology Letters.
Jucker, T., Caspersen, J., Chave, J., Antin, C., Barbier, N., Bongers, F., Dalponte, M., van Ewijk, K.Y., Forrester, D.I., Haeni, M., Higgins, S.I., Holdaway, R.J., Iida, Y., Lorimer, C., Marshall, P.L., Momo, S., Moncrieff, G.R., Ploton, P., Poorter, L., Rahman, K.A.,
Schlund, M., Sonké, B., Sterck, F.J., Trugman, A.T., Usoltsev, V.A., Vanderwel, M.C., Waldner, P., Wedeux, B.M.M., Wirth, C., Wöll, H., Woods, M., Xiang, W., Zimmermann, N.E. & Coomes, D.A. (2017) Allometric equations for integrating remote sensing
imagery into forest monitoring programmes. Global Change Biology, 23, 177–190. Kearsley, E., de Haulleville, T., Hufkens, K., Kidimbu, A., Toirambe, B., Baert, G., Huygens,
D., Kebede, Y., Defourny, P., Bogaert, J., Beeckman, H., Steppe, K., Boeckx, P. & Verbeeck, H. (2013) Conventional tree height-diameter relationships significantly 837