AN
EXPERIMENTAL COMPARISONOF
SELECTION ALTERNATIVEST O PLATEAUED RESPONSE1
WM. P. BROWN2 AND A. E. BELL
Purdue University, Lafayette, Indiclnu 47907
Manuscript received September 7, 1978 Revised copy received July 3, 1979
ABSTRACT
Three a!teriiative selection methods for extending selection limits or breaking respome plateaus were compared over ten generations in a replicated model experiment using two unrelated populations of Drosophila melunoguster
that no longer responded to purebred selection for high egg number, a heterotic pclygenic trait. The three methods were: ( 1 ) reciprocal recurrent selection (RRS) with selection within each of the plateaued populations based solely
on crossbred performance, (2) a modification of reciprocal recurrent selection
( M R R S ) with selection within each population based on both purebred and crossbred performance, and (3) purebred selection within a new synthetic population formed by crossing the two plateaued populations.-Conflicting
estimates were obtained for heritability of purebred egg number in each of the plateaued populations. The realized heritability values and estimates from diallel analyses indicated a n absence of additive genetic variation for both populations; however, estimates from conventional intraclass correlation methods were positive. The diallel analyses revealed significant amounts of nonadditive gene effects for purebred egg number in each population, while the significant gene effects for crossbred egg numbers were additive. Estimates of the genetic correlation between purebred and crossbred egg number were negative (-0.85 iz 0.68 and -0.32 t 0.25) for the two base populations.-- All three alternatives to continued purebred selection gave significant responses, with the average gain per generation from MRRS being signifi- cantly superior to the other two methods. Observed purebred and crossbred responses under RRS were in agreement with quantitative genetic theory. Such was not the case for MRRS, which suggested the possibility of major gene segregation.-Evidence supparting a negative genetic correlation between purebred and crossbred performance and the possibility of overdomi- nance is presented and discussed.
PLATEAUS, or limits in selection response, are observed frequently in long- term selection studies. The prevailing experimental material for such studies has been Drosophila melanagaster, and the selected traits, bristle number and wing length, are not directly associated with reproductive fitness (PAYNE 1920; MATHER 1941 ; ROBERTSON and REEVE 1952; SCOSSIROLI 1954; RASMUSON 1955;
Journal Paper Number 7079 of Purdue University Agricultural Experiment Station. Supported by National Science
Present address: Department of Biology, Marietta College, Marietta, Ohio. Foundation Grants G-5485, G-17649 and GB-4Q3.
478 W. P. BROWN AND A. E. BELL
CLAYTON and ROBERTSON 1957; LATTER 1970). In all of these reports, a limit or
plateau in selection response was accompanied by reduced fitness.
Components of fitness and their response to selection have not been studied ex- tensively. In three independent model experiments with Drosophila in which artificial selection was practiced for the fitness trait “egg number”
(BELL, MOORE
andWARREN
1955; RASMUSON 1956;KOJIMA
and KELLEHER 1963), limits in response were observed without a noticeable decline in fitness. The impact of natural selection for fitness in these experimental populations was not delineated. Further studies, both experimental and theoretical, on the interplay between artificial and natural selection is obviously needed (ROBERTSON 1969).The genetic bases for selection limits will undoubtedly vary, depending on the trait selected and the nature of the genetic variation.
To
avoid response plateaus or, at the least, to extend the limits of selection, it is important to discriminate among such limiting causes as physiological ceilings, genetic polymorphisms, negative genetic correlations between selected traits or between a selected trait and reproductive fitness, absence of genetic variation due to homozygosity and exhaustion of additive gene effects. The last was found to be the case for aDro-
sophila population plateaued for egg number, even though significant nonaddi- tive gene effects were present(BROWN
andBELL
1961).Selection methods designed specifically to exploit nonadditive genetic varia- tion due to either dominance or epistasis (e.g., reciprocal recurrent selection. as proposed by COMSTOCK, ROBINSON and
HARVEY
1949), provide a theoretical alternative to response plateaus. A recent review(BELL
andMOORE
1972) of the experimental evaluation of such methods suggested the following alternatives to continued purebred selection within plateaued populations: ( 1 ) reciprocal re- current selection between plateaued populations with selection based on cross- bred performance, (2) modified reciprocal recurrent selection with selection based on both purebred and crossbred performance, and (3) selection on pure- bred performance within new heterogeneous populations originated by the crossing of existing plateaued populations. The present study evaluates these three alternatives over ten generations in a replicated experiment with two un- related populations of Drosophila that had plateaued in response to purebred selection for high egg number.MATERIALS AND METHODS
The basic genetic material for this study was two unrelated plateaued populations (R and T) of Drosophila melanogaster developed in our laboratory by some 4 0 generations of within- line selection for high individual egg number. Genetic markers, ebony (e) for R and poliert
(spapol) for T, had been incorporated in the base populations to protect the integrity of pedigree in both purebred and crossbred matings. Inbreeding had been minimized to some degree by reproducing each population from ten or more families each generation and by the avoidance of full and half-sib matings. Population R was described in our earlier studies (BELL,
MOORE
and WARREN 1955; BROWN and BELL 1961). Population T was synthesized from four laboratory stocks unrelated to R and was developed specifically for the present study by individual selection for high egg number. In order to eliminate lethal and sterility genes from each population andSELECTION IN P L A T E A U E D P O P U L A T I O N S 479
inversion technique (BROWN and BELL 1961). Prior to the selection phase, six random isogenic lines within each set ( R or 7') were systematically intercrossed to reconstitute the R and T populatj ons
.
The measured variable throughout this study was the number of eggs oviposited by a single, mated female in two consecutive 24-hour periods. A half-pint bottle served as the oviposition chamber with the female laying her eggs on a button of medium (water, agar, banana and powdered charcoal) attached to the bottle cap and seeded with yeast. The measurements were taken during the peak of oviposition, beginning on the fifth day and continuing through the seventh day after eclosion. All means and standard deviations are presented on the basis of daily (24-hour) egg number.
The experimental flies were held in a climate-controlled room at 25", with 12 hours of white fluorescent light daily and at approximately 70 percent relative humidity.
PARAMETERS O F BASE P O P U L A T I O N S
Pullebred and crossbred performance
The levels of performance for populations R and
T
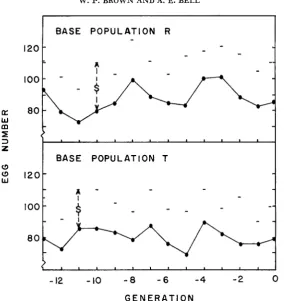
during the 14 generations immediately preceding the present study are shown in Figure 1. During this pre- liminary period, mass selection was applied to maintain the populations in equi- librium state. Effective selection differentials(8)
each generation were as shown graphically. Control populations were not observed during this phase. Overall,R
showed a slightly positive but nonsigrdicant trend (0.58 eggs per generation), while T exhibited a nonsignificant negative response (-0.15). Since R had been plateaued for an earlier period of 30 generations under controlled conditions(BELL,
MOORE andWARREN
1955), the nonsignificant positive trend most likely reflects chance environmental fluctuations. These static responses to long-term selection, even though selection differentials were large, typify plateaus for fit- ness traits. The mean performances during these preliminary generations were 87.4 and 80.6 eggs forR
and T , respectively.Reciprocal crossbreds of the two populations were on the average 21 .O percent superior to the midparental value. Eight replications of concurrent measurements in purebreds and crossbreds are given in Table 1. This significant heterosis ob- served for crossbred Performance reflects the genetic diversity existing between these populations in terms of nonadditive gene loci influencing egg number.
Heritability of purebred egg number, h,2
Estimates of hp2 for R and T were obtained by: (1 ) a modified diallel analysis using single crosses among the isogenic lines from which each base population was reconstituted, (2) analysis of variance within and among isogenic lines, and
(3) conventional intraclass correlations among full- and half-sibs.
Modified diallel analysis: GRIFFING (1956) presented a generalized treatment for the use of diallel crosses for obtaining unbiased estimates of genotypic vari- ance in a random mating population. In the absence of epistatis effects, the com- ponent of variance for general combining ability, u ' ~ . ~ . ~ . , is unbiased and equals
480 W. P. BROWN A N D A. E. BELL
BASE POPULATION R
-
-
-
..
-
-
A
I20
I " ' " " " " '
I
BASE POPULATION TC " " " " " "
-12 -10 - 8 - 6 - 4 - 2 0
G E N E R A T I O N
FIGURE 1.-Observed responses and selection differentials (S) in populations R and T over the 14 generations preceding this experiment.
where u ~ ~ , ~ , ~ . and ue2 are the components of variance for specific combining
ability and individual environmental error effects, respectively, up2 is the pheno- typic variance.
Following GRIFFING'S model, all possible single crosses including recip- rocals were made within each of the R and T sets of isogenic lines. Five daugh- ters from each cross were measured for egg number in each of three replications. One T isogenic line had few or no off spring in several crosses and was excluded from the statistical analysis.
SELECTION I N PLATEAUED POPULATIONS
TABLE 1
Purebred and crossbred egg numbers for the R and T base populations
48 1
Replication 1 2 3 4 5 6 7 8 Mean
__
R Mean daily egg T number96.8 92.4 91.1 90.2 79.4 98.4 84.7 88.0 90.1 82.3 79.8 78.6 81.2 86.9 78.2 69.6 77.4 79.2 Cross 107.4 101.6 104.7 101.2 103.2 109.2 90.8 102.0 102.5 Heterosis' 19.8 18.0 23.5 18.1 24.0 23.7 17.7 23.3 21.0
* Percent increase in the crossbreds above the midparent. The approximate standard error for each mean is 2.2 eggs.
tuted into ( l ) , hp2 estimates of -0.12
*
0.06 and 0.14 k 0.23 were obtained for populations R andT ,
respectively.Analysis of inbred performance: Under the assumptions of additive gene ac- tion and no selection among isogenic lines,
LERNER
(1958) showed that the vari- ance among isogenic lines estimates twice the additive genetic variance in the random mating population from which the isogenic lines were extracted, and the phenotypic variance within lines estimates the environmental variance. This method gavehp2
estimates of 0.08 -C 0.06 and 0.10 4. 0.10 for R and T , respec-tively. Since the previous analysis (Table 2) had revealed significant nonaddi- tive gene effects in both populations, these h," estimates from inbred performance would theoretically be biased upward. Consequently, their small values relative to their standard errors tend to support the previous conclusion that additive genetic variance for purebred performance had been exhausted in the base populations.
Zntraclass correlations: Within each base population, random samples of males and females were mated, each male individually with two virgin females. The
TABLE 2
Diallel analysis of purebred egg number from intra-population single crosses
SouFce of vananon Crosses GCA SCA Reciprocal Error
Population R
Degrees of Mean freedom muare
Population T
Degrees of Mean
freedom square
29 268.9 5 112.1 9 492.9* * 15 186.8 60 166.3
19 316.0** 4 643.6 5 388.0* 10 14Q.O
40 137.2
482 W. P. BROWN A N D A. E. BELL
fecundated females were subsequently placed in individual culture bottles and five daughters from each were measured for egg number. Data from eight repli- cations of this hierarchial design were obtained on a total of 129 sire families for
R
and 98 forT.
Analyses of variance were pooled over replications to provide weightedhp2
estimates of 0.33 +- 0.20 and 0.48 +. 0.20 for R and T , respectively, calculated from the ratio of four times the sire component of variance to the total phenotypic variance.These large
hp2
estimates are inconsistent with the results from the diallel analysis (Table 2), the analysis of inbred performance, and the lack of response to selection as observed in Figure 1. Since daughter-within-sire families were ob- served in a systematic sequence rather than completely randomized, the hy- pothesis of some unknown common environmental effect being confounded with sire families is the most plausible explanation.For predictive purposes, the above three estimates were averaged (weighting each with its variance) to yield hp2 values of 0.002 +- 0.04 for
R
and 0.1 7 0.08for
T.
Despite the conflicting evidence of additive genetic variation for purebred egg number in both base populations, the refractory responses to mass selection indi- cated an exhaustion of “utilizable” genetic variation. LERNER (1958) suggested that the effective depletion of disposable additive genetic variance, as judged by selection response rather than by statistical estimates. justifies alternative meth- ods of selection.
Heritability of crossbred egg number, hC2
Information regarding the heritability of crossbred egg number in
R
when crossed with T , and in T when crossed to R, is essential for the prediction ofcrossbred response under the two alternative methods which continued
R
and Tas distinct populations. Estimates of
hc2
were obtained by: (1) a modified diallel analysis using inter-population single crosses, and (2) intraclass correlations among crossbred full and half sibs.Modified diallel analysis: Inferences about the genotypic variance for cross-
bred egg number for R and T populations were made from an analysis of inter- population single crosses among R and
T
isogenic lines, following the model ofGRIFFING (1958). Five daughters from each single cross, including reciprocals, were measured for egg number in each of three replications. The reciprocal crosses were analyzed separately on a mean basis as shown in Table 3.
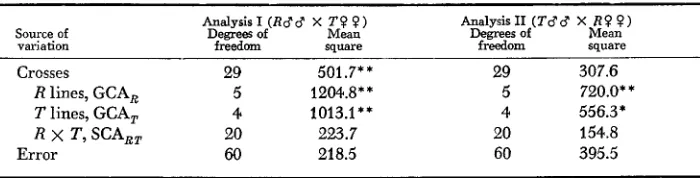
The significant GCA estimates observed here for both R and T lines are of special interest in that they reveal significant amounts of additive genetic vari- ance for crossbred performance ( u 2 d c ) within both
R
and T in contrast to thenonsignificant GCA estimates observed previously f o r purebred performance. Apparently, nonadditive gene effects for purebred egg number acted additively in crossbreds.
SELECTION IN P L A T E A U E D P O P U L A T I O N S 483
TABLE 3
Diallel analysis of crossbred egg number from inter population single crosses,
reciprocds analyzed separately
Source of variation
Analysis I (Rdd X TQ 9 ) Degrees of Mean
freedom square
Analysis11 (Tdd X R??)
Degrees of Mean freedom square
Crosses 29 501.7**
R lines, GCA, 5 1204.8**
T lines, GCA, 4 1013.1**
R X T, SCAR, 20 223.7
Error 60 218.5
29 307.6 5 720.0* * 4 556.3* 20 154.8 60 395.5
* Significant at the 0.05 level of probability.
* * Significant at the 0.01 level of probability.
where u ~ ~ . ~ . ~ . was the GCA component of variance from Table 3 specific for R or T lines, and the other components were as previously defined. Again, the “Error” components were adjusted to an individual basis. When Analyses
I
and I1 were combined, the resulting hC2 values were 0.09 f 0.04 and 0.06 f 0.03 for popula-tions Rand T , respectively.
Zntraclass correlations: In addition to the
R
andT
pedigreed matings made to estimate hP2, individual random males from both populations were simultane- ously mated to two virgin females from each population to produce both cross- bred and purebred full- and half-sib progenies. From each dam, five daughters were measured as previously described for egg number. Data were collected from four replications of such matings. Those sires without both purebred and cross- bred daughters were excluded from the statistical analyses. As a consequence, the number of sire progenies per population and replication varied from a low of six to a high of 26, with a total of 66 for R and 54 for T.Estimates of
hc2
from the intraclass correlations among crossbred progenies were consistently greater than unity. The systematic bias in the sire component suggested for the previous purbred matings was apparently present to a greater degree in these crossbred data, and the resulting h2 values are not comparable.For
subsequent predictions of crossbred responses, the unbiased hC2 estimates from the modified diallel analyses were used.Genetic correlation between purebred and crossbred egg numbers, rA
484 W. P. BROWN A N D A. E. BELL
bred performance. For this to occur, a high positive genetic correlation between purebred and crossbred performance is essential.
For estimating this genetic correlation, data on the purebred and crossbred sire progenies described in the previous section were subjected to analyses of variance and covariance for the traits purebred egg number and crossbred egg number. The four replications of matings were analyzed separately for each population to provide eight independent estimates of rA as
where Cov,, is the sire component of covariance between purebred egg number and crossbred number, u p and uC are the square roots of the sire components of variance f o r purebred and crossbred performance, respectively.
Even though the U, and U , components were known to be inflated, the cause of
this bias was not identified and its influence on Cov,, and rA is not certain. If a common environmental effect influenced alike both purebred and crossbred progenies of any sire (a reasonable expectation in view of the experimental pro- cedures) the Covpc term would be biased in the positive direction, as was U, and uc, and the ratio rA would be unbiased. If these common environment effects were uncorrelated, the expected Cov,, would be unaffected; but the absolute size of the rA estimates would be reduced due to the inflated U, and U, components.
It
seems most unlikely that these common environmental effects could have been negatively correlated. Nevertheless, six of the eight rA estimates were negative, and the average values for R and T were -0.85 2 0.68 and -0.32
*
0.25, respec-tively. This evidence of a negative genetic covariance between purebred and crossbred performance is of special interest as a possible indicator of overdom- inance and as a predictor of divergent purebred-crossbred selection responses (MCNEW and BELL 1971). It was confirmed by realized values to be presented below.
SELECTION RESPONSE
The three alternative methods for selection evaluated here were: ( 1 ) Recip- rocal Recurrent Selection (RRS)
,
using populations R and T with selection each generation based solely upon half-sib crossbred performance; (2) Modified Reciprocal Recurrent Selection ( M R R S ) , again usingR
andT,
but with selec- tion based on both purebred and crossbred performance; and (3) Purebred Selec- tion ( P S ) on individual purebred merit within a new synthetic population RTSELECTION IN P L A T E A U E D P O P U L A T I O N S
485
mental populations. This means of the experimental populations were adjusted for environmental fluctuations each generation by the mean deviation of the controls from their overall response trend.
Reciprocal recurrent selection, RRS
Pedigreed reciprocal crosses between R and T were made to initiate RRS.
Twenty males from each population were individually mated to four randomly chosen virgin females from the other population. After 48 hours, in the cross- bred mating each male was remated to three randomly chosen, nonsib virgin females from his own population to propagate the purebred population. Five of the crossbred daughters from each sire were measured for egg number. For selec- tion, the 20 purebred sire families within each population were ranked accord- ing to the performance of their crossbred half-s bs, and the top four, or 20%, were selected to represent each population in the next cycle of selection. As before, twenty males (five taken at random from each of the selected sire fam- ilies) from each population were progeny tested for crossbred egg number and reproduced purebred.
Crossbred response: The
RRS
response of primary concern is that of crossbred egg number. In terms of heritable effects with predictable response, the variance among purebred sires for crossbred combining ability was translated in a n earlier selection to the additive scale and reported as heritability of crossbred egg num- ber. Thus, the crossbred response under RRS became predictable. (SeeGRIFFING
1962 for basic theory).The prediction equation has two complementary parts. The first, R / T , rep- resents the genetic gain AGcR i n Population R, resulting from the selection among
R
purebred sire families with the selection criterion being the mean of sire’s crossbred progeny. The second, T / R , arises from the reciprocal genetic gain, A G C , i n Population T . Thus, the expected crossbred response, Rc,,,, for each cycle ofPRS
isRcrrs = 1
/2
( AGcR+
AGcT)COV
(GcT,P c )
AP,l R / T
+
112[
l T / R’
COV (GCE, P c ) AP,U2-
p e
= 1/2
[
where GCE is the additive genotypic value for crossbred performance in R pure- bred sire families,
I‘,
is the selection criterion, APc is the selection differential, and U? is the phenotypic variance of sire’s crossbred progeny means. Theparameters for T / R are similarly defined. Since the covariance term f o r each population is known to equal one-fourth of the additive genetic variance (plus a bit of the additive by additive interaction) for the selected trait, the above equation can be written
p c
-
486
120
W. P. BROWN AND A. E. BELL
R R S C R O S S B R E D S
e-. Rep I
.--*
" 2-
5
110f
100m z
W 9 0
W
W
80
7 0
0 I 2 3 4 . 5 6 7 8 9 ' 1 0
G E N E R A T I O N
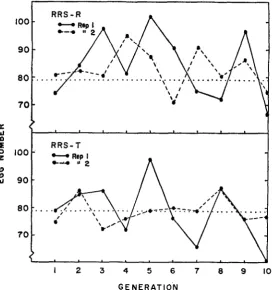
FIGURE 2.- Observed RRS Crossbred responses.
where hZ is the heritability of the-selection criterion,
i
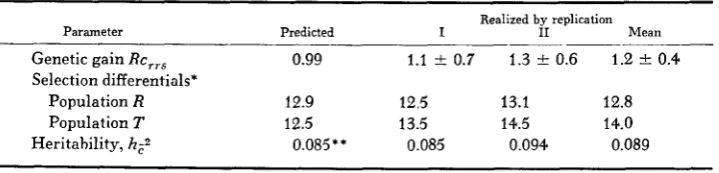
is the selection intensity and U- is the standard deviation of sire progeny means.The observed RRS crossbred response for each replication is showE graphically in Figure 2. The responses were erratic, as characteristic of other Drosophila studies involving egg number, even though generation means had been adjusted for environmental fluctuations as detected by the controls. From the predicted and realized parameters summarized in Table 4, it is evident that similar overall responses were observed in the two replications. The average genetic gains per generation agreed well with the theoretical prediction (4). The observed selec- tion differentials also agreed well with those predicted. As a consequence, the realized heritabilities of crossbred performance closely agreed with the esti- mated
h:.
Since crossbred response resulted from complementary genetic gains in R and T , the calculated realized heritabilities of Table 4 relate to both popula- tions and are, in fact, the average.The above results suggest that RRS provides a n effective alternative to the
C
PC
TABLE 4
RRS predicted and realized parameters for crossbred egg number
Parameter
Realized by replication
Predicted I I1 Mean
Genetic gain R C , , . ~ 0.99 1.1 k 0.7 1.3 ? 0.6 1.2 0.4
Selection differentials*
Population R 12.9 12.5 13.1 12.8
Population T 12.5 13.5 14.5 14.0
Heritahility, hzz 0.085 * * 0.085 0.094 0.089
* No. of eggs/day/generation.
SELECTION I N PLATEAUED POPULATIONS 48 7
response plateaus that existed previously in these populations when selection was based on purebred performance. In other words, the significant nonadditive gene effects for purebred performance (Table 2 ) became additive for crossbred performance (Table 3) and responded to RRS.
Purebred response: When selection is based on a trait of crossbred progeny,
as was the case for
RRS,
traits of the purebred must be considered as different, and they may or may not be genetically correlated to the selected trait. The expected correlated response in purebred egg number, CR,, for each population underRRS
iswhere the various parameters are as previously defined and are specific to
R
or7'. Since the rA estimates were negative, the predicted correlated purebred re- sponses were negative for both populations.
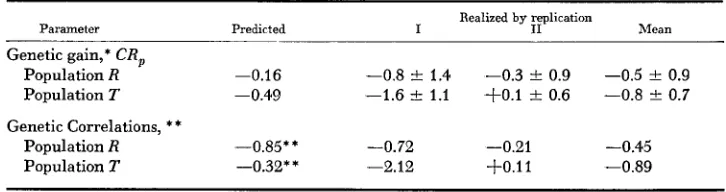
The correlated purebred responses, determined each generation by measuring egg number for 30 to 50 purebred €emales from each population, are shown in
Figure 3. Average genetic gains, calculated as the linear regression of response
1 2 3 4 5 6 7 8 9 IO
G E N E R A T I O N
488 W. P. BROWN A N D A. E. BELL
on generation of selection, had large sampling errors as a result of the large fluctuations observed between generation means. Nevertheless, the overall trends were negative as predicted from the initial parameters (Table 5 ) . I n turn, the realized genetic correlations,
I,,
estimated aswhere A G ~ is the observed purebred response and AGc is the observed direct crossbred response (assuming that R and T contributed equally) and listed in Table
5 ,
were mostly negative and agreed with the intitial estimate of a negative genetic correlation between purebred and crossbred performance.Modified reciprocsl recurrent selection, MRRS
The MRRS scheme involved selection based on both purebred and crossbred performance. Specifically, the design represented two-stage selection with inde- pendent culling levels for: ( 1 ) purebred egg number (individual basis), and (2) crossbred daughters’ egg number (progeny test). For comparison, the cross- bred stage was observed simultaneously with alternate generations of the other methods.
The initial generation of MRRS was identical with the first generation of RRS. Each of the four selected purebred families, R and T taken separately, was sub- divided for MRRS and expanded by mass transfer into five new culture bottles. From each of the resulting 20 cultures. five randomly chosen female offspring (for a total of 100) were measured individually for purebred egg number. The
20 females with the highest egg number were selected (along with their nonsib mates) and placed in new culture bottles to produce 20 purebred families. This completed the first stage of MRRS. For the second stage, the same 20 females selected in stage one were remated to random males from the reciprocal popula- tion ( R or T ) in order to progeny test these females for crossbred egg number. Two males were used in each of these matings to assure fertility. Any purebred off spring arising from the dam’s previous insemination were detected by the genetic markers. Five crossbred daughters from each of the 20 dams were meas-
TABLE 5
RRS predicted and reilized parameters for purebred egg number
Parameter
~~~~~
Realized by replication
Predicted I I1 Mean
Genetic gain,* CR,
Population R -0.16 -0.8
-+
1.4 -0.3*
0.9 -0.5*
0.9Population T -0.49 -1.6 k 1.1 + O . l f 0.6 -0.8 0.7 Genetic Correlations, * *
Population R -0.85** -0.72 -0.21 -0.45
Population T -0.32** -2.12 + O . l l -0.89
* No. of eggs/day/generation.
SELECTION I N PLATEAUED POPULATIONS 489
ured for egg number. The second stage of MRRS was completed when four, or
20%, of the 20 purebred families were selected on the basis of this crossbred progeny-test. The resulting four families ( R or
T )
were again expanded into20 new cultures from which the next cycle of MRRS was initiated.
The selection cycles of the three different methods were synchronized so that the experimental populations in each replication were observed simultaneously. Two reproductive generations were required to complete one cycle of MRRS.
Therefore, the crossbreeding phase of selection was actually practiced for only five generations.
The major difference between MRRS and
RRS
methods was the purebred selection in MRRS that preceded each cycle of crossbred selection. Also, the crossbred selection of MRRS involved dam testing in contrast to the sire testingof RRS.
A selection scheme designed to improve purebreds as well as crossbreds has obvious practical significance. A breeder must maintain sufficient fecundity in the purebred parental lines not only to reproduce the purebred lines themselves, but also to produce the commercial crossbred efficiently.
Crossbred response: Genetic gains expected under the MRRS scheme were predicted by the two-stage selection theory of YOUNG and
WEILER
(1960). The two selection criteria specifically considered here were the dam’s own purebred egg number ( p ) and the average crossbred egg number ( c ) of her progeny.The prediction of crossbred response again consists of two complementary parts, genetic gains (AGc) in both R and T with each resulting from two-stage selection. For example, the genetic gain in R can arise indirectly from purebred selection ( R / R ) and directly from crossbred progeny test ( R / T )
.
The reciprocal gains in T are identified as T / T and T / R . The expected crossbred response,Rcmrrs, for each cycle of MRRS selection becomes
where bP2 is the ratio C O V ~ ~ ~ ~ / U ~ ~ U ~ , - and r p is the phenotypic correlation he- tween the two selection criteria whose respective heritabilities are hP2 and hC2. I n view of the negative genetic covariances between purebred and crossbred egg numbers estimated for both R and T. genetic gains expected from selection at one stage would tend to be reversed by selection practiced at the second stage.
In
our specific case, the net Crossbred response expected under MRRS was f 0 . 7eggs per cycle of selection.
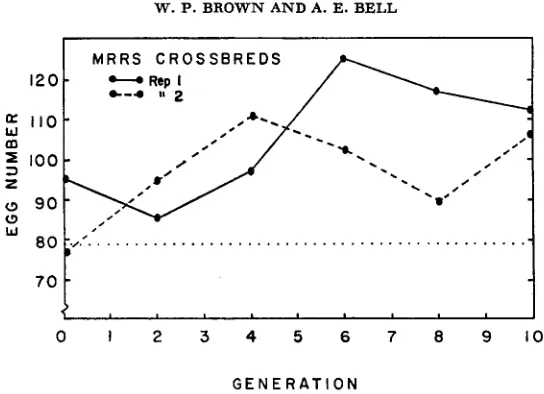
The observed crossbred responses as shown in Figure 4 were generally positive in spite of sizable fluctuations from cycle to cycle. The overall responses were
3.0
*
1.4 and 1.8 -t 1.4 eggs per cycle of selection for replications I and 11. respec-490 W. P. BROWN AND A. E. BELL
120
fK 110 m
W
5
100 z(3 90
80
(3
W
M R R S C R O S S B R E D S
. . .
D
0 1 2 3 4 5 6 7 8 9 1 0
G E N E R A T 1 O N
FIGURE 43.-Observed MRRS crossbred responses.
I n view of the negative genetic correlations between purebred and crossbred egg number that were estimated initially and subsequently realized for RRS, this greater crossbred response under MRRS than that observed under RRS was indeed surprising. It is interesting to note that if one makes either of the unlikely assumptions that: (1 ) the actual genetic correlation was zero, or ( 2 ) the genetic correlation under MRRS changed over generations from negative to positive due to the rapid changes in the frequencies of a few major genes with an aver- age zero correlation, the expected crossbred response would have been positive, but much less than that actually observed. The validity of these assumptions regarding the genetic correlation can be tested in a practical sense by examining
the MRRS purebred responses.
Purebred response: Egg number in the MRRS purebreds was influenced directly by individual selection f o r purebred egg number and indirectly by the second-stage progeny test for crossbred egg number. The expected purebred response. RpBLVrS in R under MRRS is
where symbols are as prwiously defined. Appropriate parame<ers for
T
were iised for predicting its purebred response. The predicted genetic gains in pure- bred egg number per MRRS cycle were -0.59 eggs in R and 0.60 inT.
Thepositive prediction for
T
arose primarily from the initial h,,2 estimate of 0.17, Rn unrealistically large value for a plateaued population.The observed purebred responses for R and T are shown i n Figure 5 . Genera- tion-to-generation fluctuatiocs were much less than for the RRS purebreds. Larger sample size is the most likely reasoii for this uniform response. Of greater significance is the fact that all populations showed negative responses. The aver-
SELECTION I N PLATEAUED POPULATIONS 49 1
90
80
70
W
W
w
-
-
-
4 Rep I
---a It 2
l o o t M R R S - R
100
90
M R R S - T
-
R?;
-
-Y
. . . . , . . .
.
..
.. . . .
. . .. .
.. .
. . .. .
. . . . ..
- _
e--
-
-.
--t
_ - -
-
--
.
'.---'.
I 2 3 4 5 6 7 6 9 IO
G E N E R A T I O N
FIGURE 5.-Observed MRRS purebred responses.
and that for the two T populations was similar, -0.7 +- 0.6 eggs. Since MRRS
involved selection f o r both traits, the realized genetic correlation between them cannot be calculated. Yet, the effective genetic correlations must have been nega- tive in view of the negative purebred responses that accompanied the positive MRRS crossbred responses.
These MRRS purebred responses are in agreement with the previously described RRS finding that the genetic correlation between purebred and cross- bred egg numbers was in fact negative. Yet, the surprisingly large MRRS cross- bred responses remain unexplained.
Purebred selection, PS
Purebred selection based on individual merit within a new synthetic popula- tions RT was the third alternative to be evaluated experimentally in this study. Population RT was formed by reciprocally crossing R and T in 150 single pair matings and reproduced thereafter by inter se matings. Two hundred females, five randomly chosen from each of 40
F,
cultures, were individually mated to492 W. P. BROWN A N D A. E. BELL
E
110 m=
100(3 90
80
3
z
(3
w
7 0
t
0 I 2 3 4 5 6 7 8 9 I O
G E N E R A T I O N
FIGURE 6.--Observed responses to individual purebred selection (PS) in the new synthetic population RT.
This scheme for selecting the top 20% was repeated in each subsequent generation.
In view of the obvious genetic disequilibrium expected for RT in the
F,
generation, no effort was made to estimate the initial genetic parameters. Never- theless, purebred selection applied toRI'
was considered a worthy alternative since new genetic variation from segregation could be anticipated. The observed purebred responses inRT
are shown in Figure 6. The two replications gave similar overall gains of about 15 percent over the original limits reached for the base populations. The selection intensities averaged 1.2 standard deviations per generation, and the realized heritabilities of 0.05 and 0.06 were calculated from average gains of 1.7 f 0.8 and 1.8 f 0.2 eggs per generation in replicationsI and 11, respectively.
DISCUSSION
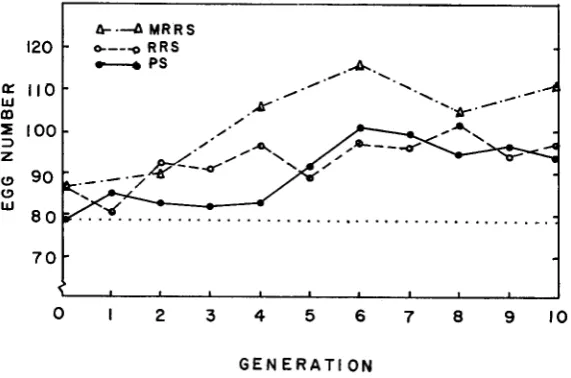
More effective breeding and selection techniques for the improvement of
heterotic traits in economic animal and plant species have been a long-time goal in quantitative genetics. Many of today's improved strains and varieties no longer respond to conventional within-line selection (i.e., yield in maize, egg production in chickens and litter size in swine) even though demonstrable genetic variation remains within each population. While many commercial breeders are crossing highly improved strains (or derived inbred lines) to pro- duce elite hybrids, effective selection techniques for utilizing within-line non- additive genetic variation are not clearly established from either the theoretical or experimental viewpoints.
SELECTION I N PLATEAUED POPULATIONS 493
the heterotic trait egg number. The alternatives were: (1)
RRS
based on cross- bred performance, ( 2 )MRRS,
a modification featuring both purebred and crossbred selection, and ( 3 ) PS, individual selection on purebred performance within a new synthetic formed by crossing the two plateaued populations. For an overall comparison of these alternatives, the two replications were combined and average responses over generations are shown in Figure 7. All three methods succeeded in varying degrees in extending the previously observed selection limits or response plateaus.In theory,
RRS
and PS were least likely to yield similar responses. The former should exploit nonadditive gene affects present in the plateaued populations, while response for purebred PS selection would depend on additive gene effects in the new synthetic population. In this study, similar overall responses were observed for these two alternatives. A marked increase in egg number occurred for PS between the fourth and sixth generations of selection with apparently no further improvement. The averageRRS
crossbred response was positive, more or less continuous over the total test period, and agreed closely with that predicted from quantitative genetics theory.The observed declines in purebred egg number under
RRS
were predicted by the initial estimates of a negative genetic correlation between purebred and cross- bred egg numbers. However, inbreeding depression, per se, may have contributed in some degree to the purebred declines. The effective number of breeders was sufficiently small that one could theoretically expect inbreeding to increase some3 4 % each generation. MARTIN and
BELL
(1960) found an average decline of0.36 eggs for each percent of inbreeding in an unrelated Drosophila population under selection for body weight, a trait not directly related to fitness. However, the previous selection histones of the base populations must be reconciled with the inbreeding depression hypothesis. Each population had been closed for more
120
0: 110
m 100
W
3
z
90
(3
w 8 0
b . 4 M R R S
c--. p s
-
+ - - - R R S'7 .- .-
e
.
. . . .
i
...
7 0
:
0 I 2 3 4 5 6 7 8 9 IO
G E N E R A T l ON
494 W. P. BROWN A N D A. E. BELL
than 40 generations and reproduced with a relatively small number of effective breeders. Theoretically, the long history of directional selection plus random gene drift should have caused a high degree of homozygosity, unless the selec- tion for high purebred egg number had in fact favored heterozygotes. The latter case would be consistent with the observed significant amounts of nonadditive genetic variance within each of the plateaued base populations.
These results are similar in many aspects to results from earlier
RRS
selection experiments involving the fitness component, egg number (BELL, MOORE andWARREN
1955; RASMUSON 1956;KOJIMA
and KELLEHER 1963), except that previous studies were initiated from unselected rather than plateaued popula- tions. Nevertheless, these previous investigators observed plateaus in response to purebred selection that were eventually surpassed byRRS.
None of the earlier studies reported a negative genetic correlation between purebred and crossbred performance.RASMUSON
(1956) suggested that the small advantage she found forRRS
over purebred selection may have resulted from a scarcity of overdominant loci and/ or epistatic interactions. The existence of significant nonadditive gene effects was shown clearly for the base populations of the present study, and the negative genetic correlation we found between purebred and crossbred performance indi- cates overdominance, according toBOWMAN
(1960). However, MCNEW andBELL (1
971 ) demonstrated that a negative genetic correlation need not neces- sarily signify overdominance since it can result from certain types of epistasis. In either case, the declines observed here in purebred performance would have been expected to accompany any improvement inRRS
crossbred performance.When purebred and crossbred selection were combined in the
MRRS
scheme, an unexpectedly large crossbred response was observed in early generations for both replications with peak levels of performance nearly one standard deviation above the other two methods. This result is surprising in view of the consistent negative genetic correlation observed between purebred and crossbred perfor- mance. WithMRRS
selection operating at a slower pace due to alternate genera- tions of mass mating, recombination would have been facilitated; however, this does not provide a convincing explanation. Sharp increases in the frequencies ofa few major “plus” genes is equally unsatisfying since the performance of
MRRS
purebreds actually declined. The single unique aspect ofMRRS
was that dams rather than sires were progeny tested for crossbred performance. Consequently, the hypothesis that genetic gain in crossbreds was due to a heterotic genetic maternal effect would be compatible with the observed results. This maternal effect would of necessity be specific to the hybrid o r crossbred progeny since allMRRS
purebreds actually declined in performance.SELECTION IN P L A T E A U E D P O P U L A T I O N S 495 that increase egg formation, ovulation rate or other physiological aspects of egg number in purebreds would
be
expected to act positively in crossbreds, and the genetic correlation would be positive. However, the frequencies of these genes in the purebred and crossbred populations would differ, and gene frequency changes alone can change this genetic correlation from positive to negative in the case of overdominant loci or nonadditive epistatis combination (MCNEW
andBELL
1971).Despite the strong evidence presented here f o r a negative genetic correlation between purebred and crossbred performance, the phenomenon should be investi- gated more critically so that the confounding effects of inbreeding depression per se is removed. It is fundamental to delineate between a decline in purebred performance due to the random fixation of deleterious recessive genes by drift, i.e., classical inbreeding depression, and a decline due to the fixation by
RRS
of complementary alleles at heterotic loci in the two purebred populations. The latter is predicted by a negative genetic correlation between purebred and cross- bred performance independent of genetic drift.
L I T E R A T U R E CITED
BELL, A. E. and C. H. MOORE, 1972 Reciprocal recurrent selection for pupal weight in
Tribolium in comparison with conventional methods. Egyptian J. of Genet. and Cytol. 1: 92-1 19.
The evaluation of new methods for the improvement of quantitative characteristics. Cold Spring Harbor Symp. on Quant. Biol.
20: 197-212.
BOWMAN, J. C., 1960 Recurrent Selection. I. The detection of overdominance. Heredity 14:
197-206.
BROWN, W. P. and A. E. BELL, 1961 Genetic analysis of a "plateaued" population of D . met- anogrrster. Genetics 46: 407-4325.
CLAYTON, G. A. and A. ROBERTSON, 1957 An experimental check on quantitative genetical theory. 11. The long-term effects of selection. J. Genetics 55: 152-170.
COMSTOCK, R. E., H. F. ROBINSON and P. H. HARVEY, 1949 A breeding procedure designed to make maximum use OI both general and specific combining ability. Agron. J. 41: 360-367. GRIFFING, B., 1956 Concept of general and specific combining ability in relation to diallel
crossing systems. Aust. J. Biol. Sci. 9: 463-493. -- , 1958 Application of sampling variables in the identification of methods which yield unbiased estimates of genotypic variance components. Aust. 5. Biol. Sci. 11: 219-245. - , 1962 Prediction formulae for general combining ability selection methods utilizing one or two random populations. Aust. J. Biol. Sci. 15: 650-665.
KOJIMA, K. and T. M. KELLEHER, 1963 A comparison of purebred and crossbred selection schemes with two populations of Drosophila pseudoobscura. Genetics 48: 57-72.
LATTER, B. D. H., 1970 Selection for a threshold character in Drosophila. 111. Genetic control of variability in plateaued populations. Genet. Res. 15: 285-300.
LERNER, I. M., 1958
MARTIN, G. A. and A. E. BELL, 1960 An experimental check on the accuracy of prediction of response during selection. pp. 178-187. In: BiometricaZ Genetics. Edited by 0. KENIPTHORNE. Pergamon Press, New York.
BELL, A. E., C. H. MOORE and D. C. WARREN, 1955
The Genetic Basis of Selection. John Wiley and Sons, New York.
496
MCNEW, R. W. and A. E. BELL, 1971 The nature of the purebred-crossbred genetic covariance. Genet. Res. 18: 1-7.
OROZCO, F. and A. E. BELL, 1974 Reciprocal recurrent selection compared to within-strain selection for increasing rate of egg lay of Tribolium under optimal and stress conditions. Genetics 77: 143-161.
Selection for high and low bristle number in a mutant strain "Reduced." Genetics 5: 501-542.
Selection for bristle numbers in some unrelated strains of Drosophila melanogaster. Acta Zoologica Bd. XXXVI, pp. 1-49. ___ , 1956 Recurrent reciprocal selection. Results of three model experiments on Drosophila for improvement of quantita- tive characters. Hereditas 42 : 397-414.
ROBERTSON, A., 1969 The theory of animal breeding. Proc. XI1 Inter. Genetics Cong. Vol. 2: 9. ROBERTSON, F. W. and E. C. R. REEVE, 1952 Studies in quantitative inheritance. I. The effects
of selection of wing and thorax length i n D . melanogaster. J. Genetics 50: 414-448.
SCOSSIROLI, R. E., 1954 Effectiveness of artificial selection under irradiation of plateaued popu- lations of D . m e h o g a s t e r . IUBS Symposium on Genetics of Population Structure, Series B. Pavia, Italy. Pp. 105-121.
YOUNG, S. S. Y. and H. WEILER, 1960 Selection for two correlated traits by independent culling levels. J. Genetics 57: 329-338.
Corresponding editor: J. F. KIDWELL W. P. BROWN AND A. E. BELL
PAYNE, F., 1920