THE NRC ESSI SIMULATOR PROGRAM, CURRENT STATUS
N. Tafazzoli1, F. Pisan`o1, J. A. Abbel M.1, B. Kamrani1, C.-G. Jeong1, B. Aldridge1, R. Roche2,
A. Kammerer2, and B. Jeremi´c1,3,
1University of California, Davis, CA, U.S.A.
2U.S. Nuclear Regulatory Commission, Washington, DC, U.S.A. 3Lawrence Berkeley National Laboratory, Berkeley, CA, U.S.A.
([email protected]; [email protected])
ABSTRACT
In this paper we overview some current modeling and simulation features of the NRC ESSI Simulator Program, a parallel, nonlinear, time domain finite element program developed to solve dynamic problems for the soil/rock – structure interaction of Nuclear Power Plant (NPP) system. The NRC ESSI Program is part of the NRC ESSI Simulator System, a software, hardware and educational system for high fidelity modeling and simulation of dynamic response of NPPs.
INTRODUCTION
We have been developing the ESSI Simulator System for last three years. The ESSI Simulator systems consists of the program, computer and notes. Focus in this paper will be on ESSI Simulator Program.
The motivation for developing the ESSI Simulator system is based on a need to develop tools for high fidelity modeling and simulation of nonlinear behavior of earthquake soil/rock structure interaction. Sim-plifying modeling assumptions (for example linear elasticity for all components and material of a SSI NPP system) can lead to introduction of modeling uncertainty in results. This increase in uncertainty of results (on top of uncertainty in material modeling, seismic input motions, etc.) contributes to diminishing accuracy of numerical predictions, which are to be used in assessment of safety and economy of an NPP system.
The ESSI Simulator Program features a number of advanced modeling and simulation models, methods and algorithms. In this paper we will briefly overview just two features.
nonlinear finite element simulations require use of full 3D incremental elastic-plastic material models, such as, for example Pisan‘o model.
Secondly, accuracy and fidelity of numerical simulations are very closely related to the process of ver-ification and validation of the numerical prediction program Oberkampf et al. (2002); Oberkampf and Roy (2010). Verification is a process of determining that a model implementation accurately represents the devel-oper’s conceptual description and specification, and it represents a mathematics issue. Verification provides evidence that the model is solved correctly. Validation, on the other hand, is a process of determining the degree to which a model is accurate representation of the real world from the perspective of the intended uses of the model and represents a physics issue. Validation provides evidence that the correct model is solved. Presented will be a in some detail a verification of seismic input into finite element models of SSI system.
PISAN ´O ELASTIC-PLASTIC MATERIAL MODEL
The Pisan`o elastic-plastic material model is represented by a vanishing elastic region – infinitesimally small yield surface, with rotational kinematic hardening controlled by distance from a bounding surface. The plastic flow rule is similar to that of Manzari and Dafalias (1997). The main goal in developing this material model was ease of calibration when only modulus reduction and damping curves are available (as is usually the case in practice). Volume change, not available with modulus reduction and damping curves modeling, can also be modeled, however, lack of good data introduces modeling uncertainty.
The model is characterized by seven parameters:
• two elastic parameters, the Young modulusE(or the shear modulusGmax) and the Poisson’s ratioν;
• the shear strength parameterM for the definition of the bounding surface;
• the flow rule parameters, ξ andkd, governing the increment of the volumetric plastic strain under shearing and the size of the dilatancy surface, respectively;
• the hardening parameters h and m for the dependence of the hardening modulus on the distance coefficientβ, affecting the pre-failure deformational behavior and, in overall, the resulting dynamic properties (G/Gmaxand damping curves).
10−4 10−3 10−2 10−1 100 101 0 0.2 0.4 0.6 0.8 1
γmax [%]
G/Gmax [−]
100−4 10−3 10−2 10−1 100 101 0.1
0.2 0.3 0.4
γmax [%]
ζ
[−]
Seed & Idriss
frict, frict+visc
Seed & Idriss frict frict+viscous
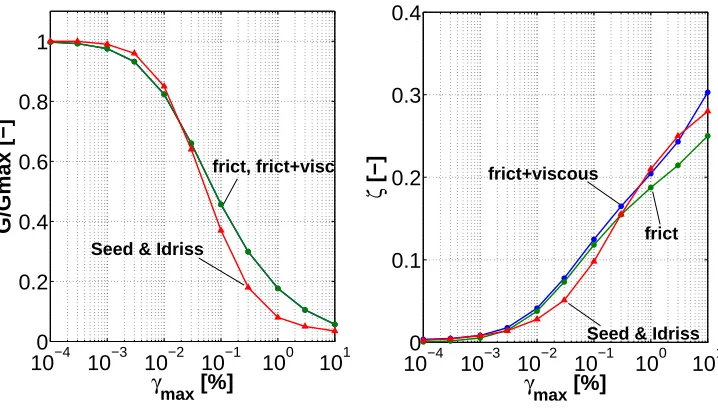
Figure 1: Comparison between experimental and simulated G/Gmax and damping curves (p0=100 kPa, T=2πs,ζ = 0.003,Gmax= 4 MPa,ν=0.25,M=1.2,kd=ξ=0,h=Gmax/(15p0),m=1)
Figure 1 illustrates model performance after calibration, applied on theG/Gmaxandζcurves for sands implemented into the code EERA (Bardet et al., 2000) and formerly obtained by Seed and Idriss (1970). It is noted that the experimental/numerical agreement is good up toγmax= 10%, which is a rather high cyclic strain level, for equivalent elastic modeling of soil.
The lack of data for volumetric response (from modulus reduction and damping curves), can potentially reduce the accuracy of results due to the importance of volumetric response, and resulting changes in con-finement to soil response. For example, Figure 2 shows cyclic response of the very same soil, calibrated from the very same modulus reduction and damping curves. The difference is the assumption of
compres--10 -5 0 5 10 15
-0.02-0.015-0.01-0.005 0 0.005 0.01 0.015
τ
[kPa]
γ [-]
z = H/2
-50 -40 -30 -20 -10 0 10 20 30 40 50
-0.035-0.03-0.025-0.02-0.015-0.01-0.005 0 0.005 0.01
τ
[kPa]
γ [-]
z = H/2
sive response (usually a loose soil) for the soil whose response is shown on top of Figure 2, while bottom response in Figure 2 belongs to a dilative soil (usually a dense soil). It is obvious that the dense soil will have a much stiffer response, potentially transmitting higher ground motion frequencies, while the soft soil will potentially transmit lower ground motion frequencies.
VERIFICATION OF SEISMIC INPUT INTO FINITE ELEMENT MODELS
The real three dimensional (3D), inclined seismic wave field consist of both body (P, SV, SH) and surface waves (Rayleigh, Love, etc). It is important to be able to model all relevant waves and input them into finite element model of the SSI NPP systems. Input of such complicated (yet real) seismic wave fields is currently done using the Domain Reduction Method (DRM) (Bielak et al., 2003). The use of DRM for seismic input requires verification, in order to prove that the method is properly implemented and that it does what we claim it does (input all seismic waves fields accurately into the finite element model).
While there are a number of ways DRM can be verified (using for example synthetic motions composed of various wavelets), we will present a verification based on free field motions developed for the Northridge earthquake by the fk geophysics code (a frequency-wavenumber integration code (Haskell, 1964; Wang and Herrmann, 1980) Zhu and Rivera (2002)).
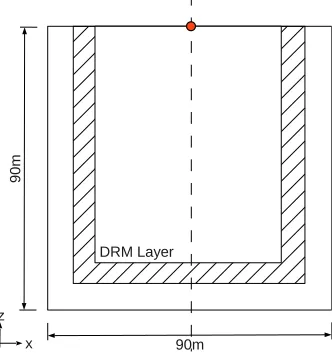
Figure 3 shows schematics x-z plane view of a three dimensional finite element model used to input seismic motions. The DRM layer is represented by a single layer of finite elements. The effective forces
obtained with the finite element model (using DRM) are then compared with the large scale motions from fk code,
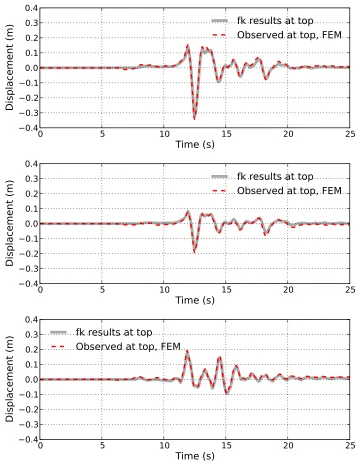
Figure 4 shows comparison results for a point at the top-midpoint of the finite element model. Results
0
5
10
15
20
25
Time (s)
−0.4
−0.3
−0.2
−0.1
0.0
0.1
0.2
0.3
0.4
Displacement (m)
fk results at top
Observed at top, FEM
0
5
10
15
20
25
Time (s)
−0.4
−0.3
−0.2
−0.1
0.0
0.1
0.2
0.3
0.4
Displacement (m)
fk results at top
Observed at top, FEM
0
5
10
15
20
25
Time (s)
−0.4
−0.3
−0.2
−0.1
0.0
0.1
0.2
0.3
0.4
Displacement (m)
fk results at top
Observed at top, FEM
Figure 4: Comparison between results computed from program fk and finite element analysis, observed at the top middle point of the finite element model. Top: EW; Middle: NS; Bottom: UD.
ACKNOWLEDGMENT
Funding from and collaboration with the US NRC (Contract # V6158) and funding from the US DOE (NEAMS program) and CNSC (Contract # 87055-12-0266) for this research is greatly appreciated.
DISCLAIMER
This report was prepared as an account of work sponsored by an agency of the U.S. Government. Neither the U.S. Government nor any agency thereof, nor any of their employees, makes any warranty, expressed or implied, or assumes any legal liability or responsibility for any third party’s use, or the results of such use, of any information, apparatus, product, or process disclosed in this report, or represents that its use by such third party would not infringe privately owned rights. The views expressed in this paper are not necessarily those of the U.S. Nuclear Regulatory Commission.
References
Bardet, J. P., K. Ichii, and C. H. Lin (2000). Eera, a computer program for equivalent-linear earthquake site response analyses of layered soil deposits. Technical report, University of Southern California.
Bielak, J., K. Loukakis, Y. Hisada, and C. Yoshimura (2003). Domain reduction method for three– dimensional earthquake modeling in localized regions. part I: Theory. Bulletin of the Seismological Society of America 93(2), 817–824.
Haskell, N. (1964). Radiation pattern of surface waves from point sources in a multi-layered medium. Bulletin of the Seismological Society of America 54(1), 377–393.
Manzari, M. T. and Y. F. Dafalias (1997). A critical state two–surface plasticity model for sands. G´eotechnique 47(2), 255–272.
Oberkampf, W. L. and C. J. Roy (2010). Verification and Validation in Scientific Compuring. Cambridge University Press.
Oberkampf, W. L., T. G. Trucano, and C. Hirsch (2002, October 22-23). Verification, validation and predic-tive capability in computational engineering and physics. InProceedings of the Foundations for Verifica-tion and ValidaVerifica-tion on the 21st Century Workshop, Laurel, Maryland, pp. 1–74. Johns Hopkins University / Applied Physics Laboratory.
Seed, H. B. and I. M. Idriss (1970). Soil moduli and damping factors for dynamic response analyses. report eerc 70-10. Technical report, University of California Berkeley.
Wang, C. and R. Herrmann (1980). A numerical study of p-, sv-, and sh-wave generation in a plane layered medium.Bulletin of the Seismological Society of America 70(4), 1015–1036.