Morphometric Analysis of WRY-2 sub- watershed
using Remote Sensing Data and GIS Technique in
Wardha District of Maharashtra, India
Kanak N. Moharir
Ass. Professor
Department of Geoinformatics, Shri shivaji College, Akola-4440001
Abstract
Morphometric analysis of a
highland sub-watershed (WRY-2) area was
carried out using remote sensing and
geographic information system (GIS)
techniques. Detailed drainage map of the
area was prepared from the high
resolution satellite image and Survey of
India (SOI) toposheets which was updated
using LISS-III analog data. Updated
drainage maps were used for the drainage
pattern analysis of the study area, The
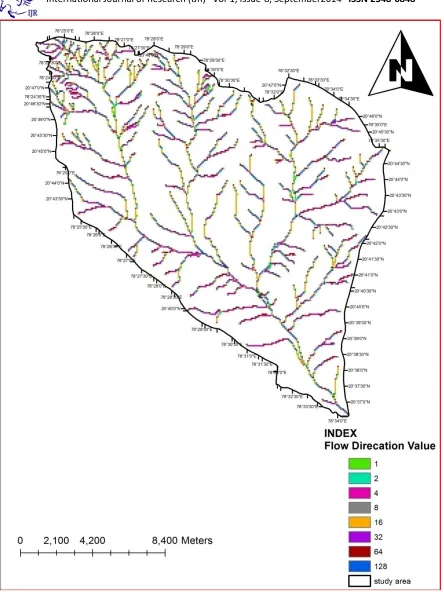
WRY2 sub watershed shows a sub-trellis
drainage pattern with moderate drainage
texture. High bifurcation ratio indicates a
strong structural control on the drainage
pattern.The extracted drainage network
was classified according to Strahler’s
system of classification and it reveals that
the terrain exhibits dendritic to
sub-dendritic drainage pattern. Hence, from
the study, it can be concluded that remote
sensing data (SRTM–DEM) coupled with
geoprocessing techniques prove to be a
areal and relief aspects of morphometric
parameters. Lithological, structural and
geomorphologicalexpression of the
sub-watershed controls the flow direction of
the entire drainage network.Different
thematic maps i.e. drainage map, stream
order map, soil map and geomorphological
maphave been prepared from satellite
LISS-III image by using Arc GIS software. The
WRY-2 drainage basin is sprawled over an
area of 256.38 km2. The Main stream
Length ratio of the basin is 23.64
indicating that the study area is elongated
with and steep slopes. The Morphometric
parameters of the stream have been
analysed and calculated by applying
standard methods and techniques viz.
Horton, 1945; Miller,1953, Strahler, 1964.
Based on all morphometric parameters
analysis; that the erosional development of
the area by the streams has progressed
well beyond maturity and that lithology
has had an influence in the drainage
development. These studies are very useful
Ground and artificial recharge and
watershed management.
Keywords: Drainage map, Digital
Elevation Model, soil map, land use land
cover map, Geographical information
system, Remote sensing.
1.
Introduction:-
Watershed is a natural hydrological
entity which allow surface run-off to
define channel, drain, stream or river at a
particular point. It is the basic unit of the
water supply which evolves over time.
Different workers define water-shed
differently. In foreign literature, watershed
has been defined as a drainage basin or
catchment. The size of a watershed can
vary from fraction of hectares to thousands
of square kilometers. Watershed is also
classified based on the area that a
watershed contains. On the basis of area,
watersheds can be classified as: micro
watershed (0 to 10 ha), small watershed
(10 to 40 ha), mini watershed (40 to 200
ha), sub watershed (200 to 400 ha), macro
watershed (400 to 1000 ha), river basin
(above 1000 ha). One of the major
concerns of the present time is the
management and protection of the
watershed area. Morphometric analysis of
watershed requires measurement of linear
features, gradient of channel network and
contributing ground slopes of drainage
basin (Nautiyal, 1994).Morphometric
analysis of a watershed provides a
quantitative description of the drainage
system, which is an important aspect of the
characterization of watersheds (Strahler,
1964). GIS techniques are now a day used
for assessing various terrain and
morphometric parameters of the drainage
basins and watersheds, as they provide a
flexible environment and a powerful tool
for the manipulation and analysis of spatial
information.GIS and remote sensing
techniques have opened up wide range of
avenues for effective watershed
management. The remote sensing data
combined with field survey data can
provide a unique and hybrid database for
optimal planning and management of
watershed (Solanke, et al. 2005). Space
borne remote sensing technology is a
unique tool to provide spatial,
multi-spectral and repetitive information for
effective planning (Lillesand and Keiffer,
2. Study Area and Methodology:-
The study area lies in the Survey of
India Topographic Sheets No.55L/13,
55L/14 is bounded by 73°25'00"E
20°37'00"N latitude and longitude is
73°25'30"E 20°44'30"N(Figure 1) and is
located at Wardha District. The LISS-III
Open Source satellite image was used for
linear, aerial for drainage basin analysis
and interpretation (Figure 2). The image
interpretation characteristics such as tone,
texture, shape, size, pattern and association
along with sufficient ground truth and
local knowledge were used to finalize the
maps of the WRY-2watershed area. The
maps are prepared by georefrancing and
digitization from SOI toposheet using Arc
GIS 10. Attributes were assigned to create
the digital database. The Survey of India
toposheets of scale 1:50,000 are used for
delineating the watershed boundary,
drainage pattern for the preparation of base
map and extracting different thematic
layers for the various part of analysis
namely drainage, road and water bodies
etc.The order was assigned stream by
following Strahler,(1964) stream ordering
technique. Various morphometric
parameters, such as linear aspects of the
drainage network: stream order (Nu),
stream length (Lu),and bifurcation ratio
(Rb), and areal aspects of the drainage
basin: drainage density (Dd), as presented
in Table (2).
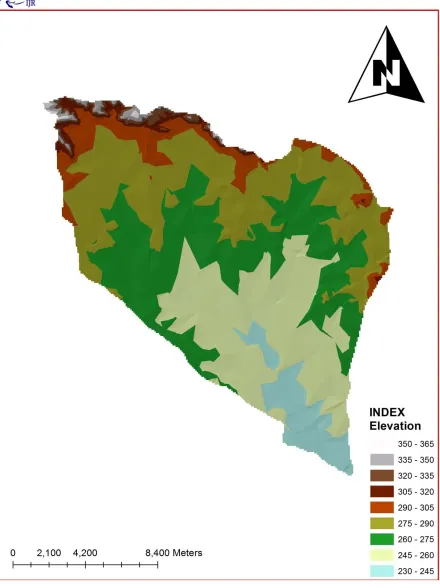
3. Physiography:-
The study area can be broadly
divided into low lying plain towards the
banks of theWRY-2Sub-watershed in the
northeast and horizontal Deccan Trap
flows with multiple scarps and abrupt
cliffs towards the southern parts. The study
area consists of various erosional surfaces
in step-like terraces. The horizontal
dispositions of the lava flows with a fair
degree of uniformity in lithology have
considerably simplified the changes
brought by the secondary processes like
Figure.2. 3D MODEL VIEW OF WRY-2WATERSHED
3. Morphometric Analysis
Morphometry provides the basis of
investigation of maps for a
geomorphological survey Bates and
Jackson,(1980); Agarwal,( 1998); Obi
Reddy et.al., ( 2002).The area altitude
,volume, slope,Profile and textures of
landforms comprise principal parameters
of investigation. Dury,( 1952); Christian,
Jenning and Tuidale, (1957) applied
various methods for landform analysis. A
development of quantitative physiographic
methods to describe the evolution and
behaviour surface drainage network. The
linear aspects were studied using the
methods of Horton, ( 1945), Strahler,(
1953); Chorley, ( 1957) Leopold and
Maddock,( 1953);Abrahams,( 1984). the
areal aspects using those of Schumn, (
1956); Strahler,( 1956 ,1968) ;Miller,(
1953), and Horton( 1932); and the relief
and Pareta ( 2004). The area, altitude,
volume, slope, profile and texture of
landforms comprise principal parameters
of investigation. Dury (1952), Christian,
Jenning and Tuidale (1957) applied
various methods for landform analysis,
which could be classified in different ways
and their results presented in the form of
graphs, maps or statistical indices. The
morphometric analysis of the WRY-2
basin was carried out on the Survey of
India topographical maps No. 55L/13,
55L/14 on the scale 1:50,000 The lengths
of the streams, areas of the watershed were
measured by using ArcGIS-10 software,
and stream ordering has been generated
using Strahler (1953) system, and Arc
Hydro tool in ArcGIS-10 software.
4. Drainage Network:
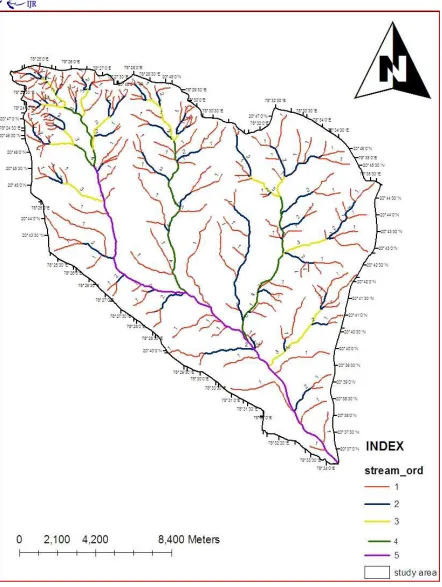
4.1. Stream Order (Su):-
Stream ordering is the first step of
quantitative analysis of the watershed. The
stream ordering systems has first
advocated by Horton (1945), but Strahler
(1952) has proposed this ordering system
with some modifications. Author has been
carried out the stream ordering based on
the method proposed by Strahler, Table 1.
It has observed that the maximum
frequency is in the case of first order
streams. It has also noticed that there is a
decrease in stream frequency as the stream
order increases.
4.2. Stream Number (Nu)
The total of order wise stream
segments is known as stream number.
Horton (1945) statesthat the numbers of
stream segments of each order form an
inverse geometric sequence withorder
number, Table 1.
4.3. Stream Length (Lu)
The total stream lengths of the
WRY-2 sub watershed have various
orders, which havecomputed with the help
of SOI topographical sheets and ArcGIS
software. Horton's law ofstream lengths
supports the theory that geometrical
similarity is preserved generally
inwatershed of increasing order (Strahler,
1964). Author has been computed the
stream length
based on the low proposed by Horton
4.4. Mean Stream Length (Lum):-
Mean Stream length is a
dimensional property revealing the
characteristic size of componentsof a
drainage network and its contributing
watershed surfaces (Strahler, 1964). It is
obtained by dividing the total length of
stream of an order by total number of
segments in the order.
Table 1: Stream Order, Streams Number, and Bifurcation Ratios of WRY-2 River basin
Su Nu Rb Nu-r Rb*Nu-r Rbwm
I 188 --- --- ---
3.55
II 56 3.35 244 817.4
III 13 4.30 69 296.7
IV 4 3.25 17 55.25
V 1 4 5 20
Total 262 14.9 335 1189.35
Mean 3.72*
Su: Stream order, Nu: Number of streams, Rb: Bifurcation ratios, Rbm: Mean bifurcation ratio*, Nu-r: Number of stream used in the ratio, Rbwm: Weighted mean bifurcation ratios
4.5. Stream Length Ratio (Lurm):-
Horton (1945, p.291) states that the
length ratio is the ratio of the mean (Lu) of
segments oforder (So) to mean length of
segments of the next lower order (Lu-1),
which tends to beconstant throughout the
successive orders of a basin. His law of
stream lengths refers that themean stream
lengths of stream segments of each of the
successive orders of a watershed tendto
approximate a direct geometric sequence
in which the first term (stream length) is
theaverage length of segments of the first
order (Table 2). Changes of stream length
ratio fromone order to another order
indicating their late youth stage of
geomorphic development (Singh and
Singh, 1997).
4.6. Bifurcation Ratio (Rb):-
The bifurcation ratio is the ratio of
the number of the stream segments of
given order ‘Nu’ tothe number of streams
in the next higher order (Nu+1), Table 1.
Horton (1945) considered theBifurcation
ratio as index of relief and dissertation.
Strahler (1957) demonstrated
thatbifurcation shows a small range of
variation for different regions or for
different environmentexcept where the
powerful geological control dominates. It
is observed from the Rb is notsame from
irregularities are dependent upon the
geologicaland lithological development of
the drainage basin (Strahler 1964). The
bifurcation ratio isdimensionless property
and generally ranges from 3.35 to 4.0. The
lower values of Rb arecharacteristics of
the watersheds, which have suffered less
structural disturbances (Strahler1964) and
the drainage pattern has not been distorted
because of the structural disturbances(Nag
1998). In the present study, the higher
values of Rb indicates strong structural
controlon the drainage pattern, while the
lower values indicative of watershed that
are not affect bystructural disturbances.
4.7 Weighted Mean Bifurcation
Ratio (Rbwm):-
To arrive at a more representative
bifurcation number Strahler (1953) used a
weighted meanbifurcation ratio obtained
by multiplying the bifurcation ratio for
each successive pair oforders by the total
numbers of streams involved in the ratio
and taking the mean of the sum ofthese
values. Schumm (1956, pp 603) has used
this method to determine the mean
bifurcationratio of the value of 3.72of the
drainage of Perth Amboy, N.J. The values
of the weightedmean bifurcation ratio this
determined are very close to each other.
Table 2: stream length and stream length ratio in WRY-2River basin
.
Su
Lu
Lu/Su
Lur
Lur-r
Lur*Lur-r
Luwm
I
208.700
1.11
1.68
II
63.987
1.14
1.02
272.68
278.13
III
26.463
2.03
1.78
90.45
161.00
IV
24.317
6.07
2.99
50.78
151.83
V
23.638
23.638
3.89
47.95
186.52
Total
347.107
33.988
9.68
461.86
777.48
Mean
2.42
4.8. Length of Main Channel (Cl):-
This is the length along the longest
watercourse from the outflow point of
designated sun watershedto the upper limit
to the watershed boundary. Author has
computed the mainchannel length by using
ArcGIS-10 software, which is 23.64Kms.
4.9. Channel Index (Ci) & Valley Index
(Vi):-
The river channel has divided into
number of segments as suggested by
Muller (1968), andFriend and Sinha
(1998) for determination of sinuosity
parameter. The measurement ofchannel
length, valley length, and shortest distance
between the source, and mouth of theriver
(Adm) i.e. air lengths are used for
calculation of Channel index, and valley
index.
4.10. Rho Coefficient (
ρ
):-
The Rho coefficient is an important
parameter relating drainage density to
physiographicdevelopment of a watershed
which facilitate evaluation of storage
capacity of drainagenetwork and hence, a
determinant of ultimate degree of drainage
development in a givenwatershed (Horton
1945). The climatic, geologic, biologic,
geomorphologic, andanthropogenic factors
determine the changes in this parameter. A
Rho value of the WRY-2 sub watershed
is0.64. This is suggesting higher
hydrologic storage during floods and
attenuation of effects of erosion during
elevated discharge.
5. Basin Geometry
5.1 Length of the Basin (Lb)
Several people defined basin length
in different ways, such as Schumm (1956)
defined thebasin length as the longest
dimension of the basin parallel to the
principal drainage line.Gregory and
Walling (1973) defined the basin length as
the longest in the basin in which areend
being the mouth. Gardiner (1975) defined
the basin length as the length of the line
from abasin mouth to a point on the
perimeter equidistant from the basin mouth
in either directionaround the perimeter.
The length of the WRY-2 sub
watershedinaccordance with the definition
5.2 Basin Area (A)
The area of the WRY-2 sub
watershedis another important parameter
like the length of the streamdrainage.
Schumm (1956) established an interesting
relation between the total WRY-2 sub
watershedareas and the total stream
lengths, which are supported by the
contributing areas. The authorhas
computed the basin area by using
ArcGIS-10 software, which is 256.38Sq. Kms.
5.3Basin Perimeter (P)
Basin perimeter is the outer boundary of
the watershed that enclosed its area. It is
measured
along the divides between watershed and
may be used as an indicator of watershed
size and
shape. The author has computed the basin
perimeter by using ArcGIS-10 software,
which is
73.72Kms.
5.4 Length Area Relation (Lar):-
Hack (1957) found that for a large
number of basins, the stream length and
basin area are related by a simple power
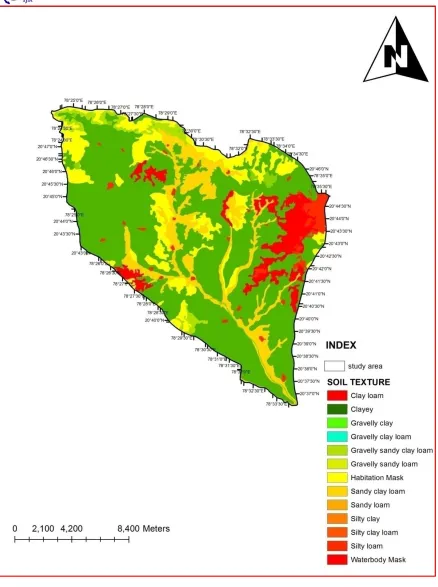
6. SOIL:
Soil is important upper layer of the
earth surface to support crop and
vegetation for the economic development
and food requirement of the human. The
soil information for the study area was
identified in the study area. At the lower
area of watershed consists of clayey
soil.The soil types of study area areclayey
soil, clay loam, clayey, gravely clay,
gravely clay loam, gravely sandy loam,
sandy clay, and gravely sandy clay etc.
The erosion of the top soil decreases the S. N Morphometric Parameter Formula Reference Results
A Drainage Network
1 Stream Order (Su) Hierarchical Rank Strahler (1952) 1 to 5
2 1st Order Stream (Suf) Suf = N1 Strahler (1952) 188.00
3 Stream Number (Nu) Nu = N1+N2+ …Nn Horton (1945) 262.00
4 Stream Length (Lu) Kms Lu = L1+L2 … Ln Strahler (1964) 347.107
5 Stream Length Ratio (Lur) see Table 2.3 Strahler (1964) 9.68
6 Mean Stream Length Ratio (Lurm) see Table 2.3 Horton (1945) 2.42 7 Weighted Mean Stream Length Ratio
(Luwm)
see Table 2.3 Horton (1945) 1.68
8 Bifurcation Ratio (Rb) see Table2.2 Strahler (1964) 3.35-14.9
9 Mean Bifurcation Ratio (Rbm) see Table 2.2 Strahler (1964) 3.72
10 Weighted Mean Bifurcation Ratio (Rb)
see Table 2.2 Strahler (1953) 3.55
11 Main Channel Length (C1) Km. GIS Software Analysis 23.64
12 Valley Length (VI) Kms GIS Software Analysis 31.68
13 Minimum Aerial Distance (Adm) Kms
GIS Software Analysis
14 Channel Index (Ci) Ci = Cl/ Adm (H & TS) Miller (1968) 15 Valley Index (Vi) Vi = Vl/ Adm (TS) Miller (1968)
16 Rho Coefficient (ρ) ρ = Lur/ Rb Horton (1945) 0.64
B Basin Geometry
17 Length from W’s Center to Mouth of W’s (Lcm)Kms
GIS Software Analysis Black (1972) 18 Width of W’s at the Center of
Mass(Wcm) Kms
GIS Software Analysis Black (1972) 18.86
19 Basin Length (Lb) Kms GIS Software Analysis Schumm(1956) 28.27
20 Mean Basin Width (Wb) Wb = A / Lb Horton (1932) 9.07
21 Basin Area (A) SqKms GIS Software Analysis Schumm(1956) 256.38
22 Mean Area Ratio (Arm) 23 Weighted Mean Ratio (Arwm)
24 Basin Perimeter (P)Kms GIS Software Analysis Schumm(1956) 73.72
rapidly and easily obtained with high
repeatability, numerous samples can be
studied to establish trends of change in soil
hydraulic properties in a watershed. In
order to spatially extrapolate the soil
physical condition in the watershed, the
spectrally defined physical condition
indices were calibrated to pixel reflectance
extracted from the IRS image of the study
area. However, the conditional
dependency model was developed to
remove potential errors in the calibration
model due to correlation between factors.
There was significance relationship
between soil physical condition indices
and reflectance values from band 3, band 5
7. Land Use and Land Cover
Land Cover, defined as the
assemblage of biotic and a biotic
components on the earth’s surface is one
of the most crucial properties of the earth
system. Remote sensing data and GIS
techniques provide reliable basic
information for land use mapping and play
very important role in determining land
use pattern by visual interpretation. Land
use and land cover is an important
component in understanding the
interactions of the human activity with the
environment and thus it is necessary to be
able to simulate changes. Land use refers
to man’s activities and the varied uses
which are carried on over land and land
cover refers to natural vegetation, water
bodies, rock/soil, artificial cover and
others noticed on the land (NRSA, 1989).
The land use/ land cover is derived from
the LISS-III Open Source satellite image
using image classification techniques such
as supervised and unsupervised. The most
of the land is under agricultural crop land
in the present study area and other area is
covered by forest, built up, waste land, and
Water body. Land use describes how a
parcel of land is used such as for
agriculture, settlements or industry,
whereas land cover refers to the material
such as vegetation, rocks or water bodies
that are present on the earth surface. The
water bodies include river, canal, tank,
pond and reservoir etc which is show in
8. Conclusion:-
The study reveals that remotely
sensed data and GIS based approach
inevaluation of drainage morphometric
parameters and their influence on
landforms, soils anderoded land
characteristics at river basin level is more
appropriate than the conventionalmethods.
GIS based approach facilitates analysis of
different morphometric parameters and
toexplore the relationship between the
drainage morphometry and properties of
landforms, soilsand eroded lands.
Different landforms were identified in the
watershed based on remotely sensed data
with 30 m spatial resolution, and GIS
software. GIS techniques characterized by
high accuracy of mapping and
measurement prove to be a competent tool
in morphometric analysis. GIS techniques
characterized by very high accuracy of
mapping and measurement prove to be a
competent tool in morphometric analysis.
The morphometric analyses were carried
out through measurement of linear, areal
and relief aspects of the watershed with
more than 25 morphometric parameters.
The morphometric analysis of the drainage
network of the watershed show dendritic
and radial patterns with moderate drainage
texture. The morphometric analysis of the
drainage network of the watershed show
dendritic and with coarse drainage
texture.The variation in stream length ratio
due to change in slope and topography.
The bifurcation ratio in the watershed
indicates normal watershed category and
the presence of moderate drainage density
suggesting that it has moderate permeable
sub-soil, and coarse drainage texture. The
value of stream frequency indicate that the
watershed show positive correlation with
increasing stream population with respect
to increasing drainage density. The value
of form factor and circulator ration
suggests that WRY-2 sub watershed is less
elongated. Hence, from the study it can be
concluded with GIS techniques, prove to
be a competent tool in morphometric
analysis.In this present study, illustration
of how we can benefit from remote
sensing and GIS technologies in watershed
management and planning. Watershed
management is the process of creating and
implementing plans, programs, and
projects to sustain and enhance watershed
functions that affect the plant, animal, and
human communities within a watershed
boundary. The remote sensing data
combined with field survey data can
provide a unique and hybrid database for
optimal planning and management of
watershed. Space borne remote sensing
technology is a unique tool to provide
spatial, multi-spectral and repetitive
land forms along with slope gradient and
relief intensity are other parameters to
determine the type of water harvesting and
water conservation structures. This study
has provided information regarding the
soil map, land use land cover map,
Morphometric analysis and watershed
Managementresponse in WRY-2
Watershed in wardha District Maharashtra,
India.The relationship between geological
setup and drainage pattern is analyzed.
Regional and local trends of geological
setup are reflected in the variable
orientation of channels of different rank in
the catchment.
REFERANCES
1. Basin, Central Tamil Nadu,
India using remote sensing and
GIS techniques. BonfringInt J
Indus Eng.ManagSci. 2(1):8–
15.
2. Broscoe, A.J (1959),
“Quantitative Analysis of
Longitudinal Stream Profiles of
SmallWatersheds”, Project N.
389-042,
3. Burrough PA (1986) Principles
of geographical information
systems for land resources
4. Central Ground Water Board
(CGWB) (2007) Groundwater
informationbooklet of Thrissur
District, Kerala State, pp 1–
26.Chitra C, Alaguraja P,
Ganeshkumari
5. Chorley RJ (1969) Introduction
to physical hydrology. Methuen
and Co. Ltd., Suffolk, p 211.
6. Chow Ven T, David RM, Larry
WM (1988) Handbook of
appliedhydrology. McGraw
Hill Inc., New York.
7. Clarke JI (1996) Morphometry
from maps: essay in
geomorphology. Elsevier Publ.,
Co., New York, pp 235–274.
8. Gregory KJ, Walling DE
(1973) Drainage basin form
and process:
ageo-morphological approach.
Edward Arnold, London.
9. Hadley RF, Schumm SA
(1961) Sediment sources and
drainage basin characteristics in
upper Cheyenne River Basin.
USGS Water-
10.Horton RE (1932) Drainage
basin characteristics. Trans Am
GeophysUnion 13:350–
Deccan Volcanism Geological
Society ofIndia, Memoir No. 3,
Bangalore, pp 244-257.
11.Horton RE (1945) Erosional
development of streams and
theirdrainage basins;
Hydro-physical approach to
quantitative morphology. Bull
GeolSoc Am 56:275–370.
12.Institute for Aerial Survey and
Earth Science (ITC), Enschede.
13.John Wilson JS, Chandrasekar
N, Magesh NS (2012)
Morphometricanalysis of major
sub-watersheds in Aiyar and
KaraiPottanar
14.Journal of Golden Research
Thoughts, ISSN 2231-5063,
Volume-3, Issue-9,
March-2014.
15.K, Yuvaraj D, Manivel M
(2011) Watershed
characteristics of
Kundahsubbasin using remote
sensing and GIS techniques. Int
J GeomaticsGeosci 2(1):311–
335.
16.Kanak N. Moharir, Chaitanya
B. Pande(2014) Analysis of
Morphometric Parameters
Using Remote-Sensing and
GIS Techniques In The
LonarNala In Akola District,
Maharashtra, India,
International Journal For
Technological Research In
Engineering Volume 1, Issue
10, June-2014.
17.Kelson KI, Wells SG (1989)
Geologic influences on fluvial
hydrology and bedload
transport in small mountainous
watersheds, northern New
Mexico, USA. Earth Surf
Processes 14:671–690.
18.Ket-ord R, Tangtham N,
Udomchoke V (2013)
Synthesizing drainage
morphology of tectonic
watershed in upper ing
watershed (Kwan Phayao
Wetland Watershed). Modern
ApplSci 7(1):13–37.
19.Khadri S.F.R. &KanakMoharir
(2013) International Journal of
Scientific & Engineering
Research, Volume 4, Issue 11,
November-2013 ISSN
2229-5518.
20.Khadri S.F.R. and
KanakMoharir(2014) Use Of
Geographical Information
System And Remote Sensing In
Hypsometric Analysis Of Man
River Basin In Akola and
21.Khadri, S. F. R , Chaitanya B.
Pande(2014) Morphometric
Analysis of Mahesh River
Basin Exposed In Akola and
Buldhana Districts,
Maharashtra, India Using
Remote Sensing &GIS
Techniques, International
Journal of Golden Research
Thoughts, ISSN
2231-5063Volume-3, Issue-11, and
May-2014.
22.Khadri, S. F. R , Chaitanya B.
Pande(2014) Morphometric
Analysis of Mahesh River
Basin Exposed In Akola and
Buldhana Districts,
Maharashtra, India Using
Remote Sensing &GIS
Techniques, International
Journal of Golden Research
Thoughts, ISSN
2231-5063Volume-3,
Issue-11,May-2014.
23.Leopold LB, Wolman MG,
Miller JP (1964) fluvial
processes ingeomorphology.
WH Freeman and Company,
San Francisco and London.
24.Miller VC (1953) A
quantitative geomorphologic
mountain area, Virginia and
Tennessee. Columbia
University, Department of
Geology,Technical Report, No.
3, Contract N6 ONR 271-300.
25.Moglen GE, Eltahir EA, Bras
RL (1998)On the sensitivity of
drainage density to climate
change. Water Resour Res
34:855–862.
26.Montgomery DR, Dietrich WE
(1989) Source areas, drainage
density and channel initiation.
Water Resour Res 25:1907–
1918.
27.Nag SK, Chakraborty S (2003)
Influence of rock types and
structures in the development
of drainage network in hard
rock area. J Indian Soc Remote
Sens 31(1):25–35.
28.National Institute of Hydrology
(1993) Geomorphological
characteristics of Narmada
basin up to Manot. CS (AR) –
128, NIH,Roorkee. Technical
report, 1–34
29.Nautiyal MD (1994)
Morphometric analysis of a
drainage basin, district
30.Ozdemir H, Bird D (2009)
Evaluation of morphometric
parameters ofdrainage
networks derived from
topographic maps and DEM in
point floods. Environ Geol
56:1405–1415.
31.pp 1117-42.
32.Rastogi RA, Sharma TC (1976)
Quantitative analysis of
drainage basin characteristics. J
Soil Water Conservat India
26(1–4): 18–25.
33.Rudraiah M, Govindaiah S,
Srinivas VS (2008)
Morphometry using remote
sensing and GIS techniques in
the sub-basins of Kagnariver
basin, Gulburga district,
Karnataka, India. J Indian Soc.
Remote Sens 36:351–360.
34.Schumm SA (1956) Evolution
of drainage systems and slopes
in bedlands at Perth Amboy,
New Jersey. Bull GeolSoc Am
67:597–646.
35.Schumm SA (1963) Sinuosity
of alluvial rivers in the Great
Plains. Bull GeolSoc Am
74:1089–1100.
36.Sharma HS (1981) Perspectives
in geomorphology.
NaurangRai, Concept
publishing company. New
Delhi-110015, pp 109–140.
37.Smith KG (1950) Standards for
grading texture of erosional
topography. Am J Sci 248:655–
668.
38.Smith KG (1958) Erosional
processes and landforms in
badlandsnational monument,
South Dakota.GeolSoc Am
Bull 69:
39.Strahler AN (1957)
Quantitative analysis of
watershed geomorphology.
Trans Am Geophys Union
38:913–920.
40.Strahler AN (1964)
Quantitative geomorphology of
drainage basins and channel
networks. In: Chow ByVenTe
(ed) Handbook of applied
hydrology. McGraw Hill Book
Company, New York.
41.Strahler, A.N (1952),
“Hypsometric Analysis of
Erosional Topography”,
Bulletin ofthe Geological
Society of America, 63, Supply