Measurements of the proton-air cross section with high energy
cosmic ray experiments
Rasha Abbasi1,a
1Department of Physics and Astronomy at the University of Utah
Abstract.Detecting Ultra High Energy Cosmic Rays (UHECRs) enables us to measure the proton-air inelastic cross sectionσinel
p−airat energies that we are unable to access with
particle accelerators. The proton-proton cross sectionσp−pis subsequently inferred from
the proton-air cross section at these energies. UHECR experiments have been reporting on the proton-air inelastic cross section starting with the Fly’s Eye in 1984 at √s =
30 TeV and ending with the most recent result of the Telescope Array experiment at √
s=95 TeV in 2015. In this proceeding, I will summarize the most recent experimental results on theσinel
p−airmeasurements from the UHECR experiments.
1 Introduction
Measuring the proton-air inelastic cross sectionσinelp−airfrom cosmic rays at ultra high energies allows us to achieve knowledge of a fundamental particle property that we are unable to attain with mea-surements at current accelerators. Such a fundamental measurement is important to both constraining the high energy hardronic models and to verifying fundamental physics assumptions. Hadronic mod-els are in better agreement at lower energies, below 1015 eV, where they are tuned to measurements on multi-particle production provided by particle accelerators. However, above 1015eV models rely solely on theoretical expectations [1]. Studying the energy dependence of the proton-air cross section is important in constraining these models.
The value of the proton-air cross section is determined from detecting Ultra High Energy Cosmic Ray (UHECR) showers. Optimally, by observing the slant depth of the first point of interaction between the cosmic ray particle and air, X1. The slant depth referred to here is the amount of material penetrated by the cosmic ray particle before it arrives to the point in question (denoted by X and in units of g/cm2). Since the observation of the first point of interaction is not possible with UHECR detectors, the inelastic proton air cross section is inferred from the measurement of the slant depth at which the cosmic ray shower maximum occurs, Xmax.
The latest results reported on the proton-air cross section are from the UHECR detectors, the Tele-scope Array (TA) and the Auger experiments. In this proceeding, an overview of the data collection, selection, and methods used in both measurements of theσinelp−air is presented. The derived values of theσtot
p−pis also summarized.
2 Air Shower Data Samples
The most recent experimental results on theσinelp−air using UHECRs are from the Telescope Array and the Auger experiments. The Telescope Array detector started operation in 2008, it is located in the northern hemisphere in the southwestern desert of Utah in the United State of America. TA is composed of three Fluorescence Detectors (FDs) bounding 507 scintillation Surfase Detectors (SD). The SD array covers 700 km2. The Auger detector started operating in 2004. It is located in the southern hemisphere near the town of Malargüe in Argentina. It consists of four FDs overlooking 1660 water Cherenkov stations spread out over an area of 3000 km2.
The Telescope Array measurement of theσinel
p−airis based on data collected between May 2008 to May 2013. The data contains 439 events detected by the TA northernmost FD referred to as Middle Drum (MD) and the SD in hybrid mode. The FD and the SD parts of the detector trigger indepen-dently. A hybrid data set is formed by time matching the events within 2μs from the two detectors. The FD overlooking the sky above the SDs provides the longitudinal part of the shower and the SD report-ing the footprint of the shower provides the shower core and particle density. This hybrid technique improves the geometrical reconstruction of the shower significantly, a requirement for accurate Xmax determination. Theσinelp−airfor the TA experiment is reported in the energy range of 1018.3to 1019.3eV. The quality cuts applied to the data were optimized to achieve the best observed Xmaxresolution [2]. The achieved Xmaxresolution for this data set was∼23 g/cm2.
The data used in the Auger experiment is that collected from December-2004 to December-2012 using hybrid events from four fluorescence detectors. Theσinelp−airis reported at two energy ranges: for the energy bin of 1017.8to 1018eV using 18090 events and for the energy bin of 1018to 1018.5eV using 21270 events [3]. Here the quality cuts applied are also chosen to achieve the best Xmaxresolution [4]. The achieved Xmaxresolution was approximately<25 g/cm2[5].
Note that, in a broad sense, both experiments use the same technique (hybrid detection) to study the cosmic ray showers. However, the TA published Xmax distribution, using their event selec-tion/quality cuts, also referred to as the "Pattern recognition cuts” [2], has the effects of detector efficiency and resolution folded in. The interpretation of the data or systematic uncertainties is then concluded from folding the detector efficiency and resolution in the simulation. On the other hand, the Auger collaboration approach is to select events/quality cuts without any detector efficiency and resolution bias, using what is referred to as "fiducial volume cuts” [4]. This way, the interpretation of the data or the systematic uncertainties is then concluded from comparing the data directly to the high energy shower simulation, without folding any detector properties or reconstruction details. A direct comparison of the Xmax distributions from both detectors is being done by a working group comprised of members from both experiments [5]. The comparison is still a work in progress at the time of writing of this proceeding. Using the high energy model QGSJETII.3 [6] both distributions were found to be consistent within the statistical and systematic uncertainties.
3 Analysis and Proton-air cross section measurements
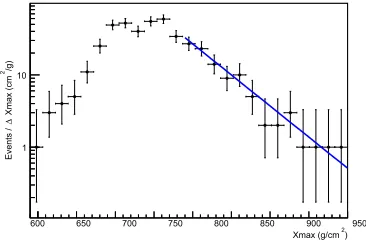
The Telescope Array determines the proton-air cross section using the “K-factor method”. Assuming that the tail of the Xmax distribution contains the lightest particles or the most penetrating particles (proton). This method infers the attenuation lengthΛmand hence the cross section value from fitting the tail of the Xmaxdistribution to the exponential function exp(−Xmax
Λm ).Λmhere is proportional to the interaction lengthλp−airsuch that:
Λm=Kλp−air=K
14.45mp
σinel p−air
The value ofΛmis calculated by fitting the tail of the observed Xmaxdistribution between 790 and 1000 g/cm2 using the unbinnd maximum likelihood method, as shown in Figure 1. TheΛmvalue from the fit is found to be 50.47±6.26 [Stat.] g/cm2.
) 2 Xmax (g/cm
600 650 700 750 800 850 900 950
/g)
2
Xmax (cm
Δ
Events /
1 10
)"
2
A RooPlot of "Xmax (g/cm
Figure 1.The number of events perXmaxbin (ΔXmax) vs.Xmaxg/cm2for the Telescope Array data with the energy between 1018.3and 1019.3eV. The line is the exponential fit to the slope.
The high energy models used to determine the value ofK are QGSJETII.4 [6], QGSJET01 [7], SIBYLL [8], and EPOS-LHC [9]. Several data sets of air showers in the energy range of 1018.3-1019.3 eV were simulated using each of the above models. K is found to be fairly constant between the energies of 1018.3-1019.3eV, for each of the high energy models [10]. This finding justifies the use of a single average value over the range of interest. Table 1 summarizes each of the high energy models used, the corresponding value ofKand consequentlyσinel
p−air.
The K-factor method has been used by several high energy experiments to deduce the value of σinel
p−airfrom theXmaxdistribution. The first measurement of the proton-air cross section using UHECR was performed by the Fly’s Eye experiment, which used a calculated value ofK=1.6 [11]. Following the Fly’s Eye result, the calculated values ofK, which appeared in the literature, showed a continuous decrease as full Monte Carlo simulations came into use. By 2000, after the development of modern high energy hadronic models, the reportedK-values still differed by approximately 7% [12]. Since then, as shown in Table 1, more complete hadronic shower simulations have converged on a smaller value ofK=1.2, with a model uncertainty of approximately 3%.
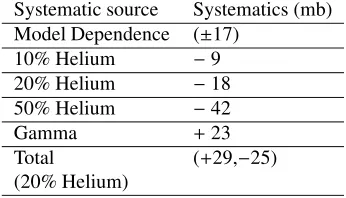
Several systematic checks were made including the model dependence (less than 3% uncertainty), detector bias, contamination by other primaries, energy dependence bias, and the error propagation of the systematic error in Λm. Table 2 summarizes the proton-air cross section systematics from the Telescope Array experiment [10]. The final value of the proton-air inelastic section reported by the Telescope Array collaboration is the average value of theσinel
p−air obtained by the high energy models QGSJETII.4, QGSJET01, SIBYLL, and EPOS-LHC, and is found to be equal to 567.0± 70.5 [Stat.]+−2925[Sys.] mb.
The Auger measurement of the proton-air cross section determinesσinel
p−airusing, as referred to here by “the modified cross section method”. This method starts similarly by inferring the proton-air cross section value from the exponential tail of theXmaxdistribution. This is done by fitting the tail of the distribution using the unbinned maximum likelihood fit to the exponential function exp(−Xmax
Table 1.The value ofKobtained for each of the high energy models and the TA reported value of theσinel p−airin
mb for that model.
Model K σinel
p−air(mb) QGSJETII.4 1.15±0.01 550.3±68.5 QGSJET01 1.22±0.01 583.7±72.6 SIBYLL 1.18±0.01 564.6±70.2 EPOS-LHC 1.19±0.01 569.4±70.8
Table 2.The systematic source and uncertainties of the proton-air cross section estimated by the Telescope Array experiment.The total uncertainty was calculated in quadrature using the error for the 20% helium case.
Systematic source Systematics (mb) Model Dependence (±17)
10% Helium −9
20% Helium −18
50% Helium −42
Gamma +23
Total (+29,−25)
(20% Helium)
The cross section in the high energy model is then modified, such that theΛmobtained from the model matches that measured value by the detector. The cross-section is modified by multiplying the hadronic cross-section in the simulation byf [13]. Where f is:
f(E,f19)=1+(f19−1) lg(E/10 15) eV
lg(1019eV/1015eV) (2)
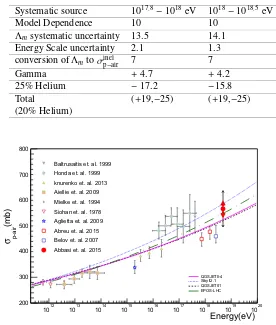
HereEis the shower energy and f19 is the value by which the shower at the energy 1019eV is scaled. After which, the model-modified-cross-section is calculated for the three high energy models: QGSJETII4, EPOS-LHC, and SIBYLL2.1. To calculate the systematic uncertainty of the measure-ment several checks were applied including: the model dependence (less than 3% uncertainty), prop-agating the uncertainties inΛm, the energy scale uncertainty, conversion ofΛmtoσinelp−air (mb), and contamination of other primaries. Table 3 summarizes the systematic uncertainties values for each of the energy bins [3].
The final values by Auger obtained for the proton air cross section for the energy bin of 1017.8 -1018eV is 457.5±17.8[Stat.]+−1925[Sys.] and 485.8±15.8[Stat.]−+1925[Sys.] for the energy bin of 1018 -1018.5eV [3].
The results for the proton-air cross section for the high energy cosmic ray detectors is summa-rized in Figures 2. In addition, the predictions of all four of the high energy models (QGSJETII.4, QGSJET01, SIBYLL, EPOS-LHC) cross section are also shown.
4 Proton-proton cross section
Theσp−pis calculated from the measured proton-air cross sectionσinelp−air, using both Glauber Formal-ism [21] and the relation:
σinel
p−air =σtotalp−air−σelp−air−σ qel
Table 3.The systematic source and uncertainties in mb of the proton-air cross section estimated by the Auger experiment.
Systematic source 1017.8−1018eV 1018−1018.5eV
Model Dependence 10 10
Λmsystematic uncertainty 13.5 14.1 Energy Scale uncertainty 2.1 1.3 conversion ofΛmtoσinelp−air 7 7
Gamma +4.7 +4.2
25% Helium −17.2 −15.8
Total (+19,−25) (+19,−25)
(20% Helium)
Energy(eV)
12
10 1013 1014 1015 1016 1017 1018 1019 1020
(mb)
p-air
σ
200 300 400 500 600 700 800
Baltrusaitis et. al. 1999
Honda et. al. 1999
knurenko et. al. 2013
Aiellie et. al. 2009
Mielke et. al. 1994
Siohan et. al. 1978
Aglietta et. al. 2009
Abreu et. al. 2015
Belov et. al. 2007
Abbasi et. al. 2015
QGSJETII-4 Sibyll2.1 QGSJET01 EPOS-LHC
Baltrusaitis et. al. 1999
Honda et. al. 1999
knurenko et. al. 2013
Aiellie et. al. 2009
Mielke et. al. 1994
Siohan et. al. 1978
Aglietta et. al. 2009
Abreu et. al. 2015
Belov et. al. 2007
Abbasi et. al. 2015
Figure 2. The proton-air cross section vs. energy for the high energy cosmic ray experiments ( [10], [11], [14], [15], [16], [17], [18], [19], [20]). In addition, the high energy models (QGSJETII.4, QGSJET01, SIBYLL, EPOS-LHC) cross section predictions are also shown by solid line, fine dashed line, dotted line, and dashed line consecutively.
Whereσtotalp−airis the total cross section,σelp−airis the elastic cross section, andσqelp−airis the quasi elastic cross section. The quasi-elastic cross section corresponds to scattering processes in which nuclear excitation occurs without particle production.
The relation between theσinelp−airand theσp−pis highly dependent on the forward scattering elastic slopeB.
B= d dt
⎡ ⎢⎢⎢⎢⎢ ⎣lndσ
el p−p
dt
⎤ ⎥⎥⎥⎥⎥ ⎦
t=0
(4)
finally, a model developed by Block, Halzen, and Stanev (BHS) [26] to be consistent with unitarity while using a QCD inspired fit to the pp and ¯pp data from the Tevatron seems to agree well with measurements at higher energies.
Figure 3 shows theσtotal
p−p value of the Telescope Array result using the BHS fit [10]. Also shown are previous results from cosmic ray experiments like Fly’s Eye [11], Akeno [15], HiRes [18], and Auger [13], together with accelerator pp and ¯pp cross section measurement [27], and the recent result from the LHC, by TOTEM at √s=7 TeV [28]. The dotted curve is the QCD inspired fit of the total p-p cross section vs. the center of mass energy √s(GeV) [29]. The result from the UHECR experiments and the reported recent result by the LHC at √s=7 TeV [28] are all in agreement with the BHS fit.
(GeV)
s
1 10 102 103 104 105
(mb)
p-p
σ
0 50 100 150 200 250 300 350
Fly’s Eye Akeno HiRes Auger
Telescope Array pbar-p
pp ppTOTEM
even (QCD-Fit) nn
σ
Figure 3.The proton-proton cross section vs. the center of mass energy for the high energy cosmic ray experi-ments ( [10], [11], [13], [15], [18]). The dashed curve is the QCD inspired fit by BHS [29]. The ¯pp and the pp data are shown in smaller darker circles and square symbols consecutively [27]. The recent result from LHC is also shown by the star marker [28].
5 Conclusion and Outlook
In this proceceeding we presented an overview of the most recent results on the proton-air cross section measurements from UHECR detectors. The data and methods used to deduce the proton air cross section values from the measuredXmaxdistribution was also discussed. At the time of writing of this proceeding the most recent hadronic interaction models used in the conversion ofΛmto theσinelp−air by the high energy cosmic ray experiments are QGSJETII4, Sibyll2.1, QGSJET01, and EPOS-LHC. Results of the several systematic checks made during the analysis were summarized. The final value ofσinel
p−airwas found by the Telescope Array experiment to be equal to 567.0±70.5[Stat.]+ 29 −25[Sys.] mb at √s=95+5
−8TeV [10]. The Auger experiment reportedσinelp−airto be 457.5±17.8[Stat.]+−1925[Sys.] at √s=38.7±2.5 TeV and 485.8±15.8[Stat.]+19
−25[Sys.] at
√
s=55.5±3.6 [3]. The value ofσp−pis also determined fromσinel
For the Telescope Array detector, while the events used in the published analysis were collected with the MD-SD part of the detector (only one out of three FD’s), future cross section results, using events from all three FDs will likely be produced. In addition, for both the Telescope Array and the Auger detector an update with future versions of the high energy cosmic ray shower models is expected. With higher statistical power and updated models the proton air cross section measurement would in principle be able to better constrain the cross section values and predictions at high energies.
References
[1] R. Ulrich, R. Engel, M. Unger, Phys.Rev.D83, 054026 (2011),1010.4310
[2] R. Abbasi, M. Abe, T. Abu-Zayyad, M. Allen, R. Anderson et al., Astropart.Phys.64, 49 (2014), 1408.1726
[3] The Pierre Auger Observatory: Contributions to the 34th
Interna-tional Cosmic Ray Conference (ICRC 2015) (2015), 1509.03732,
http://inspirehep.net/record/1393211/files/arXiv:1509.03732.pdf [4] J. Abraham et al. (Pierre Auger), Phys. Rev. Lett.104, 091101 (2010),1002.0699
[5] Report of the Working Group on the Composition of Ultra High Energy Cosmic Rays(2015), 1503.07540
[6] S. Ostapchenko, Nucl.Phys.Proc.Suppl.151, 143 (2006),hep-ph/0412332 [7] N. Kalmykov, S. Ostapchenko, A. Pavlov, Nucl.Phys.Proc.Suppl.52B, 17 (1997)
[8] E.J. Ahn, R. Engel, T.K. Gaisser, P. Lipari, T. Stanev, Phys.Rev. D80, 094003 (2009), 0906.4113
[9] T. Pierog, I. Karpenko, J. Katzy, E. Yatsenko, K. Werner (2013),1306.0121 [10] R.U. Abbasi et al. (Telescope Array), Phys. Rev.D92, 032007 (2015),1505.01860
[11] R. Baltrusaitis, G. Cassiday, J. Elbert, P. Gerhardy, S. Ko et al., Phys.Rev.Lett.52, 1380 (1984) [12] C. Pryke, Astropart.Phys.14, 319 (2001),astro-ph/0003442
[13] P. Abreu et al. (Pierre Auger Collaboration), Phys.Rev.Lett.109, 062002 (2012),1208.1520 [14] F. Siohan, R. Ellsworth, A. Ito, J. Macfall, R. Streitmatter et al., J.Phys.G4, 1169 (1978) [15] M. Honda, M. Nagano, S. Tonwar, K. Kasahara, T. Hara et al., Phys.Rev.Lett.70, 525 (1993) [16] S. Knurenkoa, A. Sabourovb et al., EPJ Web of Conferences53, 07006 (2013)
[17] H. Mielke, M. Foeller, J. Engler, J. Knapp, J.Phys.G20, 637 (1994) [18] K. Belov (HiRes Collaboration), Nucl.Phys.Proc.Suppl.151, 197 (2006)
[19] G. Aielli et al. (ARGO-YBJ Collaboration), Phys.Rev.D80, 092004 (2009),0904.4198 [20] M. Aglietta et al. (EAS-TOP Collaboration), Phys. Rev. D79, 032004 (2009)
[21] R. Glauber, G. Matthiae, Nucl.Phys.B21, 135 (1970)
[22] R. Engel, T. Gaisser, P. Lipari, T. Stanev, Phys.Rev.D58, 014019 (1998),hep-ph/9802384 [23] J. Dias de Deus, P. Kroll, Acta Phys. Polon.B9, 157 (1978)
[24] A. Buras, J. Dias de Deus, Nucl.Phys.B71, 481 (1974)
[25] A. Donnachie, P. Landshoff, Phys.Lett.B296, 227 (1992),hep-ph/9209205 [26] M. Block, Phys.Rev.D84, 091501 (2011),1109.2940
[27] C. Avila et al., Phys.Lett. B445, 419–422 (1999)
[28] G. Antchev, P. Aspell, I. Atanassov, V. Avati, J. Baechler et al., Europhys.Lett.96, 21002 (2011), 1110.1395
![Figure 3 shows theexperiments and the reported recent result by the LHC at−are previous results from cosmic ray experiments like Fly’s Eye [11], Akeno [15], HiRes [18], andAuger [13], together with accelerator pp and ¯pp cross section measurement [27], and](https://thumb-us.123doks.com/thumbv2/123dok_us/8158909.1361107/6.482.100.356.229.408/figure-theexperiments-reported-previous-experiments-andauger-accelerator-measurement.webp)
