International Journal of Research (IJR)
e-ISSN: 2348-6848, p- ISSN: 2348-795X Volume 2, Issue 10, October 2015 Available at http://internationaljournalofresearch.org
Harmonic Identification and Mitigation using APF in
Distribution System Consisting of Single Non Linear Load
S. V. D. Anil Kumar
Assoc. Professor, Department of EEE, St. Ann’s College of Engg. and Tech.
Chirala - 523187, Andhra Pradesh, India
E-mail: [email protected]
Dr. K. Ramesh Reddy
HOD & Dean of PG Studies, GNITS, Hyderabad, Telangana., India
E-mail: [email protected]
Abstract─
This paper presents a unique approach for source side compensation of current harmonics occurred to the presence of nonlinear characteristic loads in power systems by the implementation of Active power filter (APF). This is often as a result of optimizing the ability system networks exploitation typical mathematical modeling based mostly linearized approaches is kind of tough owing to the advanced, nonlinear and non-stationary nature of systems that involve an outsized variety of difference constraints. In order avoid the complexness of conventional concepts in this paper the implementation of Total Harmonic Power (THP) to 2 complete cases with and without APF are proposed i.e. identifying the harmonics and reducing their effect with APF has been planned here to lower down the supply current Total harmonic distortion (THD) sufficiently below fifth order so as to satisfy the IEEE-519 std. even beneath distorted offer. Intensive MATLAB simulations and comparative analysis were applied for cases with and without APF management schemes using THP control techniques.
Key words: Harmonics; total harmonic power; nonlinear load; active power filter
I. INTRODUCTION
The general use of power electronic devices in our daily applications, disturbances occur on the electrical provide network. These disturbances are for extensive utilization of non-linear devices. These can introduce harmonics within the facility thereby inflicting instrumentality warming; malfunction of devices, EMI connected issues etc.
Active Power Filters (APF) is extensively can be useful to compensate this harmonics and unbalanced load problems. Power quality is one in every of the foremost necessary topics that electrical engineers are noticed in recent years. Identifying the harmonics is one in every of the issues associated with power quality.
International Journal of Research (IJR)
e-ISSN: 2348-6848, p- ISSN: 2348-795X Volume 2, Issue 10, October 2015 Available at http://internationaljournalofresearch.org
research efforts have been directed to these problems [4]–[7]. However, there are still no satisfactory solutions.
The total harmonic power (THP) method [10] is a simple method that uses the sign of the THP at a specific node to decide on whether the source of harmonic pollution is upstream or downstream from this node. Despite its simplicity, this method suffers from two main drawbacks: 1) the concept of upstream and downstream cannot be applied to nonradial networks. 2) the sign of the THP depends on the phase shifts between the voltages and currents at different harmonic orders. Hence, any error in calculating these phase shifts affects the reliability of the method. Such a problem becomes serious for higher harmonic orders when the system has an inductive nature and the phase shifts approach 90 [12]. The capability of the THP method in identifying the source of harmonic pollution correctly has been questioned by some researchers. The results were not similar for some cases and, thus, the THP method was assumed to fail in these cases. However, using an index that is entirely designed for the method proposed in [6], as a basis for the comparison, seems unreasonable. Accordingly, the THP method was assumed to be unsuitable for some cases as it cannot accommodate this concept. However, this idea is questionable, because it assumes that a load that will increase the ability loss within the system as a result of the generation of harmonic powers will still be outlined as not a problematic load that is certainly not a sensible assumption.
AC
C B
A
Zs
supply
Z11 Z12
APF Non Linear Load
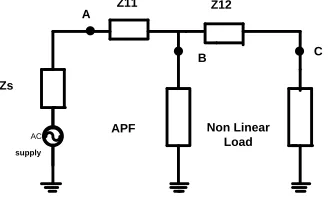
Fig. 1. Simple network with a nonlinear load connected to a sinusoidal supply with APF.
II. TOTAL HARMONIC POWER METHOD
The fundamentals of the THP technique are often illustrated by using the circuit shown in Fig. 1. a perfect sinusoidal voltage source is connected to a nonlinear load through the system impedance. The nonlinear load generates harmonic currents that flow
within the system inflicting voltage distortion at PCC. This voltage distortion depends on each the harmonic currents and the system electrical phenomenon at harmonic frequencies. The distorted voltage and current at PCC are often expressed by Fourier series as
vpcc(t)= V0 + ∞ℎ=1 2𝑉ℎ sin(ℎ𝜔1𝑡 + 𝜃ℎ𝑉)
(1)
ipcc(t)= V0 + ∞ℎ=1 2𝐼ℎ sin(ℎ𝜔1𝑡 + 𝜃ℎ𝐼)
(2)
where Vpcc(t) and ipcc(t) are the instantaneous voltage and current at point pcc, h is the harmonic order, 𝛚1 is the fundamental angular frequency of the supply, V0 and I0 are the magnitudes of dc components of the voltage and current, Vh and Ih are the rms values of the voltage and current at frequency h𝛚1, and 𝝷hv and 𝝷hI are the phase shifts of the hth harmonic voltage and current with respect to a common reference.
The instantaneous power at any point in the system is defined as
p(t)=v(t).i(t) (3)
The average power at point pcc is
Ppcc =1
𝑇 𝑝𝑏(𝑡)𝑑𝑡
𝑇
0 (4)
.˙. Ppcc=V0I0 + ∞ℎ=1𝑉ℎ𝐼ℎ𝑐𝑜𝑠ɸℎ (5)
The average power at point pcc can be decomposed into: 1) power due to dc components P0; 2) fundamental active power P1; and 3) total harmonic active power PH
Ppcc=P0+P1+PH (6)
P0=V0I0 (7)
P1=V1I1𝑐𝑜𝑠ɸ1 (8)
PH= ∞ℎ =2𝑉ℎ𝐼ℎ𝑐𝑜𝑠ɸℎ (9)
Consider the voltage at point A as a reference, hence
International Journal of Research (IJR)
e-ISSN: 2348-6848, p- ISSN: 2348-795X Volume 2, Issue 10, October 2015 Available at http://internationaljournalofresearch.org
Applying the procedure outlined before to point A, the average power at A can be given by
PA1=VA1IB1 𝑐𝑜𝑠ɸ1 (11)
Equation (11) demonstrates the well-known fact that a sinusoidal source delivers power only at the fundamental frequency. Some of this power is dissipated in the resistance of the system impedance and the rest flows to the load side. The nonlinear load is the only source of distortion in this case that generates harmonic currents at different frequencies. Thus, harmonic powers, with a total value of PH flow from the load side to the supply side and are dissipated in the resistance of the system impedance [18]. As a conclusion, the nonlinear load converts power at the fundamental frequency to powers at the fundamental and harmonic frequencies. The THP method suggests that the THP at a certain node is an indication for the existence of a polluting load. Moreover, the sign of this power can be used to identify the location of the polluting load in radial systems as follows.
If PH positive at a certain point in the system, then a harmonic source exists upstream of this point and the harmonic power is received from the source side.
If PH is negative, then a harmonic source exists downstream of the node under study, and the harmonic power is received from the load side.
III. SYSTEM CONFIGURATION
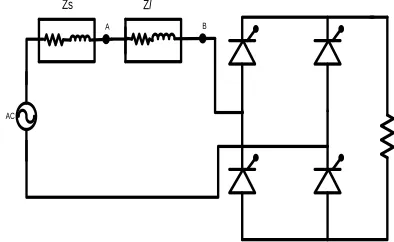
Case 1: THP method for nonlinear loads with resistive load of 100 Ω, input 230-Vrms, 50-Hz sinusoidal supply with an internal impedance of Zs=1+j6.28 Ω is connected to Node A without APF
of the circuit shown in Fig. 2. The line impedance is Zl= 2+j12.56 Ω and the load is a phase-controlled
bridge rectifier with a firing angle of α=30o
1) The fundamental power P1 is positive at nodes A and B and decreases from A to B. This indicates that the supply is delivering fundamental power to the load and some of this power is lost in the line resistance.
AC
A B
Zl
Zs
Fig .2. Nonlinear load with R load connected to an AC supply without APF
Case 2: THP method for nonlinear load of input voltage of 230-Vrms, 50-Hz sinusoidal supply with an internal impedance of Zs=1+j6.28 Ω is connected
to Node A the Resistive load is a phase-controlled bridge rectifier with a firing angle of α=30o
. With APF of the circuit shown in Fig. 3. 8nf of capacitive source, filter impedance of Zf= 0.01+j0.05 Ω
APF
Z1 Z2
R
C L
V
Fig .3. Nonlinear load with R load connected to an AC supply with APF
IV. CONTROLLER FOR APF
International Journal of Research (IJR)
e-ISSN: 2348-6848, p- ISSN: 2348-795X Volume 2, Issue 10, October 2015 Available at http://internationaljournalofresearch.org
PLL
PI
PWM generator Vs
Sinwt
Vdcact
Vdcref
Iload
Isource
Icompan
Gate pulse
Fig.4. Block diagram representation of control scheme
A. Magnitude of the Reference current
A PI controller is used to maintain the DC link voltage at specified value. The DC link voltage is sensed and compared with reference value and the error is passed through a PI controller.
Vdcref = Vdc*-Vdc
Thus the output of dc link voltage regulator results in current Im.
B. Current Control of VSI
Sinusoidal wave form generated from Phase Locked Loop(PLL)
Va=Vm x Sin(wt)
Ua =Sin(ѳ)
The multiplication of current Im with sine wave form ( Ua ) generate reference current (la*).
The instantaneous values of reference grid currents are computed as
Ia* = Im . Ua
Current errors are obtained by comparing reference grid currents ( Ia*) with actual grid currents ( Ia ). These current errors are given to the hysteresis current controller.
Iaerr = Ia* - Ia
C. Switching Control of lGBTs
Switching pulses are generated using hysteresis current controller. There are various current control methods for active power filter configurations but hysteresis method is preferred among other current
control methods because of quick current
controllability, easy implementation and
unconditioned stability .The conventional current control scheme is the hysteresis method where the actual filter currents are compared with their
reference currents with a predefined hysteresis band in their respective phases. Thus the actual currents track the reference currents generated by current control loop. The switching pattern of each IGBT is formulated as,
If (la* - Ia ) = +hb then the upper switch S1 will be ON in the phase a leg of inverter.
If (la* - Ia ) = -hb then the lower switch S4 will be ON in the phase a leg of inverter.
Where, hb width of hysteresis band.
V. MATLAB/SIMULINK OUTPUTS
Case I: Simulation analysis for Resistive load based Non
linear load at α=300 without APF
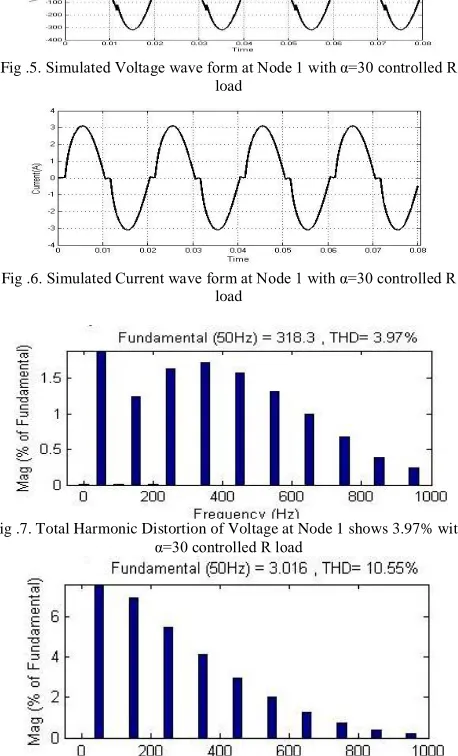
Fig .5. Simulated Voltage wave form at Node 1 with α=30 controlled R load
Fig .6. Simulated Current wave form at Node 1 with α=30 controlled R load
Fig .7. Total Harmonic Distortion of Voltage at Node 1 shows 3.97% with α=30 controlled R load
International Journal of Research (IJR)
e-ISSN: 2348-6848, p- ISSN: 2348-795X Volume 2, Issue 10, October 2015 Available at http://internationaljournalofresearch.org
Fig .9. Simulated Voltage wave form at Node 2 with α=30 controlled R load
Fig .10. Simulated Current wave form at Node 2 with α=30 controlled R load
Fig .11. Total Harmonic Distortion of Voltage at Node 1 shows 12.32% with α=30 controlled R load
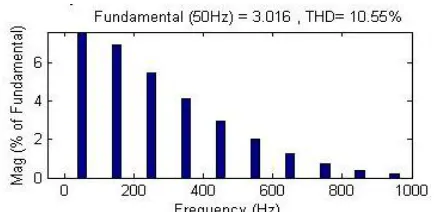
Fig .12. Total Harmonic Distortion of Current at Node 2 shows 10.55% with α=30 controlled R load
Case II: Simulation analysis for Resistive load based Non linear load
linear load at α=300 with APF
Fig .13. Simulated Current wave form injected with APF
Fig .14. Simulated Voltage wave form at Node 1 with α=30 controlled R- load with APF
Fig .15. Simulated Current wave form at Node 1 with α=30 controlled R-load
Fig .16. Total Harmonic Distortion of Voltage at Node 1 shows 0.27% with α=30 controlled R-load with APF
International Journal of Research (IJR)
e-ISSN: 2348-6848, p- ISSN: 2348-795X Volume 2, Issue 10, October 2015 Available at http://internationaljournalofresearch.org
Fig. 18. Simulated Voltage wave form at Node 2 with α=30 controlled R-load with APF
Fig .19. Simulated Current wave form at Node 2 with α=30 controlled R-load with APF
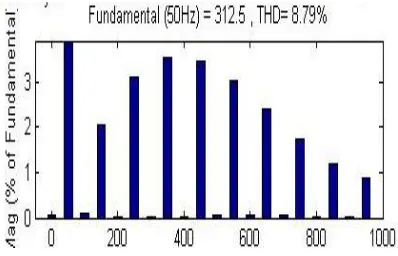
Fig .20. Total Harmonic Distortion of Voltage at Node 2 shows 8.79% with α=30 controlled R-load with APF
Fig .21. Total Harmonic Distortion of Current at Node 2 shows 1.43% with α=30 controlled R-load with APF
TABLE I
Harmonics in Voltages and Currents with Rectifier Controlled R-Load with and without APF
Harmonics in
Without APF With APf
Node 1 Node 2 Node 1 Node 2
V 3.97% 12.32% 0.27% 8.97%
I 10.55% 10.55% 1.43% 1.43%
VI. CONCLUSION
In this paper it has been studied the recognition of harmonic pollution caused due to resistive based non-linear loads. The harmonic analysis has done with non linear load controlled with α=300
. The harmonic caused due these non radial loads has been efficiently recognized and calculated with Total Harmonic Power method. And finally compensated by using Active power filter From the simulation analysis it is proved that for a certain node in the system, the sign of the fundamental power can be used as a reference, while the signs of the harmonic powers are compared to this reference sign to specify the responsibility of the load connected to this node to the harmonic pollution. The new modification was applied to several case studies and proved to be successful. Moreover, to eliminate the possible errors associated with measuring the harmonic powers due to calculating the phase shifts between harmonics.
REFERENCES
[1] W. M. Grady and S. Santoso, ―Understanding power system harmonics,‖ IEEE Power Eng. Rev., vol. 21, no. 11, p. c2, Nov. 2001.
[2] L. F. Beites, J. G. Mayordomo, A. Hernández, and R. Asensi, ―Harmonics, interharmonics and unbalances of arc furnaces: A new frequency domain approach,‖ IEEE Trans. Power Del., vol. 16, no. 4, pp. 661–668, Oct. 2001.
International Journal of Research (IJR)
e-ISSN: 2348-6848, p- ISSN: 2348-795X Volume 2, Issue 10, October 2015 Available at http://internationaljournalofresearch.org
measurement,‖ in Proc. 18th IEEE Instrumentation and Measurement Technology Conf., Budapest, Hungary, 2001, vol. 3, pp. 2130–2135.
[5] M. Aiello, A. Cataliotti, V. Cosentino, and S. Nuccio, ―A self-synchronizing instrument for harmonic source detection in power systems,‖ IEEE Trans. Instrum. Meas., vol. 54, no. 1, pp. 15–23, Feb. 2005.
[6] W. Xu and Y. Liu, ―A method for determining customer and utility harmonic contributions at the point of common coupling,‖ IEEE Trans.Power Del., vol. 15, no. 2, pp. 804–811, Apr. 2000.
[7] C. Chen, X. Liu, D. Koval, W. Xu, and T. Tayjasanant, ―Critical impedance method—A new detecting harmonic sources method in distribution systems,‖ IEEE Trans. Power Del., vol. 19, no. 1, pp. 288–297, Jan. 2004.
[8] N. Hamzah, A. Mohamed, and A. Hussain, ―Harmonic source location at the point of common coupling based on voltage magnitude,‖ in Proc.IEEE Region 10 Conf., Nov. 2004, vol. C, pp. 21–24.
[9] K. Srinivasan, ―On separating customer and supply side harmonic contributions,‖ IEEE Trans. Power Del., vol. 11, no. 2, pp. 1003–1012,
Apr. 1996.
[10] P. H. Swart, M. J. Case, and J. D. van Wyk, ―On techniques for localization of sources producing distortion in electric power networks,‖ presented at the 2nd IntWorkshop on Power Definitions and Measurements Under Nonsinusoidal Conditions, Stresa, Italy, Sep. 8–10, 1993.