ISSN (Print) : 2320 – 3765 ISSN (Online): 2278 – 8875
I
nternational
J
ournal of
A
dvanced
R
esearch in
E
lectrical,
E
lectronics and
I
nstrumentation
E
ngineering
(An ISO 3297: 2007 Certified Organization)
Website: www.ijareeie.com Vol. 6, Issue 7, July 2017
Analysis of Retinal Fundus Images Exudates
Using Texture Based RLBP
A. Kaur1, M. Aggarwal2
PG Student, Dept. of ECE, Bhai Gurdas Institute of Engg. and Tech, Sangrur, Punjab, India1
Assistant Professor, Dept. of ECE, Bhai Gurdas Institute of Engg. and Tech, Sangrur, Punjab, India 2
ABSTRACT: Retinal images are used for diagnose eye diseases such as diabetic retinopathy, glaucoma and macular degeneration. Automatic diagnosis must be robust enough to establish the disease’s existence and to classify it. The performance of automated methods strongly depends on the quality of the images. Factors such as operating personnel’s level of experience, patient head or eye movement and blinking can significantly influence the quality of retinal fundus images. Photos of poor quality might lead to incorrect diagnosis of eye disease and the grading of its severity. Major factors that reduce image quality include uneven illumination, poor contrast, blurriness and poor visibility of important components such as the macula and optic disc. So in order to classify or detection of these diseases with more accuracy, retinal image need to be enhanced first. Existed literature did not carried out contrast improvements it takes LBP features of original images.
KEYWORDS:Exudates ,RLBP ,k-Nearest Neighbour , ANN , Feature Extraction.
I. INTRODUCTION
Around 300 BC, a Greek physician called Herophilus of Chalcedon was the anatomist who described the retina, but it was named by another physician called Rufos of Ephesus in 110 AD. It seemed to the early anatomists as a container which supports and contains the vitreous. In the second century AD, Galen defined many of the fundamental features of the anatomy and physiology of the eye. He noted structural similarities to the brain; however he was incapable to present further understanding on how the retina functions. The first scientist who suggested that the retina plays a vital role as the primary photoreceptor tissue was Johannes Kepler in the 17th century. In 1835, Treviranus performed the first extensive microscopic retinal researches by using alcohol fixation. With the modern scientific revolution, the subsequent development of electron microscopy, fluorescein angiography, trypsin digestion, and optical coherence tomography have enabled scientists to comprehend the cellular connections within the retina, ultra-structure, and retinal vasculature, and also correlate clinical and anatomical findings (Browning (2010)) [1]. Nowadays, fundus images are used as visual records which document the current ocular fundus of a patient. One fundus image is worth a thousand words in the ophthalmologist's notes. They allow the ophthalmologist to further study a patient's retina and identify retinal changes for more accurate diagnosis.
II. LITERATURE SURVEY
ISSN (Print) : 2320 – 3765 ISSN (Online): 2278 – 8875
I
nternational
J
ournal of
A
dvanced
R
esearch in
E
lectrical,
E
lectronics and
I
nstrumentation
E
ngineering
(An ISO 3297: 2007 Certified Organization)
Website: www.ijareeie.com Vol. 6, Issue 7, July 2017
significantly reduced during vessel enhancement. Retinal vascular enhancement is achieved with a multiple-scale Hessian approach.
TraianCaramihaleet. al. [4]proposes a new method for the detection and evaluation of exudates in retinal images. In the learning phase they focus on selecting efficient features that can uniquely identify the exudates. In this process they develop a neural network for image processing. They then further extend and train the neural network to detect and evaluate the exudates. The efficiency of the proposed method is compared with other similar researches, improvements in accuracy being observed.
Qing Liu et. al. [5] presented a location-to-segmentation strategy to segment the exudates in retinal fundus images. It involves three stages. The first stage, i.e. pre-process stage, can provide the visualisation for the main anatomic structures such as the optic disk and the main vessels. In the second stage, the local structure of the exudates is described via CLBP. A random forest classifier is learned to locate the exudate candidates. In third stage, the local variance, exudate size prior and local contrast prior is used to segment the exudate regions from each patch. The proposed method detect sand quantifies the exudate regions, and further facilitates for the ophthalmologists in the diabetic retinopathy screening and diagnosis process. The experimental results on the public exudate detection data set show its superiority both at exudate-level evaluation and image-level evaluation compared to the state-of-the-art method.
III. SCOPE OF RESEARCH
The present research introduces a comparison among two classifiers for EXs detection. These are a K nearest neighbor and neural network classifier: multilayer perceptron (MLP) Hence, the aims of the present study were: (i) to develop an automatic method for the detection of EXs in retinal images, (ii) to compare the performance of two classifiers in this context, (iii) to assess the diagnostic potential of the proposed method in DR detection.
IV. PROPOSED WORK
ISSN (Print) : 2320 – 3765 ISSN (Online): 2278 – 8875
I
nternational
J
ournal of
A
dvanced
R
esearch in
E
lectrical,
E
lectronics and
I
nstrumentation
E
ngineering
(An ISO 3297: 2007 Certified Organization)
Website: www.ijareeie.com Vol. 6, Issue 7, July 2017
‘
‘’
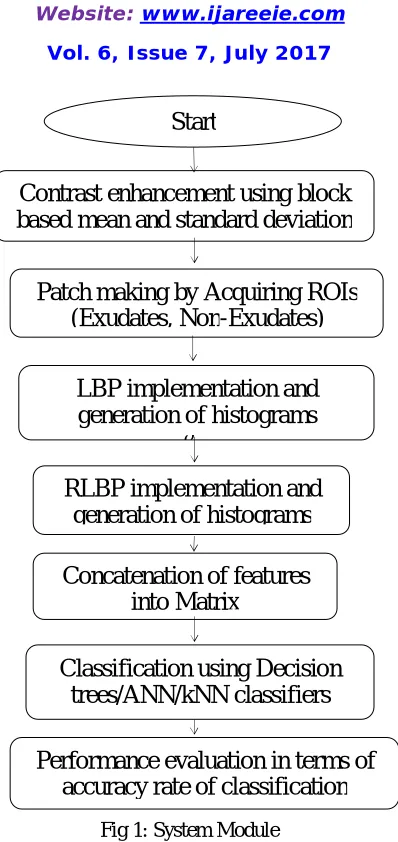
Fig 1: System Module
Given an image feature set, different classifiers are employed to classify the images into normal and exudate image. The steps used are explained above.
Image enhancement
In order to have an effective estimation, we follow the strategy of [6]. Here, the image (green channel) is separated into a set of background and foreground (made up of retinal structures of interest) pixels first. Next, the degradation components are estimated from the background image. This strategy is motivated by the fact that the retinal structures can bias the luminosity component. For instance, the optic disk is a naturally high luminosity zone and the vessels (dark) are a low luminosity zone.
The background pixels are extracted from
I
using the local mean and standard deviation as follows:1. For every point on the sampling grid compute the local mean
and
within a window of sizew
.
w
Patch making by Acquiring ROIs
(Exudates, Non-Exudates)
LBP implementation and
generation of histograms
RLBP implementation and
generation of histograms
Concatenation of features
into Matrix
Classification using Decision
trees/ANN/kNN classifiers
Start
Contrast enhancement using block
based mean and standard deviation
ISSN (Print) : 2320 – 3765 ISSN (Online): 2278 – 8875
I
nternational
J
ournal of
A
dvanced
R
esearch in
E
lectrical,
E
lectronics and
I
nstrumentation
E
ngineering
(An ISO 3297: 2007 Certified Organization)
Website: www.ijareeie.com Vol. 6, Issue 7, July 2017
3. Compute the Mahalanobis distance
D x y
,
as follows.
(x y)
,
,
,
x y
D x y
x
I
y
(4.3)Given an image, a pixel is taken to belong to the background if
D x y
,
t
wheret
is a fixed threshold. The degradation components are estimated from the background image by computing the local mean and the standarddeviation values at every point
x y
,
, within a window of size
w
0
w
0
. The desired contrast componentS
M is nothing but the standard deviation and the luminosity component isS
A.Finally, the true imageU x y
,
is obtained by applying the point transformation (equation 2) to each pixel of the image. Patch Extraction
A given image is divided into fixed number of square patches P(r), with r denoting the location with reference to the image origin. Different patches are extracted from both normal images and images having exudates in them.
Patch Level Feature Extraction
Features are derived on each patch P(r) in the image. Since the objective is to retrieve pathologically similar (exudates/ normal) images, derived features must discriminate between normal and exudates patches.
Local binary patterns for texture evaluation
The Local Binary Pattern (LBP) operator is an operator that describes the surroundings of a pixel by generating a bit code from the binary derivatives of a pixel. The operator is usually applied to gray scale images and derivative of the intensities.
The LBP operator takes 3
3 surrounding of a pixel and1. Generates a binary 1 if the neighbor is greater than or equal to the centre.
2. Generates a binary 0 if the neighbor is less than the centre.
The eight neighbours of the centre can then be represented by an 8-bit number.
Rotated Local Binary Pattern (RLBP)
The problem of variations to rotations in LBP arises due to the fixed arrangement of weights. As the weights are aligned in a circular manner, the effect of image rotations can be countered by rotating the weights by the same angle while computing the descriptor. Since the angle of the rotation cannot be known, we propose an adaptive arrangement of weights based on the locally computed reference direction.
ISSN (Print) : 2320 – 3765 ISSN (Online): 2278 – 8875
I
nternational
J
ournal of
A
dvanced
R
esearch in
E
lectrical,
E
lectronics and
I
nstrumentation
E
ngineering
(An ISO 3297: 2007 Certified Organization)
Website: www.ijareeie.com Vol. 6, Issue 7, July 2017
1
mod(p D,P) ,
0
(g
g ) 2
PR P p c
P
RLBP
s
Classifiers Testing
We have used three classifiers Artificial neural network, K-nearest neighbor and Decision trees. The classifiers have been trained by training data is now tested that how much they learn to identify an exudate image this is done by giving testing data to the classifiers. The outputs are calculated for all the images present in the testing data and compared with the tag values to evaluate the performance of each classifier respectively.
V. RESULTS
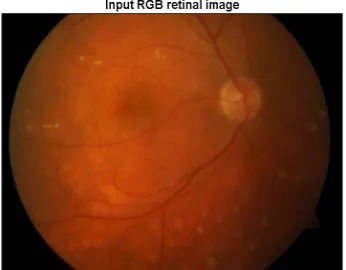
We use MATLAB software to verify the algorithm. MATLAB is a high-performance language for technical computing. It integrates computation, visualization, and programming in an easy-to-use environment where problems and solutions are expressed in familiar mathematical notation.The information which is required for further processing on the retinal image may be degraded due to fluctuations of light or proper illumination problem, & the same image capture by camera is known as raw image. For further operations on this image, quality improvement of the same is necessary as hard and soft exudates need to be separated in intensity from the background; that’s why preprocessing is essential stage in which mean and standard deviation based on blocks has been used to get the enhanced image. After that patches has been generated by using corresponding binary mask of the retinal images which gives the information regarding the content in the original image. High intensity mask shows the locations where the defected pixels has been found having exudates in them. Square patches have been extracted from whole dataset and feature extraction has been carried out using LBP and RLBP texture algorithms. After that classifiers has been used to classify the dataset into two categories i.e. normal and having exudates.
ISSN (Print) : 2320 – 3765 ISSN (Online): 2278 – 8875
I
nternational
J
ournal of
A
dvanced
R
esearch in
E
lectrical,
E
lectronics and
I
nstrumentation
E
ngineering
(An ISO 3297: 2007 Certified Organization)
Website: www.ijareeie.com Vol. 6, Issue 7, July 2017
Fig3: Square patches extracted from preprocessed image
Classification Accuracy
The classification accuracy is the extent to which the classifier is able to correctly classify the exemplars and is summarized in the form of confusion matrix to the test data. This is defined as the ratio of the number of correctly classified patterns (TP and TN) to the total number of patterns (species) classified.
Accuracy =
Sensitivity
The sensitivity of a classifier is the fraction of the Plant samples correctly classified as that specific species class.It is defined by equation below :
Se =
Specificity
The specificity is the fraction of normal species correctly classified as normal class. It is also called selectivity.
Sp =
ISSN (Print) : 2320 – 3765 ISSN (Online): 2278 – 8875
I
nternational
J
ournal of
A
dvanced
R
esearch in
E
lectrical,
E
lectronics and
I
nstrumentation
E
ngineering
(An ISO 3297: 2007 Certified Organization)
Website: www.ijareeie.com Vol. 6, Issue 7, July 2017
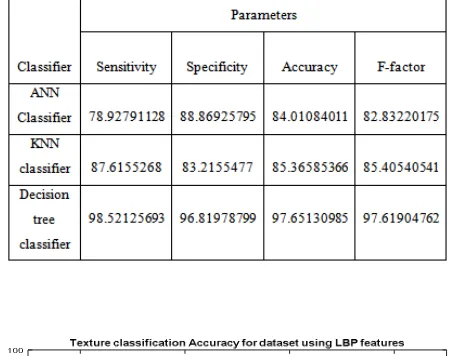
Table1 Results in tabular form using LBP feature extraction
Table 2: Results in tabular form using RLBP feature extraction
ISSN (Print) : 2320 – 3765 ISSN (Online): 2278 – 8875
I
nternational
J
ournal of
A
dvanced
R
esearch in
E
lectrical,
E
lectronics and
I
nstrumentation
E
ngineering
(An ISO 3297: 2007 Certified Organization)
Website: www.ijareeie.com Vol. 6, Issue 7, July 2017
Fig 5: Performance evaluation using KNN classifier for LBP features
Fig 6: Performance evaluation using ANN classifier for LBP features
ISSN (Print) : 2320 – 3765 ISSN (Online): 2278 – 8875
I
nternational
J
ournal of
A
dvanced
R
esearch in
E
lectrical,
E
lectronics and
I
nstrumentation
E
ngineering
(An ISO 3297: 2007 Certified Organization)
Website: www.ijareeie.com Vol. 6, Issue 7, July 2017
Fig 8: Performance evaluation using KNN for RLBP features
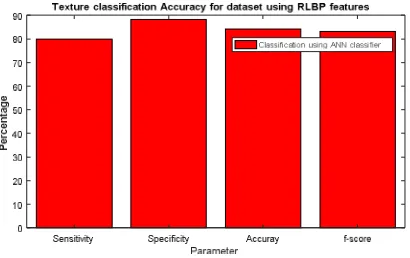
Fig9: Performance evaluation using ANN classifier for RLBP features
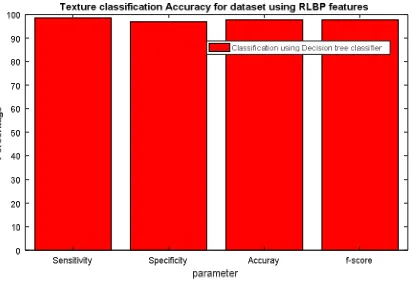
From the table and graphs above it has been found that there is more accuracy in classification using the proposed feature extraction algorithm. We have used rotated local binary pattern which considers the dominant direction while defining weights in center pixel evaluation. We have tested the LBP and RLBP features using three different classifiers i.e. KNN, ANN and decision tree in which all classifiers gives high accuracy when RLBP is used. Hence founds it better than LBP features.
VI. CONCLUSION
ISSN (Print) : 2320 – 3765 ISSN (Online): 2278 – 8875
I
nternational
J
ournal of
A
dvanced
R
esearch in
E
lectrical,
E
lectronics and
I
nstrumentation
E
ngineering
(An ISO 3297: 2007 Certified Organization)
Website: www.ijareeie.com Vol. 6, Issue 7, July 2017
REFERENCES
[1] Browning, D. J, “Diabetic Retinopathy: Evidence-Based Management” Springer Science & Business Media (2010).
[2]M. Omar, F. Khelifi and M. A. Tahir, "Detection and classification of retinal fundus images exudates using region based multiscale LBP texture approach," 2016 International Conference on Control, Decision and Information Technologies (CoDIT), St. Julian's, 2016, pp. 227-232
[3]R. Annunziata, A. Garzelli, L. Ballerini, A. Mecocci and E. Trucco, "Leveraging Multiscale Hessian-Based Enhancement With a Novel Exudate Inpainting Technique for Retinal Vessel Segmentation," in IEEE Journal of Biomedical and Health Informatics, vol. 20, no. 4, pp. 1129-1138, July 2016
[4]T. Caramihale, D. Popescu and L. Ichim, "A neural-network based approach for exudates evaluation in retinal images," 2017 10th International
Symposium on Advanced Topics in Electrical Engineering (ATEE), Bucharest, 2017, pp. 268-273
[5] Qing Liu, BeijiZou, Jie Chen, Wei Ke, KejuanYue, Zailiang Chen, Guoying Zhao, "A location-to-segmentation strategy for automatic exudate segmentation in colour retinal fundus images" Published in: Computerized Medical Imaging and Graphics 55 (2017) 78–86
[6] G. D. Joshi and J. Sivaswamy, "Colour Retinal Image Enhancement Based on Domain Knowledge," 2008 Sixth Indian Conference on Computer
Vision, Graphics & Image Processing, Bhubaneswar, 2008, pp. 591-598.