Double Refinement Network
for Room Layout Estimation
Ivan Kruzhilov1,2 [email protected]
1Moscow Power Engineering Institute
Moscow, Russia Mikhail Romanov2
2Samsung AI Center
Moscow, Russia Anton Konushin2,3
3Lomonosov Moscow State University
Moscow, Russia
Abstract
Layout estimation is a challenge of segmenting a cluttered room image into floor, walls and ceiling. We applied Double refinement network proved to be efficient in the depth estimation to generate heat maps for room key points and edges. Our method is the first not using encoder-decoder architecture for the room layout estimation. ResNet50 was utilized as a backbone for the network instead of VGG16 commonly used for the task, allowing the network to be more compact and faster. We designed a special layout score function and layout ranking algorithm for key points and edges output. Our method achieved the lowest pixel and corner errors on the LSUN data set. The input image resolution is 224*224.
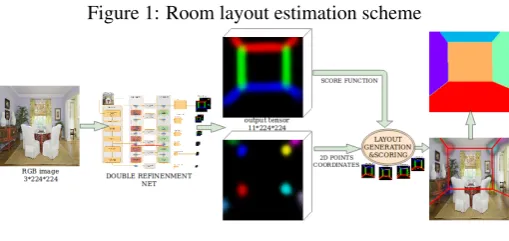
Figure 1: Room layout estimation scheme
1
Introduction
Room layout estimation finds its application in different areas including augmented reality, robotics, indoor navigation [3].
The task is to find positions of the room corners and their connecting edges on a 2D room image. RGB images are often used as a standard input, although RGBD input is also possible [18]. The floor, ceiling and walls in a room are considered to be perpendicular that sometimes is referred as ‘Manhattan assumption’[4]. Furniture and other clutter in the room
c
2019. The copyright of this document resides with its authors. It may be distributed unchanged freely in print or electronic forms.
are the main challenge, as they make some key points and lines invisible. The two basic metrics for the room layout estimation are pixel and corner errors.
We estimate a room layout in two stages:
1. Key points and edges heat map estimation by a fully convolutional neural network.
2. Heat map post-processing.
We used Double refinement net [7] with pretrained ResNet50 backbone for key points and edges heat maps estimation. The other room layout estimation methods [5, 10, 14,
15] use decoder architecture predominantly with VGG16 backbone. The encoder-decoder architecture has a drawback of losing information on high-level features. For this reason, we decided to use an iterative refinement structure where low and high level features are analysed at different levels and then connected step-wise. This architecture is usually applied for segmentation task [12,16].
Double refinement network was initially proposed for the depth estimation, and we demonstrated that it could be applied for more complex tasks without major changes. Be-sides constructing an efficient network for the room layout estimation our purpose is to show that methods used for the depth estimation are applicable for other areas.
The chosen architecture allows to combine depth and layout estimation in one network which could be beneficial for robotics vision including odometry and re-localization map-ping [11,13,20]. The other layout estimation methods use custom networks applied only for the specific task of layout estimation.
The novelty of our method involves the utilization of ResNet50 as a backbone in lieu of VGG16. ResNet50 is four times faster [2] than VGG16 (approx. 4 vs 15 GFLOPs) and has significantly less (25 million vs 138 million) parameters, making the network we use more compact and efficient than the architectures proposed in the state-of-the-art layout estimation methods.
Our post-processing algorithm is the first to construct the layout on both key points and edges heat maps. Edges heat maps were used in LayoutNet [22] for the regularization only. The post-processing algorithm is faster and simpler in implementation than the state-of-the-art handling with segmentation and edge maps [19].
We evaluated our results on the LSUN layout challenge validation dataset and surpassed the state of the art results in pixel and corner errors. When tested on Hedau dataset, the method achieved the second best results in pixel error.
The input image resolution is 224*224. The recent study [19] with the best state-of-the-art results used the same input image resolution.
2
Related works
In this section we will focus on the recent (since 2015) room layout reconstruction methods. We address to [1,6,17] to explore earlier methods.
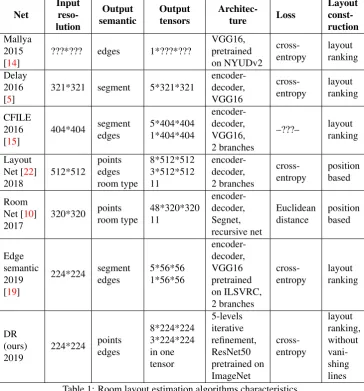
Mallya [14] showed that the fully connected neural network predicted edges better than the structured random forest. All layout reconstruction methods have shared the same pattern from that moment on. A fully connected neural network generates a heat map, and a layout is to be built on a post-processing stage. A summary of recent layout estimation methods is presented in Table1.
Net Input reso-lution Output semantic Output tensors Architec-ture Loss Layout const-ruction Mallya 2015 [14]
???*??? edges 1*???*???
VGG16, pretrained on NYUDv2 cross-entropy layout ranking Delay 2016 [5]
321*321 segment 5*321*321
encoder-decoder, VGG16 cross-entropy layout ranking CFILE 2016 [15]
404*404 segment edges 5*404*404 1*404*404 encoder-decoder, VGG16, 2 branches –???– layout ranking Layout Net [22] 2018 512*512 points edges room type 8*512*512 3*512*512 11 encoder-decoder, 2 branches cross-entropy position based Room Net [10] 2017 320*320 points room type 48*320*320 11 encoder-decoder, Segnet, recursive net Euclidean distance position based Edge semantic 2019 [19]
224*224 segment edges 5*56*56 1*56*56 encoder-decoder, VGG16 pretrained on ILSVRC, 2 branches cross-entropy layout ranking DR (ours) 2019 224*224 points edges 8*224*224 3*224*224 in one tensor 5-levels iterative refinement, ResNet50 pretrained on ImageNet cross-entropy layout ranking, without vani-shing lines Table 1: Room layout estimation algorithms characteristics
There are 3 types of heat maps namely segmentation, edges and key points. Each pixel of a heat map contains the probability that a pixel of the original image belongs to a certain class. Segmentation heat map consists of 5 layers: two for a floor and a ceiling and three for walls. Edge heat map consists of one or three layers. Three layers heat map allows to distinguish floor, walls and ceiling edges, whereas one layer heat map does not differentiate among them.
bound-ary. If key points are close enough their heat maps overlap which significantly deteriorates layout reconstruction and accuracy. For that reason, a key points heat map should contain multiple layers (one layer for each key point).
Most of the recent post-processing methods [5,14,15,19] use layout ranking procedure to construct a final layout. This procedure has two attributes: layouts generation and a score function. Our method is the only layout ranking method where combinatorical approach is used instead of vanishing points and lines estimation. The other methods [5,14,15] utilized vanishing points and lines approach. [19] uses in addition a predefined pool of 4000 layouts. The only methods where layout ranking is not applied are RoomNet [10] and LayoutNet [22]. They predict a room type according to LSUN classification (fig. 1 in [19] and fig. 2 in [10]). RoomNet output tensor has 48 layers. The method does not require any complex post-processing, but the official code is not available, making the test impossible.
LayoutNet has only 8 layers which is a maximum number of points in a layout. The same layer may be associated in LayoutNet with key points for different room types, allowing to reduce the total number of output layers from 48 to 8. Zou[22] was the first estimated edge heat maps separately for the floor, wall and ceiling.
Although the details of post-processing are not described in [22] they may be found in the official GitHub repository [21]. The post-processing of LayoutNet does not need multiple layout generation or vanishing lines detection that was a serious progress. The complexity of key points post-processing is due an ambiguity between the right (left) and the middle wall.
3
Heat map estimation via double refinement net
3.1
Network architecture
A standard way of image key point representation is a heat map. Heat map has usually the same resolution as the original image, and the number of layers depends on the neural network structure. Ground truth points are to be projected on the map as a blur usually distributed under a Gaussian distribution.
We choose Double refinement network [7] for the heat map estimation. The network has proven to be efficient in depth estimation for RGB monocular image. The experiments [18] showed that employing depth reduces the layout error by 6% and the clutter estimation by 13% for NYUv2 data set. The architecture of the double refinement network adapted for our task is shown in Fig.2.
We follow the same layout order for key points and edges while training as it was done in LayoutNet [22]. The Double refinement network architecture enables key points and edges heat map generation in one tensor. As our method does not use room type detection, we have only one output branch instead of three in LayoutNet.
The task of layout reconstruction from a heat map is ill-posed in Hadamard sense due to the fact that the layout does not depend continuously on a heat map and the solution is not unique. For this reason, cross-entropy and Euclidean distance are used as loss-functions. It is important to emphasize that the connection between loss function and basic metrics is complex and low loss on a validation set does not necessarily mean good metrics.
The net was trained with the following loss:
Figure 2: Double refinement network [7] for the room layout estimation
whereλ=0.3,
Lpoints=CEw(p,pGT) (2)
wherepGTis the ground truth heat map,pis the predicted heat map
Ledges=CE(e,eGT) (3)
CE- cross entropy function,CEw- weighted cross-entropy with weight w=1.5,
pis a key points heat map estimated,p=output_tensor[:8,:,:], eis an edges heat map estimated,e=output_tensor[8:,:,:],
output_tensor= 11*224*224 - a result from double refinement net, pGT - key points ground truth heat map,eGT - edges ground truth heat map.
3.2
Implementation details
The network was implemented in PyTorch. The training was performed with Adams using the following parameters: learning rate= 1e-4, amsgrad= True, weight decay= 0.0001, batch size= 16. A bigger batch size leads to the over-fitting.
The network was trained and validated on the LSUN dataset for the room layout esti-mation. The dataset contains 4000 prospective images of different rooms such as bedroom, hotel room, dining room, living room, office, conference room and classroom. There are 394 images for validation. The labeled data set contains a room type and coordinates of corners. We did not use Hedau dataset for training. Input images were rescaled to 224*224 pixels image size as they have different resolution. The best state-of-the-art results [19] were achieved using the same resolution.
We used ResNet50 backbone pretrained on the ImageNet. Freezing and sequential un-freezing the ResNet layers does not improve validation loss and metrics. The presented results were achieved at the 6th epoch.
To enhance the layout reconstruction we apply the network for both original and flipped images and then combine results.
4
Post-processing
The post-processing of the heat maps produced by the neural net consists of two steps: 1. Key points coordinate extraction from a heat map.
2. Layouts generation and ranking.
The first step transforms key point maps into 2D coordinates of the key points centers. The second step seeks for an optimal layout built on the points generated at the first step. The layout score measures the level of layout matching with edges heat map.
4.1
Key points coordinate estimation
We use centroid method to estimate key points centers. The same method is used when es-timating star projection center for the satellite attitude estimation [9]. If corners heat maps estimation had a Gaussian distribution equal to their ground truth, then the maximum likeli-hood method [9] would be more efficient. However, in our case output corner heat maps are far from being Gaussian (e.g. key points in Fig.1), so the centroid method is a better choice. The centroid algorithm is to be applied for all layers 1,...,8 ofkeyPointsHeatmap. We ignore all heat map pixel having value lower thanh.SimpleBlobDetection func-tion from cv2 package were applied for the initial heat map posifunc-tion estimafunc-tion. The precise coordinates were estimated by the power centroid equation:
x=∑ki·w γ ik
∑kw
γ ik
(4)
y=∑kj·w γ k j
∑kw
γ k j
(5)
wherewi j- a corner heat map value of pixeli,jfor a particular layer,γ=3.0 is pow parameter.
If the distance between two points is less thanmergeDistance, the points are to be merged and the coordinate of the result point is an average of two initial points.
Coordinates of heat maps lying near an image boundary should be treated specially, as one of their coordinates have to be equal zero to build a valid layout. At the same time, the centroid algorithm as well as other algorithms returns non-zero coordinates. One or both coordinates of a heat map are to be assigned to zero if the heat map is close enough to the image boundary.
4.2
Layout ranking
Like most recent room layout estimation methods [5,14,15,19] we use layout ranking in post-processing. The layout ranking phase generates valid layouts which could be built on the points, ranks them according to a score function, and selects the best layout. Fig. 3
Figure 3: Different layouts and their score.
Our approach differs significantly from the methods based on segmentation map [15,19] which use vanishing point model, step-wise optimization of the layout and mean of all pixel coincided with a layout as a score function.
A mean function as a score has a drawback of a poor optimization for cluttered rooms and rooms with nonstandard geometry that leads to inaccurate layout estimation.
An alternative to the mean value is a sum of all pixel coincided with a layout. The sum score function tends to select the most complex layouts. On the contrary, the mean function tends to select the most simple ones. To overcome the disadvantages of both score functions we suggest a special score function with two adjustable parametersc1,c2∈[0,1].
The input for the layout ranking process is the extracted key points and edges heat map generated by the neural network. Edges heat map has three layersef,ew,ec(a heat map of the floor, wall and ceiling edges respectively). Let us consider thate fi,ewi,eciare the pixel
values of the corresponding edges heat map layers lying on the line between two points. We use the following measure to estimate whether there is an edge between two points:
p=max(p f,pw,pc) (6)
p f=∑iefi
n fc1, pw= ∑iewi
nwc1 , pc= ∑ieci
ncc1 , (7)
wheren f,nw,ncare number of pixels lying on the line between two points for each layer. Consider we have a layout consisting ofmlines with a measurepj. The scoresof the
layout is:
s=∑jpj
mc2 (8)
c2coefficient regulates preference of the complex or simple layout andc1regulates if smaller or bigger layout is preferable.
A formal description of the optimal layout selection algorithm1is presented hereinafter.
Input:
points- 2D points from the 1st step of post-processing edges- 3-layers heatmap tensor of edges 224*224
Output:
bestLayout= (bestLayout.points,bestLayout.roomType) bestLayout.points- 2D points sorted in a specific order bestLayout.roomType- layout type in [0,...,10]
Layoutis a function which returns a corresponding room type for the set of points if it is possible to build a valid prospective layout of the points andNoneotherwise. It consists of numerous empirical rules determining whether the set of points corresponds to a certain room type. Most of the rules are simple comparison operations <,> or scalar product. That is why this approach is easier than vanishing points and lines estimation.
Algorithm 1Optimal layout algorithm bestLayout =None
maxScore = 0
forkin[2,4,6,7,8]do
forcombinationincombinations(points, k)do
layout = Layout(combination)
iflayout.roomtypeis notNonethen
s = score(layout.points, layout.roomType, edges)
ifs > maxScorethen
maxScore = s bestLayout = layout
end if end if end for end for
Edge semantic post-processing algorithm [19] requires to analyze more than 4000 lay-outs (ray sampling + predefined pool) and estimates a score for all of them, whereas our algorithm estimates a score only for a small fraction of valid points combinations. Further-more, edge semantic has a fine optimization step for the best 4 layouts, while our algorithm do not require any additional optimization.
5
Results
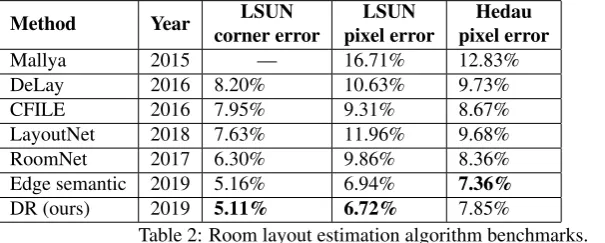
Method Year LSUN corner error
LSUN pixel error
Hedau pixel error
Mallya 2015 — 16.71% 12.83%
DeLay 2016 8.20% 10.63% 9.73%
CFILE 2016 7.95% 9.31% 8.67%
LayoutNet 2018 7.63% 11.96% 9.68%
RoomNet 2017 6.30% 9.86% 8.36%
Edge semantic 2019 5.16% 6.94% 7.36%
DR (ours) 2019 5.11% 6.72% 7.85%
Table 2: Room layout estimation algorithm benchmarks.
Lower is better. For LSUN - numbers in italic are for the benchmarks on the test data set, normal font is for the benchmarks on the validation data set.
The standard metrics for the room layout estimation are pixel and corner errors. Corner error is an average Euclidean distance between ground truth and predicted key points divided by the image diagonal. Pixel error is a pixel-wise error between the predicted surface labels and ground truth labels, i.e. the percentage of pixels that are labeled different from the ground truth. LSUN room layout toolkit provided by the authors of the LSUN layout competition addresses the labeling ambiguity problem by treating it as a bipartite matching problem solved using the Hungarian algorithm that maximizes the consistency of the estimated labels with the ground truth.
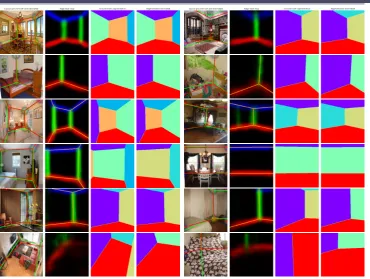
Figure 4: An example of room layouts estimated by our algorithm for the LSUN dataset. Green lines are for the ground truth layout, red lines are for the estimated layout.
on the standard benchmarks. The benchmarks for the earlier algorithms may be found e.g. in [19]. We tested our results on LSUN and Hedau datasets. We used 394 validation images on LSUN dataset and 105 test images on Hedau dataset. The pixel error for the whole Hedau dataset (train+val+test=304 images) is 8.22%. Table2demonstrates that our layout estimation method achieved state-of-the-art results.
Fig.4shows an example of room layouts reconstructed by our method. The last image in the second column is one of the most difficult cases in validation subset of LSUN dataset. Interestingly our approach and edge semantic method provide similar results (fig. 11c in [19]), though we use different network architectures and our output maps also differ.
6
Conclusions
We developed an efficient room layout estimation method based on a neural network with ResNet50 backbone and layout ranking post-processing. The outputs of the network are key points and edges heat maps. Our method is the second using this combination of outputs and the first using edges for the layout ranking in conjunction with key points.
Our method is also the first embedded ResNet50 backbone instead of VGG16 which is the common backbone in the encoder-decoder structure implemented in the other room layout estimation methods. ResNet50 is four times faster than VGG16 and has significantly less (25 million vs 138 million) parameters.
We also introduced a flexible score function for a layout ranking procedure allowing to choose what kind of layout is preferable.
7
Acknowledgement
We would like to thank our colleagues from Samsung AI Center Moscow for their support at different stages of the project. We are also expressing our gratitude to Chuchang Zou from the University of Illinois at Urbana-Champain for close and productive cooperation while reproducing LayoutNet.
References
[1] Olga Barinova, Vadim Konushin, Anton Yakubenko, Keechang Lee, Hwasup Lim, and Anton Konushin. Fast automatic single-view 3-d reconstruction of urban scenes. In European Conference on Computer Vision, pages 100–113. Springer, 2008.
[2] Simone Bianco, Remi Cadene, Luigi Celona, and Paolo Napoletano. Benchmark anal-ysis of representative deep neural network architectures.IEEE Access, 6:64270–64277, 2018.
[3] Federico Boniardi, Abhinav Valada, Rohit Mohan, Tim Caselitz, and Wolfram Burgard. Robot localization in floor plans using a room layout edge extraction network. arXiv preprint arXiv:1903.01804, 2019.
[4] James M Coughlan and Alan L Yuille. The manhattan world assumption: Regularities in scene statistics which enable bayesian inference. InAdvances in Neural Information Processing Systems, pages 845–851, 2001.
[5] Saumitro Dasgupta, Kuan Fang, Kevin Chen, and Silvio Savarese. Delay: Robust spatial layout estimation for cluttered indoor scenes. InProceedings of the IEEE con-ference on computer vision and pattern recognition, pages 616–624, 2016.
[6] Luca Del Pero, Joshua Bowdish, Daniel Fried, Bonnie Kermgard, Emily Hartley, and Kobus Barnard. Bayesian geometric modeling of indoor scenes. In2012 IEEE Confer-ence on Computer Vision and Pattern Recognition, pages 2719–2726. IEEE, 2012.
[7] Nikita Durasov, Mikhail Romanov, Valeriya Bubnova, and Anton Konushin. Double refinement network for efficient indoor monocular depth estimation. arXiv preprint arXiv:1811.08466, 2018.
[8] Varsha Hedau, Derek Hoiem, and David Forsyth. Recovering the spatial layout of cluttered rooms. In2009 IEEE 12th international conference on computer vision, pages 1849–1856. IEEE, 2009.
[9] Ivan Kruzhilov. Minimization of point light source coordinates determination error on photo detectors. Journal of Optical Communications, 32(4):201–204, 2011.
[11] Ruihao Li, Qiang Liu, Jianjun Gui, Dongbing Gu, and Huosheng Hu. Indoor relocal-ization in challenging environments with dual-stream convolutional neural networks. IEEE Transactions on Automation Science and Engineering, 15(2):651–662, 2018.
[12] Guosheng Lin, Anton Milan, Chunhua Shen, and Ian D. Reid. Refinenet: Multi-path re-finement networks for high-resolution semantic segmentation. 2017 IEEE Conference on Computer Vision and Pattern Recognition (CVPR), pages 5168–5177, 2017.
[13] Zhaoyang Lv, Kihwan Kim, Alejandro Troccoli, Deqing Sun, James M Rehg, and Jan Kautz. Learning rigidity in dynamic scenes with a moving camera for 3d motion field estimation. InProceedings of the European Conference on Computer Vision (ECCV), pages 468–484, 2018.
[14] Arun Mallya and Svetlana Lazebnik. Learning informative edge maps for indoor scene layout prediction. InProceedings of the IEEE international conference on computer vision, pages 936–944, 2015.
[15] Yuzhuo Ren, Shangwen Li, Chen Chen, and C-C Jay Kuo. A coarse-to-fine indoor layout estimation (cfile) method. InAsian Conference on Computer Vision, pages 36– 51. Springer, 2016.
[16] Olaf Ronneberger, Philipp Fischer, and Thomas Brox. U-net: Convolutional networks for biomedical image segmentation. InMICCAI, 2015.
[17] Huayan Wang, Stephen Gould, and Daphne Roller. Discriminative learning with latent variables for cluttered indoor scene understanding. Communications of the ACM, 56 (4):92–99, 2013.
[18] Jian Zhang, Chen Kan, Alexander G Schwing, and Raquel Urtasun. Estimating the 3d layout of indoor scenes and its clutter from depth sensors. InProceedings of the IEEE International Conference on Computer Vision, pages 1273–1280, 2013.
[19] W. Zhang, W. Zhang, and J. Gu. Edge-semantic learning strategy for layout estimation in indoor environment. IEEE Transactions on Cybernetics, pages 1–10, 2019. ISSN 2168-2267. doi: 10.1109/TCYB.2019.2895837.
[20] Huizhong Zhou, Benjamin Ummenhofer, and Thomas Brox. Deeptam: Deep tracking and mapping. InProceedings of the European Conference on Computer Vision (ECCV), pages 822–838, 2018.
[21] Chuhang Zou. Torch implementation for cvpr 18 paper: "layoutnet: Reconstructing the 3d room layout from a single rgb image", 2018. URLhttps://github.com/ zouchuhang/LayoutNet.
![Figure 2: Double refinement network [7] for the room layout estimation](https://thumb-us.123doks.com/thumbv2/123dok_us/8014087.1332487/5.408.41.353.39.254/figure-double-renement-network-room-layout-estimation.webp)