5701
A ROBUST DUAL SOURCE LEVEL SET METHOD FOR
THREE-DIMENSIONAL ECHOCARDIOGRAPHY IMAGE
SEGMENTATION
1NIMA SAHBA, 2*EMAD FATEMIZADEH, 3HAMID BEHNAM
1Department of biomedical engineering, Science and Research Branch, Islamic Azad University, Tehran,
Iran
2Department of electrical engineering, Sharif University of technology, Tehran, Iran
3Iran University of Science and Technology, Biomedical Engineering Department, School of Electrical
Engineering, Tehran, Iran
E-mail: 1[email protected], 2*[email protected], 3[email protected]
ABSTRACT
Echocardiography as a common place device has been widely used for diagnosis. Segmentation of left ventricle just using the standard level set formulation based on the magnitude of intensity cannot restrict the contour evolution completely due to the lack of sharp edges.
This paper aims to introduce a robust method for segmentation of three-dimensional echocardiography images based on two boundary maps namely distance map and probabilistic map as stopping criteria of contour evolution which are extracted using two different approaches. The distance map is extracted by applying Free Form Deformation (FFD) method on manually determined landmarks of initial spherical volume to register the landmarks to boundary of left ventricle using B-Spline interpolation. The probabilistic map is independently created as a contour guideline to achieve probable desirable regions. Segmentation of echocardiography volumes is implemented using a proposed energy function based on level set formulation combined by two edge maps which is named dual source level set.
Left ventricle segmentation using proposed method illustrates expert-approved performance, providing a reliable tool for clinical practice due to less than 2% ejection fraction error compared to manual tracing by expert. Making use of combined distance and probabilistic map as stopping criterion in level set approach helps to avoid the local minima and excessive contour expansion, while the left ventricle valve is open or there is not clear edge.
Keywords:Level set, Segmentation, three-dimensional echocardiography, Dual Source.
1. INTRODUCTION
Echocardiography is a commonplace device for imaging, since it is noninvasive, safe and portable while is real time and low cost compared with Computed Tomography (CT) and Magnetic Resonance Imaging (MRI). Therefore, it is a potential choice to be widely used by radiologists. However, in comparison with other medical imaging modalities, the image quality of echocardiography is relatively low that makes a challenging area for segmentation and distinguishing the organs. The quality weakness of ultrasonic images returns to the physic of characteristic artifacts such as attenuation, speckle, shadow and signal dropout [1]. Hence, a computer aided software as the complimentary tool can be useful for decreasing fault diagnosis. There are several general tendencies for echocardiography
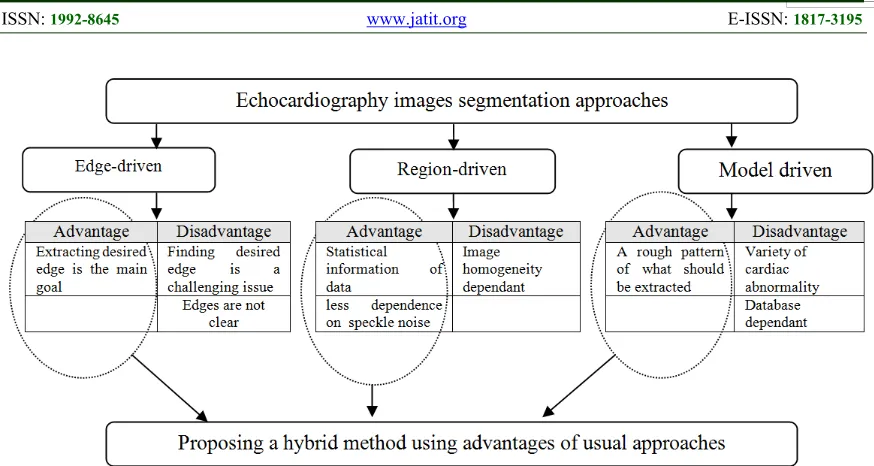
image segmentation that can be categorized into edge-driven, region-driven and model-driven methods [2].
5702 image driven forces to the boundaries of the desired object. Active contours are very efficient at segmenting high resolution images but it is a challenging issue due to the noise existence, especially in three-dimensional echocardiography. Hence, making use of image enhancement preprocessing methods such as noise reduction filters and transform functions or a complimentary procedure is usually necessary in implementing active contours on three-dimensional echocardiography images [7], [8], [9]. Generating closed parametric or implicit curves or surfaces without any necessity for training the model, makes active contours practical [10].
Creating a statistical model based on the intensities of homogenous areas in the echocardiography images including blood cavities and myocardium tissues, is the foundation of region-driven approach [11], [12]. To this end, prior statistical models are usually required which can be derived from: a) Markov Random fields [13]: Segmentation based on Markov random fields is a statistical method supposing a probability distribution for gray level of each pixel as a random variable, b) fuzzy logic [14], [15]: is a powerful method to obtain appropriate threshold for image segmentation, c)Rayleigh distribution decomposition [16] and d) artificial neural networks [17]: is widely used for medical image segmentation. The neural networks are trained by samples set and therefore the results are training samples dependant. Overall, inhomogeneity and low contrast nature of three-dimensional echocardiography images must be considered that is against to initial assumption (homogenous areas) and consequently each approach needs its considerations.
In the model-driven approaches, a statistical model of shape and/or appearance and/or motion from a training set is constructed which is challenging issue due to the complex nature of the heart. The prior-model driven approaches can be classified based on the use of shape prior to: a) Active Shape Model (ASM): is based on constructing a whole shape model using manually segmented image followed by applying Principle Component Analysis (PCA) [18], [19], b) Active Appearance model: is closely related to ASM but using both Shape and gray levels information instead of just shape information [20], [21], c) Motion model: can simulate the spatial and temporal changes of the heart displacement based on motion pattern of cardiac cycle [22], [23].
Both fully-automatic and semi-automatic (with user interference) echocardiography image segmentation have been introduced for the past two decades [24], [25]. It is surely preferred to utilize a fully automatic version of heart segmentation methods. But, according to the complexity of heart motion, it is rationally acceptable to use a semi-automatic approach with more precise and stable results.
Totally, there is not any deterministic approach of three-dimensional echocardiography image segmentation because of the imaging nature. From one side, in edge-driven approaches, it is not determined whether a clear and meaningful edge is extracted or not. From other side, in region-driven approaches, image homogeneity plays a fundamental role while is weak in echocardiography images. Also, prior-model driven approaches are encountered to the problems due to the variety of cardiac abnormality and complex motion pattern. Hence, having a hybrid probabilistic view instead of deterministic view can be useful to cope with these kinds of challenges (Figure 1).
In this paper, we are aiming to propose a new level set method namely dual source level set for echocardiography image segmentation. Both probabilistic map and distance map are created as the contour evolution guideline sources.
This paper is organized as follows: at first, two capable maps are introduced in sections A and B for contour movement controlling. Then, in section C, the energy function of level set based active contour is defined according to the extracted maps. Experiments and comparisons are included in section 3 using numerical analysis.
2. METHODOLOGY
Due to the poor quality of three dimensional images and complicated motion manner of heart especially in some cardiac diseases, making use of semi-automatic echocardiography image segmentation method not only is lead to avoid time consuming and tedious manually segmentation but also more accurate and reliable results can be achieved in comparison with fully-automatic approaches.
5703 contour evolution. Each of these steps is explained in detail in the following sections.
Figure 2: Block diagram of proposed method
In figure 2, the parameters are defined as following:
Initial volume: a sphere volume which is created as a starting point.
Registered: implies to the registered image which is extracted by applying registration on initial volume.
Distance map: is a rough pattern which is used for contour movement restriction.
Probabilistic map: is a guideline of contour movement for fine segmentation of left ventricle probabilistically.
2.1 Distance map extraction
At first, seven sparse points but in important positions are manually determined at: a) Apex, b) Mid inferoseptum long axis, c) Mid anterolateral long axis, d) Mitral valve long axis, e) Inferolateral short axis, f) Anteroseptal short axis g) Center of left ventricle cavity (Figure 3).
Having these seven points in comparison with complete manually segmentation of left ventricle, are ignorable but are necessary for increasing the accuracy and stability of proposed method.
[image:3.612.103.296.155.335.2]a) b)
Figure 3: Mid cavity, a) long axis , b) short axis [26]
Registered volume is extracted using registration of corresponding seven points of a default sphere to determined control points based on B-spline Free Form Deformation method (FFD) [27]. B-spline FFD is computed by linear combination of splines basis function based on non-linear transformation. Implementation of FFD begins by placing a uniform grid of the control points over the image. Let , , denote such a control point grid of size n n n with grid spacing of δ t δ t δ t . Then the non-linear transformation for each image point (x, y, z) is computed as a three-dimensional tensor product of one-three-dimensional cubic B-spline as follows:
T x, y, z
∑ ∑ ∑ B u B v B w φ , ,
(1)
Where i x/δ t , j y/δ t , k
z/δ t , u=x/δ t i, v=y/δ t j,
w= / and u, v, w are relative positions
of (x,y,z) in the three dimensions. Also, through are cubic B-splines.
B r 1 r /6 (2)
B r 3r 6r 4 /6
B r 3r 3r 3r 1
B r r /6
Where r is either u, v, or w.
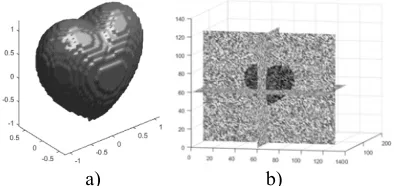
Euclidean distance of each pixel to registered volume is calculated which is lead to distance map D(x,y,z). Figure 4 shows a sample of distance map extraction.
a) b)
[image:3.612.347.497.627.709.2]5704
2.2 Probabilistic map extraction
As mentioned before, several items restrict echocardiography segmentation such as speckle noise, area inhomogeneity, lack of clear edge and so on. A probabilistic approach is proposed to overcome on limitations as much as possible.
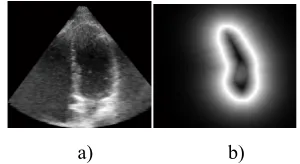
P x, y, z is a probabilistic edge map indicator which is created as an contour guideline to achieve probable desirable region and is defined by average of the following statements for each pixel of I(x,y,z) as input echocardiography image:
1- Edge gradient based probability:
, , | σ|
| σ| (3)
[image:4.612.322.525.81.429.2]Where denotes to power-law transformation which must be 1 to increases the contrast. The parameter is set to 5 (Figure 5).
Figure 5: Edge probability
2- Distance to Average of Gray-levels of Manually Sampled Pixels (AGMSP): the average of seven manually determined points is utilized as an intensity criterion. More distance to this mentioned average is corresponding to less probability of being desired pixels (Figure 6).
p x, y, z (4)
Figure 6: AGMSP probability
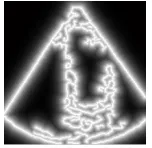
3- Distance to convex hull of most probable area: The most probable area is easily achieved by applying a threshold on averages of edge gradient based probability and AGMSP which is not sensitive parameter (threshold can be set between 0.6 to 0.8). It can be lead to excessive contour expansion where there is not clear edge. Therefore, in echocardiography, this probability is useful
where the heart valve is open. The threshold is set to 0.7 (Figure 7).
p x, y, z (5)
a) b)
Figure 7: a) applying threshold on average of on averages of edge and AGMSP probability maps, b)
Convex hull of probable area
Finally, (x,y,z) is achieved by (Figure 8) :
P x, y, z , , , , , , (6)
Figure 8: Probabilistic map
P x, y, z as an effective coarse to fine criterion is utilized to create more precise stopping function than distance map , , .
2.3 Level set
In the level set method a contour of interest is embedded as the zero level set of a Level Set Function (LSF). Let ∶ Ω→ R , , be a LSF defined on a domain Ω . The energy function is defined by:
E ϕ x, y, z ≜ R ϕ x, y, z E ϕ x, y, z (7)
Where is the level set regularization term which is defined by:
R ϕ x, y, z ≜ | ϕ x, y, z | 1 (8)
[image:4.612.163.239.333.407.2]5705 smooth the LSF but also to maintain the signed distance property| , , | 1.
is the external energy that is calculated based on distance map and probabilistic map providing dual guideline source of contour evolution. The external energy must be minimized when the zero level set of LSF is located at the desired position. Therefore, is defined as following:
E ϕ x, y, z ≜
S δ ϕ x, y, z | ϕ x, y, z |
H ϕ x, y, z (9) Negative value of the coefficient is lead to expand the initial contour. (.) and H(.) are the Dirac and Heaviside functions respectively which are estimated by [4]:
δ x 1 cos , |x| K
0, |x| K (10)
And,
H x 1, x1 sin , |x| K K 0, x K
(11)
The parameter is usually set to 1.5. We define S as dual source stopping function:
S x, y, z 1 P x, y, z D x, y, z ε (12)
Where , , and , , are
probabilistic map and distance map respectively. is a small positive value for imposing a small movement of contour to check whether contour has been located in a local minima or not. Making use of this stopping function, not only is a reason for achieving the most probable desired edge (especially when there is not clear edge) but also can be lead to avoid local minima as much as possible.
The proposed consists of two terms: a) the first term ( Ω | | ) computes the line integral of the function , , along the zero level set of LSF that is located at the ventricle boundaries when is minimized, b) The second term
( Ω H ) computes a weighted area of
the region Ω ≜ , , 0 .
Hence, by applying (8) and (9) in (7) the energy function will be as following:
E ϕ x, y, z ≜ 1 | ϕ x, y, z |
S x, y, z δ ϕ x, y, z | ϕ x, y, z |
H ϕ x, y, z (13) This mentioned energy function can be minimized using Gateaux derivative based on finding the steady state solution of the following gradient flow equation:
(14)
This is an evolution equation of , with a spatial variable (x,y,z) in the domain Ω and a temporal variable 0 while the evolution starts with a given initial function , .
According to the Euler-Lagrange statement, for a functional of the form:
, , , (15)
The first variation of energy is achieved by:
(16)
Therefore, the function E , , can be minimized as following:
| | | |
(17) Where and div() imply to the Laplacian and divergence operators respectively.
2.4 Data set
Both objective and subjective expert based evaluations were utilized to assess the proposed method precisely. To this end, a ground truth image was used which obtained by a synthetic image including two gray levels. Afterwards, multiplicative noise is added synthetically to the image I, using the equation J = I+n I, where n is uniformly distributed random noise with mean 0 and variance 0.4 (Figure 9).
a) b)
[image:5.612.326.523.607.700.2]5706 As mentioned in previous sections, three probabilistic parameters have been created ( , and to guide the direction of contour movement. To evaluate the effect of each probabilistic parameter while the heart valve is opened, an open synthetic surface is created (Figure 10).
Figure 10: open synthetic surface
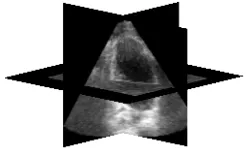
[image:6.612.146.253.183.253.2]In order to assess the capability of proposed approach in real data set, three dimensional echocardiography images of eleven healthy volunteer including 156 volumes are acquired by IE33 Philips device (Figure 11).
Figure 11: Three-dimensional echocardiography image
3. RESULTS
Both created open synthetic surface and close synthetic volume are segmented by proposed method due to speckle noise value variation and substitution of different probabilistic parameters ( , , and ) in stopping function , , . Subsequently, the precision of each segmented volume are extracted based on following equation (Figure 12, Figure 13):
100 (18)
[image:6.612.138.261.337.411.2]True Positive (TP): pixels correctly detected as ventricle, False Positive (FP): pixels incorrectly detected as ventricle.
Figure 12: Precision of segmentation in close valve echocardiography images
Figure 13: Precision of segmentation in open valve echocardiography images
For more evaluations of proposed method in segmentation of synthetic images, an index is defined as following which implies to the percentage of pixels that are correctly detected as desired edge (Table 1):
, (19)
Where represents the number of edge points of the ground truth and the number of edge points detected. (True Positive) is defined as the number of correctly detected edge pixels.
Table 1. Quantitative evaluation of proposed method in synthetic images segmentation.
Shape Noise Variance
close synthetic volume 0 0.961
close synthetic volume 0.25 0.872
close synthetic volume 0.5 0.741
close synthetic volume 0.75 0.511
open synthetic surface 0 0.733
open synthetic surface 0.25 0.687
open synthetic surface 0.5 0.604
open synthetic surface 0.75 0.436
[image:6.612.313.523.535.702.2]5707 result of left ventricle segmentation in comparison with manually segmentation by an expert. Figure 14 and Table 2 depict the results qualitatively and quantitatively based on Ejection Fraction (EF) measurement using following formula:
EF 100 (20)
EF=Ejection Fraction EDV=End Diastolic Volume ESV=End Systolic Volume SV=Stroke Volume=EDV-ESV
a) b)
[image:7.612.290.529.116.233.2]
c) d)
Figure 14: Left ventricular echocardiography image segmentation, a) an echocardiography image, b) Expert based left ventricle segmentation, c) coarse segmentation
based on distance map, d) fine segmentation based on both distance map and probabilistic map (proposed
stopping function)
Table 2: Ejection Fraction calculating.
Expert based Proposed
56.4 11.2% 57.2 12.4%
Ejection Fraction
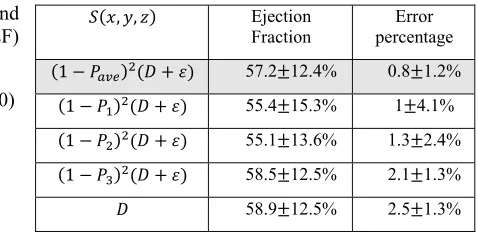
Finally, for more evaluation of defined stopping function in three-dimensional echocardiography images, ejection fractions were calculated by changing the stopping function according to the Table 3.
Table 3: Corresponding calculated ejection fractions of different stopping functions.
, , Ejection Fraction
Error percentage
1 57.2 12.4% 0.8 1.2%
1 55.4 15.3% 1 4.1%
1 55.1 13.6% 1.3 2.4% 1 58.5 12.5% 2.1 1.3% 58.9 12.5% 2.5 1.3%
4.DISCUSSION
There is an unavoidably compromise between the value of speckle noise and the precision of left ventricle segmentation in three dimensional echocardiography images. In this paper, left ventricle segmentation has been categorized to three approaches by highlighting prominent features of each method. Of course, each one of the categorized approach has its advantages that can be optimized for left ventricle segmentation in echocardiography images which is highly dependent on using parameters. Subsequently, discrimination of performance of each segmentation method is controversial in detail level. Therefore, in this paper, we have proposed a hybrid method by concentrating on prominent features of each segmentation approach in overall. To this end, two complement criteria ( , , and , , ) were utilized in stopping function to decrease the dependence of left ventricle segmentation precision to the level of speckle noise. Model- driven approach was inspirational for , , definition by using a rough pattern as the contour movement limitation. Proposing of , , was inspired by edge-driven and region –driven approaches that both pixel based and regional information was utilized.
The effect evaluation of each probabilistic parameter in the left ventricle segmentation demonstrated that:
P1: is very effective for increasing the precision when the valve is closed.
P2: is effective for increasing the precision when the valve is closed or the variance of noise is increased.
[image:7.612.100.299.227.429.2]5708 Since, we considered both probability of being desired pixel (left ventricle edge) and expert based desired area estimation using few samples, our proposed approach demonstrates reliable results in comparison with expert based manually segmentation, as evidenced by less than 2% ejection fraction error.
Finally, making use of both probabilistic map and distance map not only leads to restriction of excessive contour evolution in open ventricle valve but also more precise results are achieved by avoiding local minima as much as possible.
REFERENCES:
[1] J.A. Noble, and D. Boukerroui, “Ultrasound image segmentation: a survey” IEEE
Transaction on medical imaging, Vol. 25, No.
8, 2006, pp. 987-1009.
[2] K. Rajpoot, J.A. Noble, V. Grau, C. Szmigielski, and H. Becher, “Image-driven cardiac left ventricle segmentation for the evaluation of multiview fused real-time dimensional echocardiography Images”, Medical Image Computing and Computer Assisted Intervention
(UK), September 20-24, 2009, pp. 893–900. [3] V. Zagrodsky, V. Walimbe, C. Castro-Pareja,
J.X. Qin, J.M. Song, and R. Shekhar, “Registration-assisted segmentation of real-time 3-D echocardiographic data using deformable models”, IEEE Transactions on Medical
Imaging, Vol. 24, No. 9, 2005, pp. 1089–1099.
[4] C. Li, C. Xu, C. Gui, and M.D. Fox, “Distance regularized level set evolution and its application to image segmentation”, IEEE
Transactions on Image Processing, Vol. 19, No.
12, 2010, pp. 3243-3254.
[5] M. Kass, A. Witkin, and D. Terzopoulos, “Snakes: active contour model”, International
Journal of Computer Vision, Vol. 1, No. 4,
1987, pp. 321–331.
[6] S. Osher, and J. Sethian, “Fronts propagating with curvature-dependent speed: Algorithms based on Hamilton-Jacobi formulations”,
Journal of Computational Physics, Vol. 79, No.
1, 1988, pp. 12–49.
[7] X. Qin, Z. Cong, and B. Fei, “Automatic segmentation of right ventricular ultrasound images using sparse matrix transform and a level set”, Physics in Medicine and Biology,
Vol. 58, No. 21, 2013, pp.7609–7624.
[8] A. Skalski, P. Turcza, T. Zieliński, and J., Grodzicki, “Left ventricle USG image segmentation using active contour model”,
Procedia computer science, Vol. 1, No. 1, 2010,
pp. 2723–2732.
[9] C. Santiago, J.C. Nascimento, and J.S. Marques, “Automatic 3-D segmentation of endocardial border of the left ventricle from ultrasound images”, IEEE journal of biomedical and health
informatics, Vol. 19, No. 1, 2015, pp. 339-348.
[10] V. Tavakoli, and A.A. Amini, “A survey of shaped-based registration and segmentation techniques for cardiac images”, Computer
Vision and Image Understanding, Vol. 117, No.
9, 2013, pp. 966–989.
[11] Y. Zhu, X. Papademetris, A.J. Sinusas, J.S. Duncan, “Segmentation of myocardial volumes from real-time 3D echocardiography using an incompressibility constraint”, Medical Image Computing and Computer-Assisted Intervention
(Australia), October 29, 2007, pp. 44–51. [12] E.D. Angelini, S. Homma, G. Pearson, A.F.
Laine, and J.W. Holmes, “Segmentation of real-time three –dimensional ultrasound for quantification of ventricular function: a clinical study on right and left ventricles”, Ultrasound
in Medicine and Biology, Vol. 31, No. 9, 2005,
pp. 1143-1158.
[13] S. Nirmala, and S.Sridevi, “Markov Random Field Segmentation Based Sonographic Identification of Prenatal Ventricular Septal Defect”, Procedia Computer Science, Vol. 79,
2016, pp. 344-350.
[14] S.K. Setarehdan, and J.J. Soraghan, “Fuzzy multiscale edge detection (FMED) applied to automatic left ventricle boundary extraction”,
7th International Conference on Image
Processing and its Applications (UK), July
13-15, 1999, pp. 552-556.
[15] J. Manivannan, M.R. Reddy, S.
Thanikachalam, and R. Varghese,
“Endocardial edge detection by fuzzy inference
system” Conference on Convergent
Technologies for the Asia-Pacific Region
(India), October 15-17, 2003, pp. 3-5.
[16] C.Y. Ahn, Y.M. Jung, O.I. Kwon, and J.K. Seo, “Fast segmentation of ultrasound images using robust Rayleigh distribution decomposition” Pattern Recognition, Vol. 45,
No. 9, 2012, pp. 3490-3500.
[17] G. Carneiro, J. Nascimento, and A. Freitas, “Robust left ventricle segmentation from ultrasound data using deep neural networks and efficient search methods”, IEEE International Symposium on Biomedical Imaging: From
Nano to Macro (Netherlands), April 14-17,
5709 [18] J. Hansegard, F. Orderud, and S.I. Rabben,
“Real-time active shape models for segmentation of 3D cardiac ultrasound”, 12th International Conference on Computer Analysis
of Images and Patterns (Austria), August 27-29,
2007, pp. 157-164.
[19] A. Haak, B. Ren, H.W. Mulder, G.V. Ferrero, G.V., Burken, A.F. Steen, M.V. Stralen, J.P.W. Pluim, T.V. Walsum, and J.G. Bosch, “Improved segmentation of multiple cavities of the Heart in wide-view 3-D transesophageal echocardiograms”, Ultrasound in medicine and
biology, Vol. 41, No. 7, 2015, pp.1991-2000.
[20] L. Vargas-Quintero, B. Escalante-Ramrez, L.C. Marn, M.G. Huerta, F.A. Cosio, and H.B. Olivares, “Left ventricle segmentation in fetal echocardiography using a multi-texture active appearance model based on the steered Hermite transform”, Computer Methods and Programs
in Biomedicine, Vol. 137, 2016, pp. 231-245.
[21] Y. Guo, Y. Wang, S. Nie, and J. Yu, “Automatic segmentation of a fetal echocardiogram using modified active appearance models and sparse representation”
IEEE Transactions on Biomedical Engineering,
vol. 61, No. 4, 2013, pp. 1121- 1133.
[22] K. Punithakumar, I. Ben Ayed, A. Islam, I.G. Ross, and S. Li, “Tracking endocardial motion via multiple model filtering”, IEEE Transaction
on Biomedical Engineering, Vol. 57, No. 8,
2010, pp. 2001-2010.
[23] I. Dydenko, F. Jamal, O. Bernard, J. D'hooge, I.E. Magnin, and D. Friboulet, “A level set framework with a shape and motion prior for segmentation and region tracking in echocardiography”, Medical Image Analysis,
vol. 10, No. 2, 2006, pp. 162-177.
[24] H.S. Wu, D. Wang, L. Shi, and C.M. Yu, “Automatic segmentation of left ventricle in 3D echocardiography using a level set approach.
International Journal of Cardiology, Vol. 164,
No. 2, 2013, pp. 12-13.
[25] S.A.M. Júnior, B. Macchiavello, M.M. Andrade, J.L. Carvalho, H.S. Carvalho, D.F. Vasconcelos, P.A. Berger, A.F.D. Rocha, ans F.A. Nascimento, “Semi-automatic algorithm for construction of the left ventricular area variation curve over a complete cardiac cycle”,
BioMedical Engineering OnLine, Vol. 9, No. 5,
2010, pp. 1-17.
[26] M.S. Nacif, C.D.O. Junior, A.C.P. Carvalho, and C.E. Rochitte, “Cardiac magnetic resonance and its anatomical planes - how do I do it?”, Arq
Bras Cardiol, vol. 95, No. 6, 2010, 756-763.
[27] D. Rueckert, L.I. Sonoda, C. Hayes, D.L.M. Hill, D.J. Hawkes, “Nonrigid registration using free-form deformations: application to breast MR images” IEEE transactions on medical
5710