49 | P a g e
COMPARATIVE ANALYSIS OF BINARIZATION FOR
GRAY-SCALED DIGITAL IMAGES
G.Sandhiya
1, D.Akshaya
2, K.R.Divya Dharshini
3, N.Anuvarshini
4 1,2,3,4Department of Electronics and Communication Engineering,
R.M.K. College of Engineering andTechnology, Chennai, (India.)
ABSTRACT
In this paper we proposed a method for compressive sensing and the recovery of binary images. To achieve this,
we combine two ideas: in the sensing step, ordered aperture patterns are employed instead of random aperture
patterns, and in the recovery step, a dense reconstruction scheme replaces sparse reconstruction. We
demonstrate that this approach is more effective for binary images than state-of-the-art algorithms relying on
random sensing and sparse reconstruction. The features used are mainly phase derived, while in the post
processing step, specialized adaptive Gaussian and median filters are considered and mean shift algorithm is
used. One of the outputs of the binarization step, which shows high recall performance, is used in a proposed
post processing method to improve the performance of other binarization methodologies.
Keywords:Binarization, Filtering Segmentation, Image enhancement, Image processing.
I INTRODUCTION
Document image binarization is usually performed in the preprocessing stage of different document image
processing related applications such as optical character recognition (OCR) and document image retrieval. It
converts a gray-scale document image into a binary document image and accordingly facilitates the ensuing
tasks such as document skew estimation and document layout analysis. As more and more text documents are
scanned, fast and accurate document image binarization is becoming increasingly important. Though document
image binarization has been studied for many years, the thresholding of degraded document images is still an
unsolved problem. This can be explained by the fact that the modeling of the document foreground/background
is very difficult due to various types of document degradation such as uneven illumination, image contrast
variation, bleeding-through, and smear. We try to develop robust and efficient document image binarization
techniques which are able to produce good results for badly degraded document images. Existing system
follows sparse reconstruction where in a binary image of 0’s and 1’s the more of 0’s are present which gives
noisy image.
50 | P a g e
We can find a sparsifying matrix by which two-dimensional binary vectors can be transformed into sparsevectors. Three-dimensional or higher-dimensional binary vectors, however, are not transformed into sparse
vectors by a simple rotation
(2)
(3)
Although any sparse signal can be recovered by Eq. (3) as long as it satisfies the sparsity condition, not all of the
purely binary vectors are recovered. Thus, we are motivated to search for another approach that is suitable for a
binary representation.
In section II, we discuss some of the literature survey papers relating to compressive sensing-Binarization
Techniques, Text Extraction, Phase-Based Binarization.
In section III, we describe the design of proposed system which includes segmentation, Phase Rotated
Concurrence Component, Density Reconstruction, Mean shift algorithm, Adaptive weighted trimmed median
filter.
II. LITERATURE SURVEY
Improved Document Image Binarization by using a combination of Multiple Binarization Techniques and
Adapted Edge Information by B. Gatos, L. Pratikakis.This paper presents a new adaptive approach for document
image binarization. The proposed method is mainly based on the combination of several state of- the-art
binarization methodologies as well as on the efficient incorporation of the edge information of the gray scale
source image. An enhancement step based on mathematical morphology operations is also involved in order to
produce a high quality result while preserving stroke information. The proposed method demonstrated superior
performance against six (6) well-known techniques on numerous degraded handwritten and machine printed
documents. The performance evaluation is based on visual criteria as well as on an objective evaluation
methodology.
TEXT EXTRACTION FROM DEGRADED DOCUMENT IMAGES BY Rachid Hedjam, Reza Farrahi
Moghaddam.
In this work, a robust segmentation method for text extraction from the historical document images is presented.
The method is based on Markovian-Bayesian clustering on local graphs on both pixel and regional scales. It
consists of three steps. In the first step, an over-segmented map of the input image is created. The resulting map
provides a rich and accurate semi-mosaic fragments. The map is processed in the second step, similar and
adjoining sub-regions are merged together to form accurate text shapes. The output of the second step, which
contains accurate shapes, is processed in the final step in which, using clustering with fixed number of classes,
51 | P a g e
Phase-Based Binarization of Ancient Document Images: Model and Applications BY Hossein Ziaei Nafchi,
Reza Farrahi Moghaddam.In this paper, a phase-based binarization model for ancient document images is
proposed, as well as a post processing method that can improve any binarization method and a ground truth
generation tool. Three feature maps derived from the phase information of an input document image constitute
the core of this binarization model. These features are the maximum moment of phase congruency covariance, a
locally weighted mean phase angle, and a phase preserved denoised image. The proposed model consists of
three standard steps: 1) preprocessing; 2) main binarization; and 3) post processing. In the preprocessing and
main binarization steps, the features used are mainly phase derived, while in the postprocessing step, specialized
adaptive Gaussian and median filters are considered. One of the outputs of the binarization step, which shows
high recall performance, is used in a proposed postprocessing method to improve the performance of other
binarization methodologies.
III. METHODS:
A. Segmentation : (1) Edge segmentation: Image processing is any form of information processing for which the input is an image, such as frames of video; the output is not necessarily an image, but can be a set of
features giving information about the image. Since images contain lots of redundant data, scholars have
discovered that the most important information lies in its edges. They correspond to object boundaries, changes
in surface orientation and texture. Edges typically correspond to points in the image where the gray value
changes significantly from one pixel to the next. Thus, detecting Edges help in extracting useful information
characteristics of the image where there are abrupt changes.
Fig. Edge segmented image
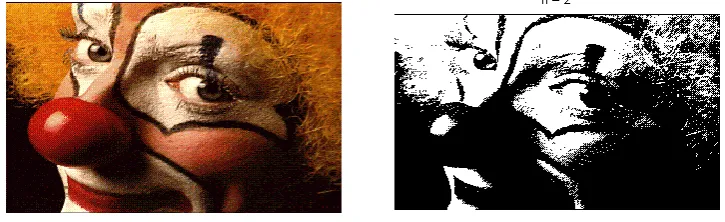
(2) Otsu segmentation: Otsu's method, named after Nobuyuki Otsu is used to automatically perform
clustering-based image thresholding or, the reduction of a gray level image to a binary image. The algorithm
assumes that the image contains two classes of pixels following bi-modal histogram (foreground pixels and
background pixels), it then calculates the optimum threshold separating the two classes so that their combined
spread (intra-class variance) is minimal, or equivalently (because the sum of pair wise squared distances is
constant), so that their inter-class variance is maximal. Consequently, Otsu's method is roughly a
one-dimensional
Description: IDX = otsu (I, N) segments the array I into N classes by means of Otsu's N-thresholding method.
52 | P a g e
non-finite (NaN or Inf) pixels.IDX = otsu(I) uses N = 2 (default value).
[IDX,sep] = otsu(...) also returns the value (sep) of the separability criterion within the range [0 1]. Zero is
obtained only with arrays having less
than N values, whereas one (optimal value) is obtained only
with N-valued data
Fig. Input image and otsu segmented image
B.
Phase Rotated Concurrence Component:
Phase congruency is where the phases of a quadrature filter responses at different scales are similar. A quadrature
filter consists of two parts: An even (symmetrical) part and an odd (anti-symmetrical) part, which are the Hilbert (or
Riesz) transforms of each other. See below: Let u(x)u(x) be an even function with finite energy, and
be its Hilbert transform. The functions are in quadrature. We can combine them as one filter by multiplying the odd
part by ii and adding them together:
Convolving the filter with a signal, f(x)f(x), we thus get a complex response where the even part is the response to
the even filter and the odd part is the response to the odd filter:
Phase is the argument of this complex response
53 | P a g e
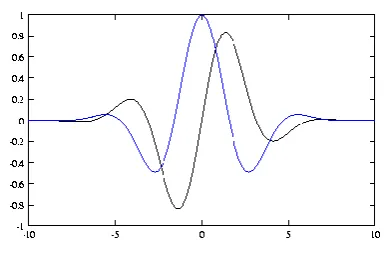
Phase describes the shape of the signal at a point - odd or even or somewhere in-between – while amplitudedescribes the strength.
This independence is important as it means signals with different strengths can be compared. If the phase is the
same at multiple scales, then there is likely to be a signal feature here. This is phase congruency.
Fig. The big result is that phase congruency can find signal features independent of their strength.
A continuum of feature types from step to line can be obtained by varying the phase offset. Sharpness is controlled
by amplitude decay
Fig. Phase congruency models a wide range of feature types
In order to obtain the phase rotated concurrence component –mean value, standard deviation, covariances are taken
into consideration which is being calculated from the image pixel values. For elimination of noise, the following
filters are used:
(1) Log-Gabor filter - The Gabor filter is basically a Gaussian (with variances and
along x and axes respectively) modulated by a complex sinusoid (with centre frequencies U and V along x and
54 | P a g e
(Local frequency information is obtained by applying quadrature pairs of log-Gabor filters over six orientations and3-4 scales (typically).
Fig. Phase Congruency values are calculated for every orientation
(2) Low pass filter – Construct a low-pass Butterworth filter. Usage: f = lowpassfilter (size, cutoff, n) where: size is
a two element vector specifying the size of to construct [rows cols]. Cutoff is the cutoff frequency of the filter 0 -
0.5 n is the order of the filter; the higher n is the sharper the transition is. (n must be an integer >= 1). Note that n is
doubled so that it is always an even integer.
Detecting corner and edges :
55 | P a g e
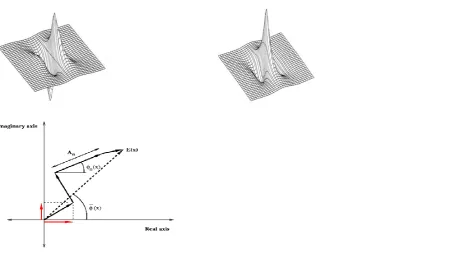
Where PCx and PCy are the x and y components of Phase Congruency for each orientation. The minimumAnd maximum singular values correspond to the minimum moments of Phase Congruency.
Fig. The magnitude of the maximum moment, M, gives an indication of the significance of the feature
From the figure, If the minimum moment, m, is also large we have an indication that the feature has a strong 2D
component and can be classified as a corner. The principal axis, about which the moment is minimized, provides
information about the orientation of the feature.
C. Mean shift algorithm: Mean Shift is a powerful and versatile non parametric iterative algorithm that can be used for lot of purposes like finding modes, clustering etc. Mean Shift was introduced in Fukunaga and Hostetler [1]
and has been extended to be applicable in other fields like Computer Vision. This section provides an intuitive idea
of Mean shift and the later sections will expand the idea. Mean shift considers feature space as an empirical
probability density function. If the input is a set of points then Mean shift considers them as sampled from the
underlying probability density function. If dense regions (or clusters) are present in the feature space, then they
correspond to the mode (or local maxima) of the probability density function. We can also identify clusters
associated with the given mode using Mean Shift.
For each data point, Mean shift associates it with the nearby peak of the dataset’s probability density function. For
each data point, Mean shift defines a window around it and computes the mean of the data point. Then it shifts the
center of the window to the mean and repeats the algorithm till it converges. After each iteration, we can consider
that the window shifts to a denser region of the dataset.
At the high level, Mean Shift algorithm is specified as follows:
1. Fix a window around each data point.
2. Compute the mean of data within the window.
3. Shift the window to the mean and repeat till convergence.
56 | P a g e
the Adaptive Median Filter performs spatial processing to preserve detail and smooth non-impulsive noise. A primebenefit to this adaptive approach to median filtering is that repeated applications of this Adaptive Median Filter do
not erode away edges or other small structure in the image. A median filter is proposed for the purpose of
discovering and removing high level of salt and pepper noise. The image is processed twice so the filter is divided
into two stages viz. “Forward Scanning and Reverse Scanning”. In order to reduce the error detection rate we use two windows of different dimensions and the output image of first stage serves as input for the second stage.
Besides, the value of the noisy pixel is replaced by the median of the window calculated among noise-free
pixels. Our results and comparison exhibits that our proposed filter has very low error detection rate and high
restoration quality even with high level noise. Therefore the adaptive median filtering has been applied widely as an
advanced method compared with standard median filtering. The Adaptive Median Filter performs spatial processing
to determine which pixels in an image have been affected by impulse noise. The Adaptive Median Filter classifies
pixels as noise by comparing each pixel in the image to its surrounding neighbor pixels. The size of the
neighborhood is adjustable, as well as the threshold for the comparison. A pixel that is different from a majority of
its neighbors, as well as being not structurally aligned with those pixels to which it is similar, is labeled as impulse
noise. These noise pixels are then replaced by the median pixel value of
The pixels in the neighborhood that have passed the noise labeling test. The purpose of using adaptive trimmed
median filter are –Remove impulse noise, Smoothing of other noise , Reduce distortion- like
Excessive thinning or thickening of object boundaries. The advantages are - the standard median filter does not
perform well when impulse noise is Greater than 0.2, while the adaptive median filter can better handle these noises.
The adaptive median filter preserves detail and smooth non-impulsive noise, while the standard median filter does
not.
Fig (a) Image corrupted by impulse noise. Fig (b) Result of adaptive median filtering.
IV. RESULT
A binary image is a digital image that has only two possible values for each pixel. Typically the two colours used
for a binary image are black and white though any two colors can be used.
Figure (a) represents the input image and the corresponding output binarized image is shown in the fig (b). It is
57 | P a g e
Fig(a):Input image
In the pre-processing and main binarization steps, the features used are mainly phase derived, while in the post
processing step, specialized adaptive Gaussian and median filters are considered. One of the outputs of the
binarization step, which shows a high recall performance, is used in a proposed post processing method to improve
the performance of other binarization methodologies.
Fig(b): Binarized image
V. CONCLUSION
We have demonstrated a new test for recovery of binary images with dense reconstruction, Phase rotated
concurrence component, Mean Shift Algorithm and Adaptive Trimmed Median Filter Model. The noise is partially
removed using Edge and Otsu segmentation by subtracting background noise and separating actual and reflection
intensity level. Further, noise is removed by various filtering methods in Prcc along with the methodology of mean
shift algorithm. Finally a pure binarized image is obtained using Adaptive trimmed median filter. The parameter
that differentiates original noisy image and the binarized image is through
MSE and PSNR values. Ancient and other type of documents can be used here to recover pure image. Neural
58 | P a g e
REFERENCES
[1] E. Candes, J. Romberg, and T. Tao, “Robust Uncertainty Principles: Exact Signal Reconstruction from Highly
Incomplete Fourier Information”, IEEE Trans. Info. Theory, 52, pp. 489-509, 2006.
[2] D. L. Donoho, “Compressed Sensing”, IEEE Trans.Info. Theory, 52, pp. 1289-1306, 2006.
[3] J. Romberg, “Imaging via Compressive Sampling”, IEEE Sig. Proc. Mag., 25 pp. 14-20, 2008.
[4] M. Davenport, M. Duarte, Y. Eldar, and G. Kutyniok, “Introduction to compressed sensing”, (Chapter in
Compressed Sensing: Theory and Applications), Cambridge University Press, 2012.
[5] M. Duarte, M. Davenport, D. Takhar, J. Laska, T. Sun, K. Kelly, and R. Baraniuk, “Single-pixel Imaging via
Compressive Sampling”, IEEE Sig. Proc. Mag., 25 pp. 83-91, 2008.
[6] M. Lustig, D. Donoho, and J. Pauly, “Sparse MRI: The application of compressed sensing for rapid MR
imaging”, Magnetic Resonance in Medicine, 58, pp. 1182 - 1195, 2007.
[7] W. Dai, M. Sheikh, O. Milenkovic, and R. Baraniuk, “Compressive Sensing DNA Microarrays”, EURASIP J.
Bioinform. Syst. Biol., Article ID 162824, 2009.
[8] A. Gholami and M. Sacchi, “A Fast and Automatic Sparse Deconvolution in the Presence of Outliers”, IEEE