Electronic Theses and Dissertations Theses, Dissertations, and Major Papers
11-13-2018
CIR Parametric Rules Precocity For Ranging Error Mitigation In
CIR Parametric Rules Precocity For Ranging Error Mitigation In
IR-UWB
UWB
Sunil K. Meghani
University of Windsor
Follow this and additional works at: https://scholar.uwindsor.ca/etd
Recommended Citation Recommended Citation
Meghani, Sunil K., "CIR Parametric Rules Precocity For Ranging Error Mitigation In IR-UWB" (2018). Electronic Theses and Dissertations. 7618.
https://scholar.uwindsor.ca/etd/7618
This online database contains the full-text of PhD dissertations and Masters’ theses of University of Windsor students from 1954 forward. These documents are made available for personal study and research purposes only, in accordance with the Canadian Copyright Act and the Creative Commons license—CC BY-NC-ND (Attribution, Non-Commercial, No Derivative Works). Under this license, works must always be attributed to the copyright holder (original author), cannot be used for any commercial purposes, and may not be altered. Any other use would require the permission of the copyright holder. Students may inquire about withdrawing their dissertation and/or thesis from this database. For additional inquiries, please contact the repository administrator via email
CIR Parametric Rules Precocity For Ranging Error Mitigation In
IR-UWB
By
Sunil K. Meghani
A Thesis
Submitted to the Faculty of Graduate Studies
through the Department of Electrical and Computer Engineering
in Partial Fulfillment of the Requirements for
the Degree of Doctor of Philosophy at the
University of Windsor
Windsor, Ontario, Canada
2018
CIR Parametric Rules Precocity For Ranging Error Mitigation In
IR-UWB
By
Sunil K. Meghani Approved by:
____________________________________________ J. Poncela, External Examiner
University of Malaga, Spain
____________________________________________ R. Carriveau
Department of Mechanical, Automotive & Materials Engineering
____________________________________________ M. Khalid
Department of Electrical & Computer Engineering
____________________________________________ E. Abdel-Raheem
Department of Electrical & Computer Engineering
____________________________________________ K. Tepe, Advisor
Department of Electrical & Computer Engineering
iii
D
ECLARATION OF CO
-
AUTHORSHIP
/
PREVIOUS PUBLICATION
I.
Co-Authorship
I hereby declare that this dissertation incorporates some materials part of which are results of joint researches. The investigations and evaluations done throughout this dissertation used some technologies that were developed in the WiCIP research laboratory. The investigations were supported by collaborative help from my colleagues in WiCIP lab in the form of advice, critiques, mentoring, and teamwork. This dissertation also incorporates the outcome of joint research undertaken with Mati, Tank, and Marquez under the supervision of Professor Dr. Kemal Tepe. In addition, Muhammad Asif and Faroq Awin contributed technical knowledge and facilitied research work. In all cases, the key ideas, primary contributions, experimental designs, data analysis, and interpretation, were performed by the author, and the contribution of co-authors was primarily through the provision of suggestions, comments, critiques, verification, and other supports. I am aware of the University of Windsor Senate Policy on Authorship and certify that I have properly acknowledged the contribution of other researchers to my dissertation, and have obtained written permission from each of the co-author(s) to include the above material(s) in my dissertation.
II.
Previous Publication
iv
I certify that I have obtained written permission from the copyright owner(s) to include the above-published material(s) in my dissertation. I certify that the above material describes work completed during my registration as a graduate student at the University of Windsor.
I declare that, to the best of my knowledge, my dissertation does not infringe upon anyone copyright nor violate any proprietary rights and that any ideas, techniques, quotations, or any other material from the work of other people included in my dissertation, published or otherwise, are fully acknowledged in accordance with the standard referencing practices. Furthermore, to the extent of that I have included copyrighted material that surpasses the bounds of fair dealing within the meaning of Canada Copyright Act, I certify that I have obtained written permission from copyright owner(s) to include such material(s) in my dissertation. I declare that this is a true copy of my dissertation, including any final revisions, as approved by my dissertation committee and the Graduate Studies office and that this dissertation has not been submitted for a higher degree to any other University or Institute.
Dissertation chapter Publication title/full citation
Status
Part of Chapter 3 and 5 S.K. Meghani, M. Asif, F. Awin, K. Tepe; “ Empirical Based Ranging Error Mitigation in IR-UWB: A Fuzzy Approach”
Submitted
Part of chapter 3 and 5 A. Marquez, B. Tank, S. K. Meghani, S. Ahmed, K. Tepe; “Accurate UWB and IMU based indoor localization for autonomous robots” presented at IEEE 30th Canadian Conference on Electrical and Computer Engineering (CCECE) Canada-2017
Published
Part of chapter 3 and 4 M. Mati, K. Tepe, S.K. Meghani; “Received Signal Strength Based NLOS Classification & Mitigation in Ultra Wide Band Localization System” presented at GC-WOC 2017
v
ABSTRACT
The cutting-edge technology to support high ranging accuracy within the indoor environment is Impulse Radio Ultra Wide Band (IR-UWB) standard. Besides accuracy, IR-UWB’s low-complex architecture and low power consumption align well with mobile devices. A prime challenge in indoor IR-UWB based localization is to achieve a position accuracy under non-line-of-sight (NLOS) and multipath propagation (MPP) conditions. Another challenge is to achieve acceptable accuracy in the conditions mentioned above without any significant increase in latency and computational burden. This dissertation proposes a solution for addressing the accuracy and reliability problem of indoor localization system satisfying acceptable delay or computational complexity overhead. The proposed methodology is based on rules for identification of line-of-sight (LOS) and NLOS and the range error bias estimation and correction due to NLOS and MPP conditions. The proposed methodology provides accuracy for two major application domains, namely, wireless sensor networks (WSNs) and indoor tracking and navigation (ITN). This dissertation offers two different solutions for the localization problem. The first solution is a rules-based classification of LOS / NLOS and geometric-rules-based range correction for WSN. In the first solution, the Boolean logic based classification is designed for identification of LOS/NLOS. The logic is based on channel impulse response (CIR) parameters.
The second solution is based on fuzzy logic. The fuzzy based solution is appealing well for the stringent precision requirements in ITN. In this solution, the parametric Boolean logic from the first solution is converted and expanded into rules. These rules are implemented into a fuzzy logic based mechanism for designing a fuzzy inference system. The system estimates the ranging errors and correcting unmitigated ranges. The expanded rules and designed methodology are based on theoretical analysis and empirical observations of the parameters. The rules accommodate the parameters uncertainties for estimating the ranging error through the relationship between the input parameters uncertainties and ranging error using fuzzy inference mechanism.
vi
vii
D
EDICATION
to my
Mother and Father
viii
A
CKNOWLEDGMENTS
I would like to thank my advisor Dr. Kemal Tepe for introducing me into the research area of indoor localization, for his help and support during all phases of this dissertation and mainly for the many fruitful discussions, which always inspired and motivated me. I am grateful for all the time he dedicated to me and my work although he has many other students they also need his support. He became a good friend and I hope this relationship will last after the end of this study period too.
I would like to thanks my past colleague and friend Dr. Muhammad Asif and I feel special gratitude for all the time he dedicated and his advises to me and my work despite the long geographic distance between us.
ix
T
ABLE OF
C
ONTENTS
Page
Declaration of Co-Authorship/ Previous Publication ………..………….iii
Abstract …..………....v
Dedication …..………...………...vii
Acknowledgments ..……….………...………viii
List of Tables ……...………xiii
List of Figures …..………...…xiv
List of Abbreviations …..……….xv
1. Introduction ….………1
1.1. Introduction..……….l 1.2. Applications of indoor localization (IL) ...………...……….1
1.3. Challenges in IL ….………..2
1.4. Problem of Statement .……….4
1.5. Contributions .………..5
1.6. Research methodology ………6
1.7. Dissertation organization .………8
2. Background and Literature Review ………...9
2.1.Introduction ...……….9
2.2. IL Positioning metrics .………9
2.3. Types of ranging ………….………..10
2.3.1. Received signal strength indicator ……….10
2.3.2. Time of arrival ………...11
2.3.3. Time difference of arrival ………..11
2.4. Wireless standards used for IL ………...11
2.4.1. Impulse radio ultra wide band (IR-UWB) …..………...11
2.4.2. Wireless local area network (WLAN) ………12
2.4.3. Zigbee …....………12
x
2.5. IR-UWB and IL .………....13
2.6. Positioning algorithm types .………..13
2.6.1. Least square trilateration ...………14
2.6.2. Extended Kalman filter (EKF) ………...………14
2.6.3. Particle filter (PF) ………..15
2.7. Non-line-of-sight (NLOS) ranging error mitigation types ………....………16
2.7.1. Range statistic based ………..17
2.7.2. CIR data based ……….………..17
2.7.3. Machine learning based ……….18
2.7.4. Fuzzy mapping based obstruction identification ………19
2.8. Summary ………...19
3. Experimental studies ….………20
3.1. Introduction ...………20
3.2. Device selection for experiments ...………20
3.2.1. Comparison of Decawave and Time Domain devices ………20
3.2.2. Decawave EVK-1000 kit description ………21
3.3. Scenarios for experimental setups .………24
3.3.1. Office scenarios……….……….24
3.3.2. Warehouse Scenario….………..25
3.4. Observations of parameters in different scenarios ……….25
3.4.1. Received signal strength ………25
3.4.2. First path signal strength ………26
3.4.3. Rise time ………27
3.4.4. Average CIR normalized magnitude ……….28
3.4.5. Leading edge normalized magnitude …..………...29
3.4.6. First path max normalized magnitude ………29
3.5. Summary ….………...………...30
4. A parametric rule-based classification and localization algorithm for IR-UWB …….…31
4.1. Introduction …..………..………...31
4.2. Classification of LOS and NLOS ………...32
xi
4.2.2. Classification methodology ………… ………..………33
4.3. Range mitigation methodology ……...………..34
4.4. Experimental data ……….……….38
4.5. Results and discussions …………..………38
4.5.1. Classification performance ………..………..38
4.5.2. Range mitigation performance ……….. 41
4.5.3. Localization performance ………..41
4.6. Summary………..…...………...43
5. Rule based ranging error mitigation for IR-UWB: A fuzzy logic approach …………...45
5.1. Introduction ...………..…………...………...45
5.2. Fuzzy terminologies ……….……….………46
5.2.1. Fuzzy set ………...……….46
5.2.2. Membership function ………47
5.2.3. Fuzzification ………..………47
5.2.4. Fuzzy inference ……….47
5.2.5. Defuzzification.…...………...48
5.3. Parameters uncertainty analysis ..………...48
5.3.1. Received signal strength ………48
5.3.2. First path signal strength ………...……….50
5.3.3. Rise time ………..………..50
5.3.4. Ranging error ………....……….51
5.4. Fuzzy inference system model ………..52
5.5. Experimental Evaluation………53
5.5.1. Experimental parameters analysis ...………..54
5.5.2. Ranging error mitigation performance ………..55
5.5.3. Localization performance ...………...59
5.6. Summary …… ………...61
6. Conclusion ………..……62
6.1. Contributions ……….62
6.2. Future research directions ………..63
xii
Appendix A: Copyright permission ………...………69
xiii
L
IST OF
T
ABLES
Page
2.1 Existing studies for classification and mitigating NLOS ranging errors in IR-UWB ………16
3.1 Key characteristics of EVK-1000 & PulseON 410 kits………..21
3.2: DW1000 operating characteristics……….22
3.3 Scenarios and obstructions……….……….24
4.1Parameters observations in LOS and NLOS………32
4.2 Identification Rules for LOS/NLOS…..………..33
4.3 Confusion Matrix……….39
4.4 Range mitigated & NLOS Performance………..41
5.1 Rules for FIS………55
xiv
L
IST OF FIGURES
Page
2.1 Different Methods for estimating leading edge based on energy detection …...…...………10
2.2 Ranging error variation in LOS and NLOS conditions …..………..………15
3.1EVK-1000 kit EVB-1000 nodes ….……….21
3.2Mode of Operation of EVK-1000 Standalone vs. USB connection ……….………22
3.3 Office floor plan ………..25
3.4 Warehouse floor plan ………..26
3.5 Parameters PDF in different scenarios ………27
3.6 Average magnitude ( ), FP-Min ( ), and FP-Max ( ) levels in different scenarios …...……….28
4.1 Anchors and agent nodes placement ………...35
4.2 Flow-chart of the proposed algorithm ……….37
4.3 Performance comparison of different classifiers ……..………40
4.4 Localization performance ….………...42
4.5 Histogram & CDF of NLOS & Mitigated Algorithm ranges ….…….………43
5.1 Fuzzy classification & membership function …..……….46
5.2 Rules structure ….………48
5.3 RSS and LOS/NLOS ….………..49
5.4 CIR in LOS and NLOS …..………..50
5.5 FIS Model ….……….………..52
5.6 Inputs & outputs MFs for FIS model ….……….54
5.7 Performance evaluation for different MFs and defuzzification processes …..……….56
5.8 CDF for residual ranging errors…...……….57
5.9 Anchors Placement around Target node with different according to (5.22) …..………....58
5.10 Outage Probability for various with varying …….……….59
xv
L
IST OF
A
BBREVIATIONS
AN Anchor Node
ith AN placement
BEKF Biased extended Kalman filter CIR Channel impulse response CDF cumulative distribution function
Mitigated distance NLOS distance
EKF Extended Kalman filter Percentage error
EU ETSI EN European Union European Telecommunications Standards Institute European Standard
FCC Federal Communications Commission Leading edge MPC
Second MPC in the first path after Third MPC in the first path after Strongest MPC in CIR
FIS Fuzzy inference system FP False positive
FPSS First path signal strength FPR False positive rate FN False negative FNR False negative rate
GNSS Global navigation satellite system GoC Centre of gravity
xvi
HM Height method IL Indoor localization
ITN Indoor tracking and navigation IR-UWB Impulse radio ultra wide band K Proportionality constant KF Kalman filter
LED Leading edge detection LOS line-of-sight
LS-SVM Least square support vector machine Average CIR normalized magnitude Leading edge normalized
First path max normalized magnitude MEMS Microelectronic mechanical system MF Membership function
MISO Multiple input single output MoM Mean of maximum
MPC Multipath component MPP Multipath propagation MWSN Mobile WSN
N Number of measurements Number of anchor nodes NLOS non-line-of-sight
PA Position algorithm
PDF probability density function PF Particle filter
xvii
! Outage probability
PSD Power spectral density
" Misclassification rate
RRE Residual range error RSS Received signal strength
RSSI Received signal strength indicator RMS Root mean square
# . Mitigated range
# %! . True range
RT Rise time
RTLS Real-time localization system RToA Round trip time of arrival RX Receiver
SNLOS Soft NLOS
SNR Signal to noise ration SPI Serial peripheral interface SVDD Support vector data description TD Time difference
TDoA Time difference of arrival TIN-OUT Input-output delay time
TN Target node TNa True negative
TP True positive ToA Time of arrival
TDMA Time division multiple access TOF Time of flight
xviii
TW-ToA Two way time of arrival TX Transmitter
WLAN Wireless local area network WSN Wireless sensor network 2D Two dimensional
&'( range improvement factor
µ Constant
1
I
NTRODUCTION
1.1.
Introduction
Locating position and navigating routes in indoors where global navigation satellite systems' (GNSS) signals cannot penetrate fall under indoor localization (IL) (or indoor positioning). IL has been gaining attention from the research community and industry in recent years due to widespread applications requiring either standalone or in conjunction with data communication where GNSS ceases to perform [13-15]. In IL, there are two types of nodes namely target node (TN) and anchor node (AN). The TN needs to be localized, and the AN is at a known position. The localization requires two phases, i.e., (i) ranging and (ii) positioning. In the ranging process, the distance between TN and AN(s) is estimated. The estimated distance utilizes radio signal characteristics such as received signal strength and received signal timing information. In the positioning phase, usually more than one estimated distances or one estimated distance in addition to an estimated angle of arrival of the ranging signals are used to determine the agent's position.
Ranging in IL under non-line-of-sight (NLOS) and multipath propagation (MPP) conditions is a challenging task is due to estimation of errors caused by obstructed and blocked, scattered, diffracted and reflected signals. The indoor environment exhibits dense multipath channel due to metal objects in the vicinity; usually found on factory and building floors and walls. In these environments impulse radio ultra-wide-band (IR-UWB) is the optimum choice for providing sub-centimeter positioning accuracy [6, 16]. However, NLOS is still a most critical challenge in IR-UWB for achieving that accuracy [17, 18].
1.2.
Applications of IL
In this section, application domains that require IL as standalone or as an add-on to enhance functionality, operability, and capability of the domain and stretch domain’s applicability in applications are discussed. Those domains are as follows:
•
Robots & Drones
2
span from industrial floors, smart warehouses, surveillance, military, civil engineering, domestic applications and many innovative applications [15, 17]. For instance, drones are used in [19] for site monitoring and [20] for indoor rescue service. For all these applications, IL is the fundamental technology which supports finding routes and navigating around from one place to another.
•
Wireless Sensor Network (WSN)
In the past two decades, WSN flourished and developed at an exponential rate due to advancement and mass scale developments in micro-electromechanical system (MEMS), fabricated chip systems and wireless communication [21]. These technologies are integrated on a platform called sensor nodes. The nodes measure parameters (e.g., temperature and pressure), process data and store it. The interconnections of these nodes formed a network called WSN. Due to the added value to the number of systems, WSN finds a way in many applications in civil and military domains [22]. In the application domains, WSN functionality and applicability are significantly enhanced with localization. For instance, WSN's routing capability and energy consumption can be optimized through geographical information based routing protocols [22]. Also, localization plays a central role in mobile WSN (MWSN). In most of the WSN applications, IL is the best fit for WSN [21].
1.3.
Challenges in IL
•
NLOS & Multipath
IL is operated in indoor and cluttered environments. In these conditions, signal propagation experienced reflection, refraction diffraction and shadowing due to which signal arrived at the receiver in multiple paths called multipath propagation [23]. Also, the direct signal path from transmitter and receiver (known as line-of-sight path) is partially or fully blocked due objects in the vicinity. The blocked propagation is known as NLOS. Both Multipath and NLOS occur frequently and impact the ranging estimation error, which in turn degrades position accuracy significantly [18, 24].
3
Latency in estimating the position of the TN occurs at both phases (i.e., ranging and positioning). In the ranging phase, latency depends on the employed spectrum and data rates, technique to estimate distance (i.e., time-of-arrival), and propagation condition. Mainly, the NLOS propagation condition introduces a significant delay in estimating range error bias and correcting ranging where statistically based solutions employed due to the required number of measurements [25, 26]. In the positioning phase, delay depends on the algorithm that is used and the number of ANs that are participating in positioning. For instance, in the trilateration algorithm, increasing ANs beyond the minimum requirement (i.e., three ANs) increases position accuracy [27].
•
Computational Cost
Computational complexity, hence its cost, depends on the employed wireless standard, ranging technique, position algorithm, and propagation condition. In case of wireless standard, IR-UWB considered being low complex in hardware implementation [28, 29]. For ranging technique, received signal strength (RSS) based estimation is less complex than other techniques stated in [30], and RSS is available in many wireless standards [31-33]. For positioning algorithm, a particle filter (PF) algorithm is the least computationally efficient among the available algorithms [34, 35].
•
Energy [36]
Energy is a primary concern for mobile devices since these devices have limited power sources. Enhancing position accuracy requires more use of detection techniques, more sophisticated positioning algorithms (i.e., requires more computational resources) and more radio sensing which aggravated energy usage. That is why a trade-off between energy requirement and location accuracy needs to be established.
•
Interference
4
[38], but interference within the spectrum due to adjacent signals pose a challenge in the reliable operation.
•
Security & Privacy [22]
Location information and access to the localization system should provide security features and controlled access. Lack of these features makes system susceptible to malicious activities that can falsely advertise locations, altered routes, and degrade or halt the system functioning. Moreover, in mission-critical applications (e.g., in the military domain), the location information should be secured with enhanced security features.
•
Scalability[33]
Scalable positioning system ensures normal positioning function as positioning scope expands. The expansion can be in terms of the increased number of requests for localization or geographical coverage. A scalable system in the sense of capacity wise is one that can handle the localization requests within specified requirements without any interruption in services. Regarding geographical coverage, a scalable system is one that ensures interrupted services as the system switches localization requests between the ANs. Usually, a positioning system with limited ANs covers a specific area. As the distance between the AN(s) and TN increases, location accuracy performance decreases. So to expand the coverage, more ANs are added.
1.4.
Problem Statement
In this dissertation, solutions to the problems associated with NLOS and multipath propagations that impact position accuracy, position updates, and computational burden of real-time IL systems for tracking and navigation based on the IR-UWB spectrum are investigated. Solutions to the following specific problems are investigated:
5
Problem 2. Position Updates: In order to compensate ranging error, multiple measurements are required to obtain statistics of the error to mitigate it.These measurements induce latency and affect position updates. Furthermore, acquisition of channel impulse response (CIR) whole frame data for the parameters estimation can induce further delay for particular measurement [1].
Problem 3. Computational Complexity: Additional processing is required to mitigate ranging errors due to NLOS. So, solutions which are computational intensive add additional computational burden and complexity. For example, the machine learning solutions which estimate range error bias under NLOS conditions [3] and particle filter (PF) for estimating position while reducing ranging errors [39].
1.5.
Contributions
The main contributions of this dissertation are:
1. A novel rule-based classification of line-of-sight (LOS) and NLOS channel condition is proposed, and performance of this classifier is evaluated using empirical data and compared with existing works in [7, 40]. The rules are designed using empirical analysis of the collected channel impulse responses (CIRs) in different environments. The rules utilize CIR’s parameters such as received signal strength (RSS), first path signal strength (FPSS) and rise time (RT) which are readily available from Decawave® devices and doesn’t incur an additional delay in estimating the conditions. Moreover, the geometric correction of one range (which is NLOS range) out of three ranges algorithm is presented. This is suitable for applications such as WSN where one out of three AN-TN pairs is most likely experience NLOS condition at a particular location. The assumption is supported with Probabilistic Model.
6
correlation between ranging error and the parameters under different channel conditions is developed. Second, the correlation is utilized as an expert knowledge for a fuzzy mechanism to design rules for fuzzy inference. The work is compared with work from [12] in terms of RRE CDF delay in estimating the error. Moreover, the proposed fuzzy based system is also compared with [12] for computational complexity in terms of input-output delay time [41]. The proposed solution shows a promising performance and reduces delay in estimating ranging error bias compared to [12]. Moreover, the proposed system doesn't require any training phase prior to estimating the error as it is validated in different environments.
The results show that the proposed rule-based solutions exhibit the following desired properties closely: enhanced localization accuracy under MPP and NLOS conditions, enhanced positioning availability under NLOS conditions, and reduced computational burden. While providing those benefits, it doesn't add latency in estimating range error bias.
1.6.
Research Methodology
All problems discussed in 1.5 related to range error bias estimation and correction are addressed in this dissertation. In this work, uncertainties in the CIR’s parameters due to NLOS and MPP conditions and its correlation to range error bias are analyzed through the extensive experimental campaign. It is found that designing rule based on the correlation is acceptable in an implementation using fuzzy inference mechanism for estimating the error bias. Therefore, the following methodological steps are performed:
Step#1. Measurements: In this phase, extensive experimental studies are done in three different environments. The experiments are conducted using Decawave® devices, and different NLOS scenarios are emulated in real-time using different obstructions. In each scenario, CIRs are collected along with other parameters.
Step#2. Analysis: Extensive analysis is done on measured parameters to understand the variation of different parameters in different channel conditions. The relationship between measured parameters and ranging errors is also analyzed.
7
are compared with predefined thresholds. The thresholds are derived through empirical analysis done in the previous step.
Step#4. Expanding rules & Regression: In this phase, rules are further expanded to identify errors in LOS and NLOS. The mapping between the parameters (inputs) and range error bias (output) is developed through the expanded rules. The mapping is realized through theoretical and empirical analysis of parameters uncertainties and their correlation with the error bias.
8
1.7.
Dissertation Organization
9
BACKGROUND
&
LITERATURE
REVIEW
2.1.
Introduction
The process of estimating the distance between TN and AN is called ranging. Electronically, ranging process is done with the help of signal transmission between the nodes which are acted as transmitter and receiver through signal properties (i.e., timing, received power level or phase information). Ranging with accuracy is critical for estimating the position of TN close to the TN’s true position and reliable performance of IL. Moreover, accurate ranging in IL is not a trivial task because of prevailing MPP and NLOS conditions in indoor and RF harsh environments. Notably, these conditions are dynamically changed for moving TN. Therefore, techniques are needed that can estimate and correct ranging error from signal properties due to the conditions. Moreover, the techniques that enhance accuracy and hence reliability have various influences on IL’s availability, latency, computational requirement, and energy consumption [33].
In this chapter, first, metrics used in this research that gauge and impact the positioning performance are discussed. Second, types of ranging and wireless standards used in IL are reviewed. Third, the advantages of IR-UWB standard for precision localization are discussed. Fourth, review of existing positioning algorithms which are used specifically in IR-UWB are presented. Fifth, existing studies of NLOS (or LOS) classification and ranging error mitigation based on IR-UWB are reviewed. Also, their advantages and shortcomings are discussed. Finally, the chapter is summarized in the Summary section.
2.2.
IL Positioning Metrics
The positioning metrics are used to express various objectives of the positioning with respect to the reliable functioning of IL. This section provides a brief overview of the positioning metrics related to this study:
10
position and the true position should be minimum under all operating conditions. Thus, it is crucial to minimize ranging errors and others errors that affect positioning accuracy.
B. Availability: It is defined as for specific operating (error) threshold, the localization system is available for the percentage of time available under different operating conditions. The metric shows the robustness against different errors for tolerable threshold error.
C. Latency: It is defined as a delay in estimating TN position provided a request is made for the estimation. For fast positioning updates, delay in ranging acquisition, estimating ranging error and mitigating the error, and estimating positions from ranges are taken into consideration and should be minimized.
2.3.
Types of Ranging
In this section, an overview of different ranging techniques and their pros and cons are discussed. The techniques are based on received signal and timing information of the signal and are as follows.
2.3.1.
Received Signal Strength Indicator (RSSI)
RSSI is the most commonly used ranging estimation technique in wireless localization systems [42-44] because it is readily available in the form of received power strength. The estimation process is based on the Friis equation [45] using transmitted and received powers. However, RSSI based ranging and positioning performance degrades significantly under NLOS conditions due to
11
attenuation of received signals related to obstruction between the transmitter (TX) and receiver (RX) [46].
2.3.2.
Time Of Arrival (ToA)
In ToA, ranging is estimated using signal arrival time after synchronization between TX and RX. Usually, detection of the arrival time is implemented using a threshold based edge detection method [1, 47]. In the literature, different methods are suggested for detecting leading edge after the threshold as illustrated in Fig. 1. The setting of the threshold and detection mechanism affects the ranging performance in LOS and NLOS conditions [4, 47, 48]. From the arrival time, the propagation time between TX and RX is obtained, and thus distance is estimated using RF signal speed (i.e., the speed of light). In ToA, precision synchronization between TX and RX is required [49]. However, variation to TOA which is round trip ToA (RToA) also known as two way ToA ranging does not require precise synchronization [1, 33]. In ToA, ranging accuracy can be achieved with 2-3 cm error in LOS conditions [1, 6]. However, ToA estimation required a very wideband signal to estimate signal arrival time [49].
2.3.3.
Time Difference Of Arrival (TDoA)
A slightly different version of ToA is called TDoA in which synchronization is required between participating ANs (i.e., minimum three ANs are required) rather than between TN and AN. In TDoA, TN is in listening mode and received signal time stamps (arrival time) from ANs. The time difference (TD) is estimated from propagation times, and these TDs create hyperbolas. From the hyperbolas, the position is estimated. The advantages of using TDoA are that more than one TNs can be localized simultaneously [33], and does not require AN-TN synchronization (good for mobile TNs). However, TDoA requires more calculations (processing) compared to ToA [49] and accuracy degraded under NLOS condition [50].
2.4.
Wireless Standards Used for IL
2.4.1.
Impulse Radio Ultra Wide Band (IR-UWB)
12
and advantages of narrowband communication, it was abandoned. With the recent advancement in digital circuitry and digital signal processing, renewed interest have been developed towards (IR) UWB for its various advantages [6, 16, 51-53]. The prominent edge of IR-UWB is providing precision localization with an accuracy of 2-3 cm in LOS scenarios along with data communication [6, 54]. This advantage is inherent from transmitted pulses which have high resolution in time. For this reason, Federal Communications Commission regulated UWB and assigned operating frequency bands between 3.1 and 10.6 GHz with a cap on the emitting power of -41.6 dBm/MHz in band power spectrum density (PSD). The cap on power is due to the very large bandwidth of UWB which can interfere with other wireless systems. UWB is also standardized by various organizations such as Institute of Electrical and Electronic Engineering (IEEE) with standards 802.15.3a and 802.15.4a (IR-UWB). The detailed of IR-UWB can be found in [55, 56].
2.4.2.
Wireless Local Area Network (WLAN)
WLAN is defined as a distributed wireless network of connected devices with an access point that can connect to the internet. WLAN operating frequency bands (such as 2.4 and 5.8 GHz) are a license-free spectrum. Due to this, it is the most commonly used wireless network worldwide. And is regulated through organizations such as IEEE (IEEE 802.11a/b/g/n). IL is enabled in WLAN with the help of RSSI ranging [31]. The distinct advantage of IL using WLAN is its low cost as WLAN deployments are commonly found.
2.4.3.
Bluetooth
Bluetooth is developed for networking among personal and computer peripheral devices. The standard is designed for ease of wireless connectivity instead of using cables for short-range communication. Bluetooth is operated in 2.4 GHz frequency spectrum and is based on IEEE 802.15.3 standard [57]. Bluetooth standard is used in IL in which distance is estimated based on RSSI technique as in [43, 58].
2.4.4.
Zigbee
13
WSNs and in military applications because of its low-power and low-bandwidth operating characteristics [60, 61]. Zigbee based IL uses RSSI for ranging estimation [62, 63].
2.5.
IL & IR-UWB
IR-UWB is an ideal candidate for IL in precision and accuracy demanding applications [16]. This is due to IR-UWB’s prime advantage of providing high resolution positioning along with the following notable advantages [6, 55]:
• Adaptable data rates: suit well for both low-data-rate and high-data-rate applications. • Low complexity hardware: As carrier-free transmission in which only very short radio
frequency (RF) pulses are transmitted and received.
• High penetration capability: Due to very short pulses which have a high gain that can
penetrate through the obstructions
• Very low power spectrum density (PSD) (-42 dBm/MHz): Due to this coexistence with
another wireless system, and IR-UWB doesn’t interfere with other wireless communication.
• Low energy consumption: due to PSD.
• Inherent Security feature: due to low power emission IR-UWB’s communication appears
to be below the noise floor for other wireless systems. And for these systems, IR-UWB’s signals are treated as noise.
Due to the above-stated advantages, IR-UWB is adopted commercially and devices available from vendors such as Time Domain®, Decawave®, and Ubisense®. In this thesis, the IR-UWB standard is considered, and the accuracy and latency problem related to mitigating ranging error is considered in IR-UWB domain. In the following section, existing range error techniques with reference to the domain are discussed. First, positioning algorithms utilized in IR-UWB are discussed followed by ranging error techniques.
2.6.
Positioning Algorithm Types
14
trilateration extended Kalman filter, and particle filter are discussed with reference to IR-UWB are as fellows.
2.6.1.
Least Square Trilateration
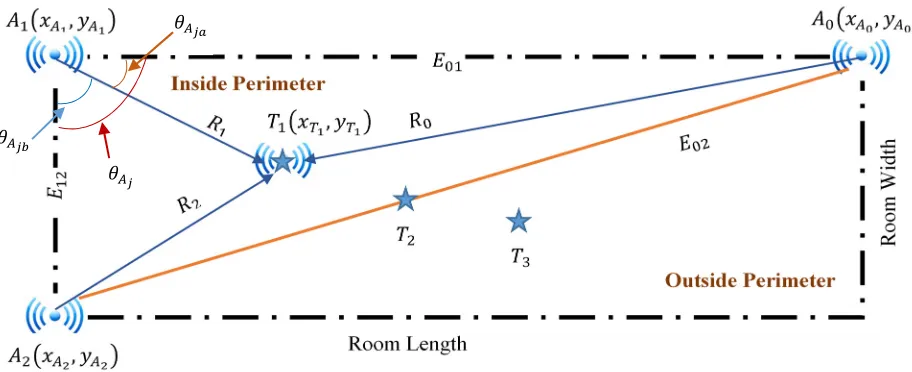
Trilateration is the geometric process in which the absolute or relative location of the point is estimated given distances using circles. For two dimensional (2D), three distances between ANs and TN are required. The distances are as follows:
= )*+" ,+ -.*/" − / -., (2.1)
Where 1 = 1,2, ⋯ 6 and 6 ≥ 3, for 2D. . To establish our notations, let an TN be at an unknown position denoted by = (+" , /" ). The TN is surrounded by the number of ANs denoted by = 6 with known positions denoted by = (+ -, / -). In order to localize the TN, 2.1 need to be solved for unknown (+" , /" ). The coordinates are treated as the point of intersection of several spheres (or circles) whose center of location are . The problem of estimating falls under the least square (LS) domain. Furthermore, is estimated using a ranging algorithm and denoted as 9 . As 2.1 is nonlinear and the solution is also nonlinear LS and algorithm for finding
is given as:
: = ;<="' >∑* -, :-.∈ * 9 − . , (2.2)
where B are the number of agent-anchor pairs in the vicinity. For 2D, min B = 3.The solution using (2.2) is not feasible because it produces a nonlinear equation of high degree [64]. So, the TN position can be estimated through minimizing (2.2) by solving numerically using pseudo inverse linearization method [64]. However, the solution does not consider ranging errors and 9 should be close to for accurate estimation of .
2.6.2.
Extended Kalman Filter (EKF)
15
and KF performance degrades under these nonlinearities. So, KF is evolved into extended KF (EKF) or sigma point KF to address the nonlinearity problem. Also, in EKF, noise distributions are assumed to be Gaussian with proper tuning of covariance of the assumed probabilistic model. EKF is used in indoor tracking and navigation using it in IR-UWB is advantageous due to low computational complexity as in [65, 66]. However, the performance of EKF is highly depended on the proper tuning of covariance of the assumed probabilistic model and initial state estimation [2, 66].
2.6.3.
Particle Filter (PF)
PFs are types of Bayesian filters which are applied to systems with nonlinear measurements and non-Gaussian distributions. In PF, the estimated TN’s position is considered as samples rather than parametric density [67]. For this reason, PF can cope with nonlinearity and complex non-Gaussian distributions. PF is used in indoor tracking and navigation in general and particularly in IR-UWB domain as in [67, 68]. For instance, in [67], authors used PF for localization in underground mines for IR-UWB radar. The prime advantage of PF is its robust performance under nonlinearity and non-Gaussian distributed noise and disturbances. On the other hand, its prime disadvantage is its high computational complexity which overshadows its advantage in mobile devices [65].
16
2.7.
NLOS Ranging error Mitigation Types
As a wireless technology, IR-UWB deployments experienced MPP and NLOS condition. Due to conditions persist in wireless systems, ranging errors are introduced to IR-UWB based IL systems.
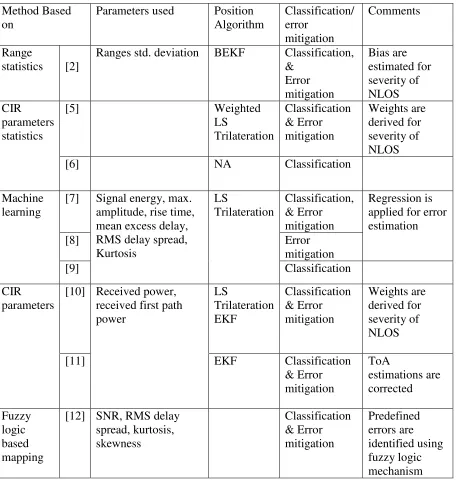
Table 2.1: Existing studies for classification and mitigating NLOS ranging errors in IR-UWB Method Based
on
Parameters used Position Algorithm Classification/ error mitigation Comments Range
statistics [2]
Ranges std. deviation BEKF Classification, & Error mitigation Bias are estimated for severity of NLOS CIR parameters statistics
[5] Weighted
LS Trilateration Classification & Error mitigation Weights are derived for severity of NLOS
[6] NA Classification
Machine learning
[7] Signal energy, max. amplitude, rise time, mean excess delay, RMS delay spread, Kurtosis LS Trilateration Classification, & Error mitigation Regression is applied for error estimation
[8] Error
mitigation
[9] Classification
CIR parameters
[10] Received power, received first path power LS Trilateration EKF Classification & Error mitigation Weights are derived for severity of NLOS
[11] EKF Classification
& Error mitigation ToA estimations are corrected Fuzzy logic based mapping
17
Therefore, in literature, techniques have proposed to mitigate these errors. The techniques that are available in the literature are summarized in Table 2.1, and a brief overview is presented as follow.
2.7.1.
Range Statistics Based
This technique is based on multiple range measurements. With those measurements, the ranging errors’ statistical parameters are estimated. The ranging error variations exhibit differently in LOS and NLOS conditions as illustrated in Fig. 2.1 [3]. Based on the variation, a weight can be assigned and accounted in biased EKF (BEKF) as studied in [2]. In [2], authors derived weights for mitigating NLOS ranging error from measured range statistics and modified measurement covariance of EKF which is called BEKF. The technique is simple and relies only on ranges. Therefore, it is also used in IL systems based on other standards such as in WLAN for mitigating the error [69, 70]. However, estimating online variance and standard deviation for moving TN is inaccurate particularly under NLOS conditions [65]. Moreover, latency is introduced due to multiple measurements’ requirement which affects position updates. Also lost of information for using range statistics instead of CIR data [7].
2.7.2.
CIR Data Based
18
environment for the identification of LOS/NLOS. Similar to the range statistic based, CIR parametric statistic technique also introduced latency as because of statistically based solutions.
In case of power profile of CIR, received signal power and first path power at RX are used for identification of LOS and NLOS condition and weighting NLOS condition’s severity. In [10], the author identified LOS, soft NLOS (i.e., direct path present) and severe NLOS (i.e., in which there are significant ranging errors) conditions based on power ratio. The power ratio is between received power and FP received power. After identifying severe NLOS, range correction and position estimation are based on geometric LS algorithm. In [11], authors implemented identification technique similar to [10] but corrected ToA estimation based on the empirically predefined standard deviation. ToA error variance for severe NLOS conditions. The corrected ToA estimation is used in EKF for estimating TN position.
2.7.3.
Machine Learning Based
19
time-consuming due to mandatory training phase and highly dependable on the uncertainties of the environments.
2.7.4.
Fuzzy Mapping Based Obstruction Identification
In [12], authors purposed obstruction identification based NLOS range error mitigation based on a fuzzy mapping between signal characteristics (inputs) and likely obstruction (output). The signal characteristics are signal-to-noise ratio (SNR), RMS delay spread, kurtosis and skewness for identification of predefined obstructions (propagations), namely, iron door, wood door, concrete wall, pedestrian, and corner. After identification, range error is compensated using predefined range error for a particular obstruction. The empirical designed fuzzy logic model is evaluated and validated in predefined propagations. However, CIR frame length data is required for estimating the signal characteristics. Moreover, acquiring CIR frame data in runtime adding a delay in estimating range between ANs and TNs [1].
2.8.
Summary
20
E
XPERIMENTAL STUDIES
3.1.
Introduction
IR-UWB based devices are available commercially since the late 90s. However, these devices are streamlined after industrial standards (such as IEEE 802.15.4a) in earlier 2000s. Moreover, due to the advancement of digital and RF front end as well as potential applications of IR-UWB in different domains, proliferation, and availability of the devices are improved over the time. Due to this, recent research studies to address NLOS and MPP issues in IR-UWB are based on and validated using the devices [3, 6, 12]. In [3], design methodologies are empirically designed in different environments (i.e., office, universities, industries) using different scenarios by conducting and collecting data using experimental setups. So, it is vital to carry out empirical studies using an experimental testbed for a fair comparison with existing work. Moreover, the proposed solutions are more convincible and practical using experimental validation rather than simulation-based validation.
In this chapter, available devices, their features and comparison, and details of the selected device are presented first. Second, experimental setups in different environments, scenarios selection and placement of nodes are described. Third, parameters observations under different scenarios for LOS and NLOS conditions are analyzed. Finally, chapter conclusion is drawn in the summary section.
3.2.
Device selection for experiments
3.2.1.
Comparison of Decawave
®& Time Domain
®devices
21
3.2.2.
Decawave EVK-1000 Kit Description
•
Hardware
The kit performs two-way ToA (TW-ToA) based ranging to estimate the distance between two nodes. It consists of two EVB-1000 boards (nodes) as shown in Fig. 3.1. Each board is equipped with DW-1000 chipset, ARM controller and omi-directional antenna. The heart of the board is DW-1000 radio CMOS chip which is fully integrated low power radio transceiver compliant with IEEE 802.15.4-2011 UWB standard. The chip consists of the analog front end (both RF and
Fig. 3.1:EVK-1000 kit EVB-1000 nodes[1]
Table 3.1: Key Characteristics of EVK-1000 & PulseON 410 kits
Characteristics EVK-1000 PulseON® 410
Ranging Based on TW-TOF TW-TOF
Ranging Accuracy Typically ±3 cm (LOS Condition)
2 cm (LOS Condition) Operating range Upto 290 m @ 110 Kbps (LOS
Condition)
Upto 500 m (LOS Condition)
Operating Frequency 3.5-6.5 GHz FCC*: 3.1-5.3 GHz EU ETSI EN**: 3.1-4.8 GHz
Access technique TDMA ALOHA/TDMA
Average transmitted power
-41.3 dBm/MHz -41.3 dBm/MHz RF spectrum sampling
rate
Sub Nyquist rate Nyquist Rate (min.)
Regulation Compliance FCC & EU ETSI EN FCC & EU ETSI EN
*FCC: Federal Communications Commission
22
baseband) and a digital back-end interface to host processor (that control the chip). The chip’s mode of operations are summarized in Table 3.2, and a detailed description along with data sheets can be found in [1]. The onboard USB or serial peripheral interface (SPI) ports support external application (or controller) to control the radio chip. Therefore, EVB-1000 board can be operated either in a standalone or USB connection or SPI connection modes as illustrated in Fig. 3.2. In the standalone mode, either one node or both nodes are operated on battery-powered and controlled by onboard ARM controller. The ranging information is displayed on the onboard LCD. In USB
Fig. 3.2: Mode of Operation of EVK-1000 Standalone vs USB connection [1]
Table 3.2: DW1000 Operating characteristics Channel
number
Centre frequency (MHz)
Bandwidth (MHz)
Preamble Codes (16 MHz PRF*)
Preamble Codes (64 MHz PRF*)
1 3494.4 499.2 1,2 9,10,11,12
2 3993.6 499.2 3,4 9,10,11,12
3 4492.8 499.2 5,6 9,10,11,12
4 3993.6 1331.2** 7,8 17,18,19,20
5 6489.6 499.2 3,4 9,10,11,12
7 6489.6 1081..6** 7,8 17,18,19,20 *Pulse Repitation frequency
23
(or SPI) connection, the ranging information is processed and manipulated in software that controls the radio chip.
•
Software
Personal Computer (PC) based DecawaveRanging® software provides alternate to the onboard ARM-based embedded software which offers additional configuration, controlling, data logging, and diagnostic features. The software enables the following DW-1000 radio’s capabilities to be observed, and tested:
General operation of the transceiver IC on the supported channels and modes provided in Table 3.2 as it sends and receives data frames.
LOS operations and range. The operational range can be checked by placing the receiver at various distances from the transmitter in LOS condition. This is tested in all supported channel modes as in Table 3.2.
NLOS operations and range. The operational range can be checked when various obstructions are between the receiver and the transmitter giving an NLOS channel. This is tested in all supported channels modes as in Table 3.2.
Time-of-Flight (TOF) Ranging Measurements: The software performs 2-way ranging between the two nodes, and estimates the distance between them based on the TOF calculations. The operation is checked in LOS and NLOS and effects are observed on the distance estimation under LOS and NLOS as the two nodes are moved nearer/further from each other, and when there are walls and other obstructions between the units. Moreover, the nodes are tested in all supported channel modes mentioned in Table 3.1 for three different supported data rates (i.e., 0.11, 0.85 and 8.5 Mbps). In the observations, the distances are recorded along with the following data:
Logging of CIR data under LOS and NLOS.
Logging of SPI activities.
24
3.3.
Scenarios for experimental setups
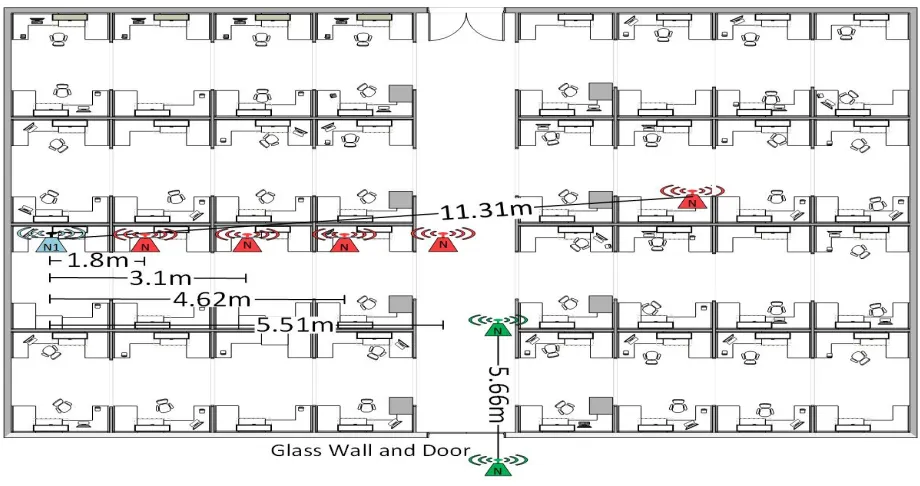
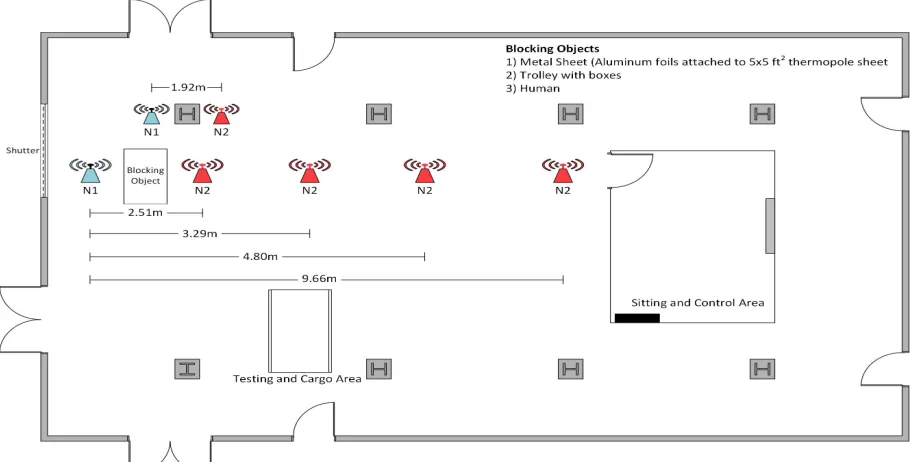
We collected measurements in two different environments, (i.e., Office and Warehouse). The locations of selected areas are inside the engineering building of the University of Windsor. In both environments, the nodes are placed on trapezoids to collect measurements as shown in Fig. 3.3 & 3.4. The LOS and NLOS scenarios are created by placing TX and RX nodes at different intervals between 1.92 m and 11.31 m. The NLOS scenarios are emulated using the signal wall, multiple walls, concrete, and metal pillars, glass wall, the human body and different objects (i.e., chairs, metallic parts, etc.). The NLOS obstructions in each scenario are summarized in Table 3.3. In all, there are 30 scenarios where 700 measurements of the parameters are collected. The characteristics of the two locations are different which are as follows.
3.3.1.
Office Scenario
Table 3.3: Scenarios (and their abbreviations) and Obstructions
Scenario Abbreviation Obstruction
Office 1 wall O1W One wall Office 2 wall O2W Two wall Office 3 wall O3W Three wall Office Multi-wall O4MW1 Multi wall Office Multi-wall O5MW2 Multi wall Office Glass OG1 Glass (clear) Office Glass OG2 Glass (Opaque) Warehouse 1 W1B1 Box
W1M1 Metal
W1M2 Metal (nodes @height 4 ft. from ground) Warehouse 2 W2H1 Human
W2M1 Metal
W2M2 Metal (nodes @height 4 ft. from ground) Warehouse 3 W3M1 Metal
W3T1 Trolley Warehouse 4 W4M1 Metal
W4M2 Metal (nodes @height 4 ft. from ground) W4T1 Trolley
25
Office setup has cubical spaces separated by wooden separators of 5 feet height. The office area is 30x20 meters square (m2). In the office, cubical spaces are created using wooden wall separation and concrete pillars. In each cubical space, desk, chair, and metal cabinet are placed. There are also glass walls that enclosed the area. The detail of nodes placement along with office floor plan are illustrated in Fig. 3.3.
3.3.2.
Warehouse Scenario
The dimension of the warehouse is 20x50 m2. In the warehouse, the area is designated as research and development for automobile engines and parts. It has metal pillars. The area is kind of open space with metal parts that mimic an industrial environment. The detail of nodes placement along with warehouse floor plan are illustrated in Fig. 3.4.
3.4.
Observations of different parameters in scenarios
3.4.1.
Received Signal Strength (RSS)
Instantaneous (Inst.) RSS is estimated in Decawave devices using [1]:
#CC ( DE) = 10 log JK(L)(M)N O − (3.1)
26
where C is the CIR magnitude, N is the preamble accumulation count, K is constant of 217, and A
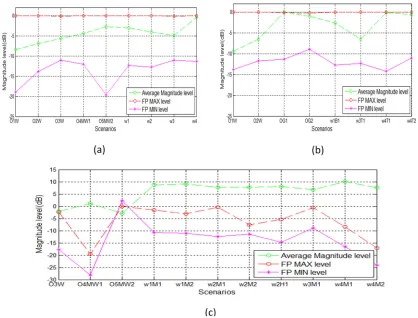
is a predefined constant of 115.72 dBm for a Pulse Repetition Frequency (PRF) of 16 MHz or -121.74 dBm for a PRF of 64 MHz . Probability density functions (PDFs) of RSS in LOS, soft NLOS (SNLOS) (i.e., in SNLOS direct path is the strongest path) and NLOS conditions are illustrated in Fig. 3.4(a). From the figure, it can be inferred that in LOS and SNLOS the RSS values are centered around 80 dBm. However, in the case of NLOS, RSS value is concentrated around -83 dBm. From the PDFs, it is obvious that RSS is decreased in NLOS conditions due to obstructions. As more severe the NLOS condition is the more power is lost due to the nature of obstruction and number of obstructions. Moreover, LOS and NLOS conditions can be identified based on RSS values as shown in Fig. 3.4 (a). However, in some cases where RSS decreased to -84 dBm in the case of SNLOS and LOS. Also in NLOS case, it increased to -80 dBm. The area is identified as a grey area, and the region is where misclassification occur for only based on inst. RSS value.
3.4.2.
First Path Signal Strength (FPSS)
Inst. FPSS is estimated using and two more CIR’s components (i.e., and ) followed by as [1]:
27
CC ( DE) = 10log J* P
QR QQR SQ.
Q − , (3.2)
From 3.1 and 3.2, inst. RSS and FPSS are correlated to each other as both are estimated using CIR values. So, FPSS exhibit similar to RSS in LOS, SNLOS, and NLOS as illustrated in Fig. 3.5(b). However, FPSS is also attenuated depend on first path attenuation factor (more detailed analysis and the relationship between RSS and FPSS will be discussed in Chapter 5).
3.4.3.
Rise time (RT)
RT is defined as the difference between the time occurrence of the strongest path in ℎ(U) ( ), denoted as VW and time occurrence of leading edge ( ), denoted asVP as given:
#V(6XYZ) = VW− VP, (3.3)
28
RT’s PDFs for LOS, SNLOS, and NLOS are given in Fig. 3.5 (c). From empirical PDF observation, it is obvious that strongest path is the first path in LOS and SNLOS cases as RT’s PDFs are concentrated on the lower side (i.e., between 2 to 6 ns) as illustrated in Fig. 3.5 (c). Whereas, in NLOS case, values are much higher (greater than 10 ns) because the strongest path in NLOS is not the first path.
3.4.4.
Average CIR normalized magnitude
It is estimated using CIR ℎ(U) normalized magnitudes as given:= 10 [\= ]∑b-cdefg^ _`(-)a
h, efg i, (4.1)
where U is the leading edge time at which the range is estimated based on Time of Arrival (ToA) technique, and j is the frame size in a nanosecond (ns) where discrete ℎ(U) presents. In the case of Decawave devices, W is 1016 ns [1].
29
3.4.5.
Leading Edge Normalized Magnitude
It is estimated using the first normalized magnitude above threshold (&) occurs in ℎ(U) at the time denoted as U (i.e., ℎ(U )). It is also called the first path (FP) minimum and its magnitude is computed as:
= 10 [\=_ℎ(U )a, (4.2)
3.4.6.
First Path Max Normalized Magnitude
It occurs in ℎ(U) either at the time: k = U + 1(ns) or at the time: k = U + 2(ns) , depends on which CIR’s magnitude level is higher (i.e., max|ℎ*UoP.,ℎ*UoQ.|).It is estimated as:
= 10 logpℎ*Uo-.q, (4.3)
where 1 ∈ r1 \< 2s.
The parameters’ (i.e., , , and ) average values in different scenarios are illustrated in Fig. 3.6. From the figure, has lower values in LOS and SNLOS compared to NLOS conditions. This is due to the strongest path in CIR’s ℎ(U) in LOS and SNLOS and all other multipath components (MPCs’) magnitudes in ℎ(U) are weak. Whereas in NLOS, the direct path (i.e., between TX and RX) is relatively weak and others MPCs are strong due to reflected, defracted and shadowed paths and direct path is partially or fully blocked by the obstruction. Due to this reason, has the strongest magnitude in LOS and SNLOS conditions and lower magnitudes compared to other MPCs in NLOS conditions.
30
3.5.
Summary
31
A
PARAMETRIC RULE
-
BASED CLASSIFICATION AND
LOCALIZATION ALGORITHM FOR
IR-UWB
4.1.
Introduction
Wireless Sensor Networks (WSNs) are deployed in indoor and dense environments where Global Positioning System (GPS) does not perform satisfactorily [14]. Therefore, indoor Real-Time Localization System (RTLS) is an optimum choice to support applications demanding location awareness in the WSN domain [21, 22]. There are many existing wireless systems that support indoor localization along with data communication. The most popular of these systems are WiFi, Zigbee, Bluetooth and IR-UWB [16, 42, 71]. Among them, IR-UWB is at the forefront of providing high-resolution localization [11]. Besides precision ranging, IR-UWB salient features such as through-wall propagation, low power consumption, size form factor, and many other salient features bode well for WSN [16, 55]. However, the localization accuracy of IR-UWB degrades when they operate under NLOS conditions which are inherent in wireless communications with real-time deployments [5, 40]. Due to NLOS conditions, ranging errors increase significantly compared with LOS conditions.
32
range mitigation algorithm is developed based on the assumption of having only one anchor-agent in NLOS condition. Furthermore, a probabilistic model is also presented to show simultaneously one anchor node out of three is the most likely in NLOS condition. The model justifies that the assumption of one anchor in NLOS in the ranging algorithm. The proposed classification and mitigation algorithm has low complexity and computational requirements while enhancing the position accuracy under NLOS condition without adding the delay in range acquisition.
The chapter is organized as follows: Section 4.2, discusses the classification of LOS and NLOS. Section 4.3, describes the probabilistic model, and a ranging algorithm. Experimental measurements and scenarios are presented in Section 4.4. Section 4.5, introduces the proposed algorithm and its performance and finally, the conclusions are provided in Section 4.6.
4.2.
Classification of LOS and NLOS
4.2.1.
Salient features in LOS and NLOS
From the preceding chapter explained that normalized MPCs are stronger in NLOS compared to LOS. Also, the strongest MPC is observed followed by leading edge of MPC in the first path in LOS condition. In addition to leading edge, two more MPC components constitute the first path (or the direct path) [1]. However, in NLOS condition the phenomena do not exhibit. Moreover, overall received power and first path power are attenuated in NLOS due to obstructions between the TX and RX and multipath propagation of the transmitted signal. Based on the parameters and channel magnitudes observations in the preceding chapter, following parameters are supportive in the identification of LOS and NLOS: Average CIR normalized magnitude, leading edge
TABLE 4.1:PARAMETERS OBSERVATIONS IN LOS AND NLOS
S. No. Observation LOS NLOS
P1 = 1 < 1
P2 Relationship between and µ ≤ µ >
P3 Relationship between and x yz ≤ x yz >
P4 Relationship between and yz ≤ yz >
P5 RT #V ≤ 6 ns #V > 6 ns
33
magnitude, the first path max magnitude, rise time, received signal strength (RSS), and the received first path’s power.
4.2.2.
Classification Methodology
Through extensive experiments in different scenarios in two different conditions (i.e., LOS and NLOS), observations regarding parameters are summarised in Table 4.1. The multiplier constants (i.e., µ and β) values are found experimentally which are 8 and 10 respectively. In addition to the observations, combining two or more observations for identifying the conditions is more effective and reduce false alarms (for classification) rather than using sole observation for identification. The observations’ combination is called rules, and the particular combination is based on the following facts:
•Combination-1: P2 & P3
The combination is based on observations 2 & 3 (i.e., P2 & P3) from Table 4.1
Average magnitude of CIR(tells the no. of Multipath)
First path max. magnitude (tells the strength of the first path in LOS or NLOS)
First path min. magnitude (critical for range estimation in ToA algorithm)
Combination is based on CIR magnitudes
•Combination-2: P4 & P5
The combination is based on observations 4 & 5 (i.e., P4 & P5) from Table 4.1
TABLE 4.2: IDENTIFICATION RULES FOR LOS/NLOS
Identification Rule# 1 (R1)
Rule# 2 (R2)
Rule # 3 (R3)
Combination Logical Operation
Rule Logic
LOS µ ≤ x
≤ 1 R1&R2 TRUE(1)
LOS ≤ #V ≤ 6 2 R1&R2 TRUE(1) LOS x ≤ #CC ≥ −82.5 3 R1&R2 TRUE(1) LOS #V ≤ 6 #CC ≥ −82.5 ∆ ≤ 7 4 R1&R2&R3 TRUE(1) NLOS µ > x≤ 1 R1&R2 FALSE(0) NLOS > #V > 6 2 R1&R2 FALSE(0) NLOS x
> #CC < −84.5 3 R1&R2 FALSE(0)
34
Average Magnitude
First path min. magnitude
Rise time (tell where in time span max. path occurs in CIR)
•Combination-3: P3 & P6
The combination is based on observations 3 & 6 (i.e., P3 & P6) from Table 4.1
Average magnitude
First path min. magnitude
Received power strength (tells how strong overall signal is)
•Combination-4: P5, P6 & P7
The combination is based on observations 5, 6 & 7 (i.e., P5, P6 & P7) from Table 4.1
Based on the received signal and the first path. The relationship holds well in mild NLOS conditions
Received signal strength exhibit differently in sever NLOS conditions
Does not require whole CIR data within the frame (i.e., 1016 data samples)
The above combinations are logically combined using AND operation for classification. Due to the fact that all parameters within particular combination are within a specific threshold (which are defined in Table 4.1) for LOS and logically true for LOS condition; that’s why AND operation is appropriate. Truth Table for all the combinations along with the classification of LOS and NLOS are summarized in Table 4.2.
4.3.
Range Mitigation Methodology
After classification, geometric range correction of one anchor-agent pair out of three is presented. First, one out of three anchor-agent pair’s channel condition is in NLOS most probable occurrence analysis is presented. Second, the range correction of the pair method is presented.
![Fig. 2.1: Different Methods for estimating leading edge based on energy detection [4]](https://thumb-us.123doks.com/thumbv2/123dok_us/1356855.1168514/29.612.109.512.90.249/fig-different-methods-estimating-leading-based-energy-detection.webp)
![Fig. 2.2: Ranging error variation in LOS and NLOS conditions [3]](https://thumb-us.123doks.com/thumbv2/123dok_us/1356855.1168514/34.612.162.456.90.327/fig-ranging-error-variation-los-and-nlos-conditions.webp)
![Fig. 3.1: EVK-1000 kit EVB-1000 nodes[1]](https://thumb-us.123doks.com/thumbv2/123dok_us/1356855.1168514/40.612.81.533.463.680/fig-evk-kit-evb-nodes.webp)
![Fig. 3.2: Mode of Operation of EVK-1000 Standalone vs USB connection [1]](https://thumb-us.123doks.com/thumbv2/123dok_us/1356855.1168514/41.612.85.533.555.694/fig-mode-operation-evk-standalone-vs-usb-connection.webp)