ABSTRACT
ALSABBAGH, AHMAD HESHAM. Effect of Neutron Irradiation on Mechanical Behavior of Ultra-Fine Grained Low Carbon Steel – Application to Next Generation Fission Reactors. (Under the direction of K.L Murty).
Designing materials that can enhance performance and withstand extreme reactor
operational conditions is a grand challenge in nuclear materials research. Irradiation induced
defects result in embrittlement and hardening of reactor structural materials. Hence, the
ability to mitigate the effects of radiation damage by removing in-situ radiation induced point
defects is crucial to improving the mechanical properties of irradiated metals and enhancing
their tailored response in irradiation environments. Ultra-fine grained steel provides large
free surface to volume ratio, acting as sinks for migrating irradiation induced point defects.
Annihilation of point defects at grain boundaries leads to lower net defect concentration in
the grain interior compared to coarser grained counterpart thereby limiting radiation damage
effects and resulting in enhanced radiation tolerant structural materials.
Neutron irradiation effects on ultra-fine grain (UFG) low carbon ferritic steel
prepared by equal channel angular pressing (ECAP) have been examined. Counterpart
samples with conventional grain (CG) sizes were prepared by annealing at high temperatures
and have been irradiated alongside with the UFG ones for comparison. Samples were
irradiated in the PULSTAR reactor at North Carolina State University to relatively low dose
(0.001 dpa) and in the Advanced Test Reactor (ATR) at Idaho National Laboratory (INL) to
1.37 dpa.
Low dose irradiation of ultrafine grained carbon steel revealed minute radiation
counterpart. At higher irradiation dose, atom probe tomography revealed manganese and
silicon-enriched clusters in both UFG and CG steel after neutron irradiation. X-ray
quantitative analysis showed that dislocation density in CG steel increased after irradiation
while no significant change was observed in UFG steel, revealing better radiation tolerance.
Quantitative correlations between experimental results and modeling were demonstrated
based on irradiation induced precipitate strengthening and dislocation forest hardening
© Copyright 2014 Ahmad Alsabbagh
Effect of Neutron Irradiation on Mechanical Behavior of Ultra-Fine Grained Low Carbon Steel – Application to Next Generation Fission Reactors
by
Ahmad Hesham Hasan Alsabbagh
A dissertation submitted to the Graduate Faculty of North Carolina State University
in partial fulfillment of the requirements for the degree of
Doctor of Philosophy
Nuclear Engineering
Raleigh, North Carolina
2014
APPROVED BY:
_______________________________ ______________________________ Dr. K.L Murty Dr. Jacob Eapen
Committee Chair
ii DEDICATION
To the person whom I miss a lot. To the soul of my father Hesham who provided me with the
enthusiasm and motivation to get this work done.
iii BIOGRAPHY
Ahmad Alsabbagh was born in Amman, Jordan in 1985. He received his Bachelor of
Science degree in Electrical Engineering in 2008 from University of Jordan, Amman, Jordan.
In 2009, he started his graduate studies in the Nuclear Engineering department at North
Carolina State University, Raleigh, NC, USA. In 2011, he received his Master degree in
Nuclear Engineering. Then, he directly joined Prof. K.L Murty’s research group to pursue his
iv ACKNOWLEDGMENTS
I would like to thank my PhD advisor Prof. K.L Murty for his continuous supervision
and support throughout this dissertation. I am deeply obliged for his patience to train me how
to investigate, present and publish scientific research. The training and guidance under Prof.
Murty has reinforced my decision to explore my future as an academic researcher.
I would like to extend my gratitude to my PhD advisory committee members: Prof.
Jacob Eapen, Prof. Mohamed Bourham, and Prof. Ronald Scattergood for their invaluable
time and encouraging remarks.
This research was supported by the Advanced Test Reactor National Scientific User
Facility (ATR-NSUF). I would like to acknowledge Prof. Ruslan Valiev of Ufa State
Aviation Technical University for providing the UFG steel samples. I also want to thank the
PULSTAR reactor staff at North Carolina State University, Mr. Scott Lassell, Mr. Gerry
Wicks, Mr. Andrew Cook and Mr. Kerry Kincaid, for their assistance throughout the work of
this dissertation. I would like also to express my sincere thanks to the Advanced Test Reactor
(ATR) user facility team, Dr. Douglas Porter, Dr. Brandon Miller, Ms. Mary Catherine, Mr.
Collin Knight, Dr. Leah Squires and Dr. James Cole for their valuable support during my
experimental work at Idaho National Laboratory. I am also grateful, to the Center for
Advanced Energy Studies (CAES) staff, Ms. Joanna Taylor and Ms. Jatu Burns for their help
in testing the irradiated samples. I am grateful for the friendship and technical advices from
the past and present colleagues, Dr. Walid Mohamed, Boopathy Kombaiah, Dr. Apu Sarkar,
v Finally, I would like to express my appreciation and thanks to my parents for their
continuous help and support, and to my brothers and sisters who supported and helped me
throughout my graduate studies. This work would never have been completed without the
vi
TABLE OF CONTENTS
LIST OF TABLES ... viii
LIST OF FIGURES ... ix
Chapter 1. Introduction ... 1
Chapter 2. Background ... 7
2.1 Neutron Radiation Damage in Materials ... 7
2.1.1 Radiation Defects Induced by Intense Nuclear Radiation ... 9
2.2 Irradiation Effects on Reactor Pressure Vessel Ferritic Steels ... 12
2.3 UFG Materials Processed by ECAP ... 15
2.4 Irradiation Effects on Nano and Ultra-Fine Grained Materials - Literature Review 19 2.4.1 Reduced Defect Density ... 20
2.4.2 Irradiation Induced Amorphization ... 24
2.4.3 Irradiation Induced Recrystallization Processes ... 26
2.4.4 Computer Simulations Studies ... 31
Chapter 3. Materials and Irradiation Experiments ... 35
3.1 Materials and Sample Perpetration ... 35
3.1.1 ECAP Imposed Strain Calculations ... 39
3.2 Irradiation Experiments ... 42
3.2.1 Fast Neutron Spectrum Determination for the dpa Calculations ... 42
3.2.1.1 Foil Activation Technique ... 46
3.2.2 PULSTAR Irradiation Experiment ... 54
3.2.2.1 PULSTAR Experimental Characterization Methods ... 57
3.2.3 ATR Irradiation Experiment ... 58
3.2.3.1 ATR Experimental Characterization Methods ... 62
Chapter 4. Microstructural Characteristics ... 68
4.1 Grain Size Distributions ... 68
4.2 Irradiation Induced Defects ... 73
4.3 Irradiation Enhanced Segregation ... 78
4.4 Irradiation Induced Clustering ... 83
Chapter 5. Mechanical Properties ... 90
5.1 Irradiation Induced Hardening and Embrittlement ... 90
5.1.1 Vickers Micro Hardness ... 90
5.1.2 Nano Hardness ... 91
5.1.3 Tensile Test ... 95
5.2 Hardening Mechanisms ... 100
Chapter 6. Conclusions and Future Work ... 104
6.1 Summary and Conclusions ... 104
6.2 Future Work ... 105
References ... 107
Appendices ... 117
viii
LIST OF TABLES
Table 2.1: Number densities of I-loops and voids in coarse grain pure tungsten and UFG
tungsten alloys after neutron irradiation at 600 °C to 2×1024n/m2. ... 24
Table 3.1: The chemical composition of the steel material (weight percent). ... 36
Table 3.2: Characteristics of threshold reactions [90–92] ... 52
Table 3.3: Decay properties of the 152Eu standard source [91]. ... 53
Table 4.1: Mean grain size (μm) for both UFG and CG steel pre and post irradiation. ... 72
Table 4.2: Values of domain size (Ds), microstrain ( 2 1 2 L e ) and dislocation density (ρ) for different samples obtained by Modified Rietveld analysis. ... 77
Table 5.1: Tensile data for CG steel before and after irradiation to different doses. ... 97
Table 5.2: Tensile data for UFG steel before and after irradiation to different doses. ... 97
Table 5.3: Estimated strength increment for both UFG and CG steels. ... 103
ix
LIST OF FIGURES
Figure 1.1: Light bulbs lit by the world's first electricity generated from nuclear power [2]. .. 5
Figure 1.2: Overview of the generations of nuclear energy systems [5]. ... 5
Figure 1.3: Temperature-neutron dose for various Gen IV reactor systems. The six Gen IV fission systems are: Very High Temperature Reactor (VHTR), Super Critical Water Reactor (SCWR), Lead Fast Reactor (LFR), Gas Fast Reactor (GFR), Sodium Fast Reactor (SFR), and Molten Salt Reactor (MSR) [10]. ... 6
Figure 2.1: Schematic of radiation damage event. Incident energetic particle hits the target material atoms (a) giving birth to PKA (b) which will be displaced and collide with other atom and cause it to be displaced (SKA) (c) displaced atoms will passage through the lattice causing additional knock-on atoms (d) finally radiation induced point defects (vacancy and interstitials) will be produced (e) [Adopted from T. Allen presentation]. ... 8
Figure 2.2: Fuel bin bundles irradiated at Fast Flux Test Facility (FFTF) to 75 dpa. While HT9 shows no swelling (a), D-9 austenitic clad exhibits pin-to-pin variations caused by swelling (b) [13]. ... 11
Figure 2.3: Calculated source and friction hardening components of yield stress as a function of the square-root of neutron fluence in mild steel [28]. ... 11
Figure 2.4: Radiation induced segregation at grain boundary of irradiated stainless steel [30]. ... 12
Figure 2.5: New pressure vessel that failed during its hydrostatic test following its fabrication.[37]... 14
Figure 2.6: Charpy impact energy-temperature plots for the unirradiated and irradiated KS-01 weld (0.37 wt.% Cu, 1.23 wt.% Ni) [38]. ... 15
Figure 2.7: Schematic illustration of the passage of a sample through the die in ECAP technique. ... 18
Figure 2.8: Schematic illustration of a typical ECAP facility (a) and the rotational scheme of the four processing routes in ECAP (b).[45, 48] ... 18
Figure 2.9: Void volume swelling in electron irradiated austenite stainless steel at different doses and grain sizes [53]. ... 20
x Figure 2.11: Electrical resistivity change in irradiated nano and coarse grain gold samples as a function of irradiation dose [55]. ... 23
Figure 2.12: Vickers microhardness as a function of neutron irradiation fluence for different grain size Stainless steel (a), Ni and Ni ̶ W materials (b) [57]. ... 24
Figure 2.13: XRD profiles of CG TiNi (a) and NC TiNi (b) before and after the irradiation. 26
Figure 2.14: Grain size distribution for nanostructured 316 stainless steel, as deformed, after annealing at 350 °C for 24 h and after ion irradiation at 350 °C irradiation temperature [70]. ... 28
Figure 2.15: Bright field TEM images of the Au, Pt, and Cu films in the initial state and after irradiation by Ar ions (gold and platinum) and Kr ions (copper) at different doses at room temperature [71]. ... 29
Figure 2.16: Average grain size vs ion irradiation dose. Experimental data vs model at low irradiation temperatures. Pt irradiated with Ar 500 keV ions at 298 K; Pt irradiated with 1 MeV Kr ions at 50 K and 298 K; Zr irradiated with 500 keV Kr ions at 20 K; Cu irradiated with 500 keV Kr ions at 50 K; and Au irradiated with 500 keV Ar ions at 50 K [71]. ... 30
Figure 2.17: Grain size distributions for UFG Ni before (red) and after (blue) proton irradiation at room temperature [56]. ... 31
Figure 2.18: Temperature accelerated dynamics (TAD) simulation snap shots for the radiation damage cascade at 300 K in copper at different time intervals to follow the defect kinetics. It shows the damage self-healing near the grain boundary. Black small spheres represent the lattice atoms before irradiation, green spheres are interstitial atoms, red cubes are vacancies, blue spheres are atoms that moves more than 1Å during an event, purple vectors represent the direction of moving atoms and the two horizontal lines in all the snap shots represent the grain boundary [77]. ... 34
Figure 3.1: Transmission electron microscopy (TEM) micrograph showing the grin size distribution for UFG steel (d= 0.35±0.18 μm) (a) and electron back scattered diffraction (EBSD) micrograph for CG Steel (d= 4.4±1.8 μm) (b). ... 37
Figure 3.2: Vickers micro-hardness as a function of one hour annealing temperature. ... 37
Figure 3.3: Pre irradiation sample geometries for both UFG and CG steels. ... 38
Figure 3.4: Photographs of low carbon steel mini tensile sample (a) and tensile test grips (b). ... 38
xi Figure 3.6: Imposed strain due to 4 passes through the die versus the inner contact angle (Φ) between channels of the die (a). Schematic of ECAP die showing the inner contact angle (Φ) and the arc of curvature angle (Ψ) at the outer point of contact between channels of the die (b). ... 42
Figure 3.7: Comparison of yield stress change in 316 steel following irradiation in three different facilities [81]. ... 45
Figure 3.8: Cross sections for threshold reactions of interest [87]. ... 53
Figure 3.9: Calculated HPGe detector efficiency vs. gamma energies. ... 54
Figure 3.10: PULSTAR reactor (a) and the irradiation position in the PULSTAR reactor core (b). ... 56
Figure 3.11: Sample irradiation loading. Sealed quartz tube (a), Aluminum irradiation jig (b) and Aluminum irradiation stringer (c) lined with Cadmium layer (d). ... 56
Figure 3.12: Experiment irradiation test assembly for ATR east flux trap position (a) and radial cross section view of the ATR reactor core, E-7 irradiation test position (b). ... 60
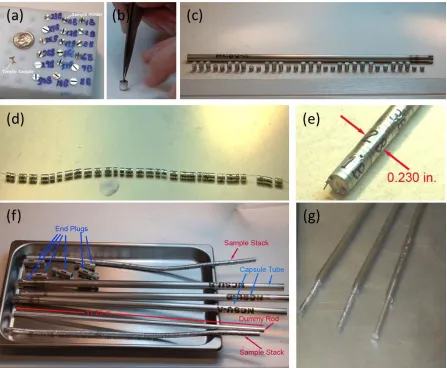
Figure 3.13: Sample holder, sample train and irradiation capsule loading and design. ... 61
Figure 3.14: Sample irradiation temperature calculated by a detailed finite element model of the experiment using ABAQUS code. ... 61
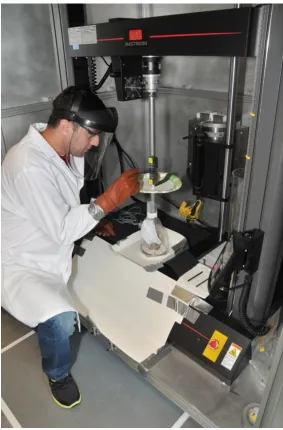
Figure 3.15: Tensile test for radioactive steel samples conducted at Center for Advanced Energy Studies (CAES) using Instron machine. ... 66
Figure 3.16: Needle-shape atom probe specimen geometry preparation using the focused ion beam technique. ... 67
Figure 4.1: TEM bright field micrographs for UFG steel before irradiation (a), after irradiation to 0.001 dpa (b), and after irradiation to 1.37 dpa (c). ... 70
Figure 4.2: TEM dark field micrographs for UFG steel before irradiation (a), after irradiation to 0.001 dpa (b), and after irradiation to 1.37 dpa (c). ... 70
Figure 4.3: Optical micrographs for CG steel before irradiation (a) and after irradiation to 0.001 dpa (b). ... 71
xii Figure 4.5: Grain size distributions of UFG steel (a, b, c) and CG steel (d,e,f) before and after irradiation to different doses. ... 72
Figure 4.6: TEM micrographs of CG steel unirradiated (a), CG steel irradiated to 0.001 dpa (b), CG steel irradiated to 1.37 dpa (c), UFG steel unirradiated (d), UFG steel irradiated to 0.001 dpa (e) and UFG steel irradiated to 1.37 dpa (f). ... 75
Figure 4.7: Typical two beam condition diffraction pattern used to observe the defects; same condition was used for all cases. ... 75
Figure 4.8: XRD profiles for unirradiated and irradiated (1.37 dpa) UFG and CG steels... 76
Figure 4.9: Whole XRD pattern fit for irradiated CG steel at dose 1.37 dpa using LS1 program. ... 77
Figure 4.10: Representation of three-dimensional reconstruction of UFG steel, (a) before and (b) after neutron irradiation by three-dimensional (3D) atom-probe microscopy. ... 80
Figure 4.11: Representation of three-dimensional reconstruction of conventional grained steel, (a) before and (b) after neutron irradiation by three-dimensional (3D) atom-probe microscopy. ... 81
Figure 4.12: Irradiation enhanced segregation at grain boundaries in UFG steel. ... 82
Figure 4.13: Post irradiation atomic arrangements around carbide precipitate in UFG steel. Atom concentrations inside the selected cylinder are shown in the right. ... 83
Figure 4.14: Comparison between random distribution of solutes in the matrix and the data obtained for both unirradiated (left) and irradiated CG steel (similar results were obtained from all the examined specimens for both CG and UFG steels). ... 86
Figure 4.15: Schematic showing the maximum separation method: (a) and (b) solute atom selection (the core atoms); (c) and (d) selection of other atoms within a distance L of the core atoms; (e) and (f) erosion of atoms within a distance E of any other atom. Selected solute atoms are shown black, selected matrix atoms are shown hatched, not selected solute atoms are drawn grey and non-selected matrix atoms are shown white [110]. ... 87
Figure 4.16: Si-Mn-enriched cluster distribution post neutron irradiation for (a) CG and (b) UFG steel. The dimension of the analysis boxes is 20X20X100 nm. ... 88
Figure 4.17: Size distribution of Si-Mn- enriched precipitates in the neutron irradiated (a) UFG and (b) CG steels. ... 89
xiii Figure 5.2: Load versus displacement for the 150 mN peak load experiment. Both UFG and CG steel were irradiated to 1.37 dpa. ... 93
Figure 5.3: Nano hardness versus load for irradiated (1.37 dpa) and un-irradiated UFG and CG steels. ... 94
Figure 5.4: SEM images of nano indents at 210 mN for (a) Un-Irr CG (b) Irr-CG (c) Un-Irr UFG (d) Irr-UFG (1.37 dpa) low carbon steel. ... 94
Figure 5.5: Engineering stress-strain curves for both steels (UFG and CG) before and after irradiation to different doses. ... 98
1
Chapter 1.
Introduction
Energy is essential to economic development and improved quality of life. Nuclear
energy is considered to be a relatively sustainable energy source that can provide clean (no
carbon dioxide emissions) and economically efficient electric power. Nuclear reactors are
capable of producing large amounts of power without the adverse environmental effects that
accompany the use of coal or petroleum products. Although renewable energy sources (ex:
wind, solar, water fall, etc) are also clean energy sources, limitations on their economic
efficiency and reliability when used for base-load power generation are well recognized [1].
Electricity was generated for the first time using nuclear fission on December 20, 1951, and
lit four 200-watt light bulbs (Figure 1.1) at the Experimental Breeder Reactor (EBR-I) at
Idaho, USA [2]. However, in 1954 [3] the Union of Soviet Socialist Republic (USSR) built
the world's first nuclear power plant to generate electricity for a power grid. In 1957 [4] the
US had their first commercial nuclear power plant (Shippingport Reactor in Pennsylvania) to
provide electrical energy to commercial grid. Since then the nuclear energy became a major
contributor in producing the world electricity. During the past six decades reactors have been
developed and improved. Nuclear reactor designs are usually categorized by “generation”
(ex: I, II and III) based on their utilized technology and safety margins. Current operating
reactors are considered second or third generation (Figure 1.2 [5]). At the beginning of 2014
there were 435 operating nuclear power reactors, operating in 31 countries [6]1. The
maximum number of operating reactors is located in North America region with 119 reactors
2 (100 USA, 19 Canada) while only 2 reactors are in Africa (South Africa). The most
predominant design is pressure water reactor (PWR) with 274 reactors in operation around
the world. The second type of existing reactors is the boiling water reactors (BWR) with 81
operating units. The remaining operating reactors are divided between pressurized heavy
water reactors (PHWR), gas-cooled graphite-moderated reactor (GCR), light-water-cooled
graphite-moderated reactor (LWGR) and fast breeder reactors (FBR). Seventy two reactors
are currently under construction and they are distributed in 16 countries around the world.
The age of a reactor is determined by its first grid connection. Seven reactors are considered
the oldest reactors in operation, with 45 years of operation (first connected to the grid in
1969). Three of those forty five years old reactors are located in USA, two in India, one in
Switzerland and one in Japan. Aging of reactors is defined by the International Atomic
Energy Agency (IAEA) as a continuous time-dependent loss of quality of materials, caused
by the reactor operating conditions [7]. After operating for long periods, nuclear structural
materials will encounter gradual changes in their microstructures and mechanical properties
causing them to not perform as expected leading to degradation in their performance
capabilities [8].
In order to meet world-wide demand for energy, the concept for the next generation
reactors was proposed. In year 2000, the US Department of Energy (DOE) launched the
Generation-IV (Gen IV) initiative with international participation to expand nuclear energy
and provide improved safety, economy and sustainability of the nuclear power plant systems
[9]. Gen IV reactors will operate at higher temperatures, stresses, irradiation levels and in
3 shows the irradiation dose and temperature limits for diverse Gen IV proposed nuclear
systems, and it demonstrate an overview of the severe operation conditions (in terms of
operational temperature and displacement damage dose) for Gen IV compared to current
generation reactors (generation II). Structural materials for advanced reactors like Gen IV
reactors need to be capable of withstanding the severe operation conditions for those reactors
without failure [11], and high performance materials will be critical for the success of those
proposed reactors. Designing materials for those next generation reactors poses greater
challenges because of the extreme operating conditions which require development of new
materials more tolerant to those conditions. Progress is also required to further our
understanding of materials for existing systems which will be considered as the bedrock for
next generation reactors [12]. There are many requirements for reactor structural materials,
and they differ based on the function of the material in the reactor. Along with materials’
availability, affordability and adequate fabrication and joining properties, neutronic
properties such as low absorption cross section for cladding materials need to be considered.
Elevated temperature mechanical and thermal properties are crucial for reactor structural
materials especially for future next generation reactors that will operate at high temperatures.
Since materials for those proposed reactors will also exhibit high irradiation doses, resistance
to irradiation-induced property changes is required [13].
The lifetime assessment of advanced nuclear structural materials requires an
understanding of their behavior in a range of scales. Irradiation effects, mechanical properties
and fracture mechanisms of advanced materials need to be considered. Experimental and
4 conditions of the advanced nuclear systems. While simulations address the long term
behavior and provide fundamental understanding of advanced materials [14], experimental
data will mimic the real environment that the materials will encounter during operation to
understand the effect of neutron irradiation in reactor components. Current reactor materials
are not expedient to be used for the new advanced reactors, and new concepts in materials
design are needed to produce materials that are more radiation tailored and can sustain high
amount of radiation damage while maintaining their mechanical properties.
Nanocrystalline (NC) and ultra-fine grained (UFG) materials have opened a new and
fascinating path for research due to their unique and extraordinary properties [15, 16]. Large
grain boundary area density provides free surfaces that attract, absorb and annihilate
radiation induced defects [17, 18] thereby reducing radiation damage in the irradiated
materials. In this dissertation, I studied the neutron irradiation damage in UFG ferritic low
carbon steel and the consequent effects on their microstructural and mechanical properties.
Irradiation experiments were performed at different doses; 0.001 dpa in PULSTAR reactor at
North Carolina State University and 1.37 dpa in ATR reactor at Idaho National Laboratory.
Post irradiation examinations were conducted in the nuclear materials laboratories at North
Carolina State University (NCSU), Center for Advanced Energy Studies (CAES) and nuclear
5 Figure 1.1: Light bulbs lit by the world's first electricity generated from nuclear power [2].
6 Figure 1.3: Temperature-neutron dose for various Gen IV reactor systems. The six Gen IV fission systems are: Very High Temperature Reactor (VHTR), Super Critical Water Reactor
7
Chapter 2.
Background
2.1
Neutron Radiation Damage in Materials
Neutrons produced in reactors by fission reaction have a high average energy (2 Mev)
and can cause a severe damage in the reactor structural materials. Collisions of incoming
neutrons with atoms in the crystal lattice of the target material cause part of the neutron
energy to be transferred to the target atoms. If the transferred energy is higher than the
displacement threshold energy of the target atom (~40 eV for steel [19]), the atom will be
displaced from its lattice position giving birth to the primary knock-on atom (PKA). The
PKA can induce subsequent lattice site displacements of other atoms (known as secondary
knock-on atoms) if it possesses sufficient energy, or come to rest in the lattice at an
interstitial site if it does not (Figure 2.1) thereby creating a Frenkel defect pair. This process
continues creating a displacement cascade [20]. Materials’ damage caused by irradiation
consists of interstitials and vacancies (point defects). Interstitial is an atom that is located in a
non-regular lattice site while vacancy is a missing lattice atom. Because of the thermal
motion of the atoms in the lattice, self-annealing of the damage will take place and most of
the radiation induced damage (about 80% [21]) will be annihilated by recombination between
the vacancies and interstitials. However, the point defects which survive and stay in the
matrix will give rise to significant changes in the microstructural and mechanical properties
of the irradiated material. Depending on material, temperature and dose rate, excess
vacancies and interstitials can be created at several orders of magnitude above thermal
8 tries to move back to equilibrium. Defects can be removed in a number of ways:
recombination, diffusion to surfaces, diffusion to particles or precipitates, diffusion to grain
boundaries or cluster formation. However, neutrons have no charge and thus they are not
affected by the electric fields surroundings the atomic nuclei and can travel for a long
distance inside the target material, therefore the resultant irradiation damage is not localized
but distributed through the solid.
Figure 2.1: Schematic of radiation damage event. Incident energetic particle hits the target material atoms (a) giving birth to PKA (b) which will be displaced and collide with other atom and cause it to be displaced (SKA) (c) displaced atoms will passage through the lattice
9 2.1.1 Radiation Defects Induced by Intense Nuclear Radiation
In nuclear applications, fission fragments and neutrons cause the bulk of the radiation
damage since they have enough energy to cause displacements and are produced in sufficient
number density to cause radiation damage. As explained earlier, the interactions between
incoming energetic particles and material crystal lattice give rise to point defects (vacancies
and interstitials). However, if large number of vacancies clusters together, it will result in
“depleted zones”. Vacancy clusters can grow by absorbing other vacancies, and the resulting
large vacancy clusters are called voids [22]. Voids are volume defects (3D) that have a
profound influence on materials properties since they affect the density of the material. Voids
will be more severe when they are filled by an inert gas which stabilizes it. Helium is a
common inert gas that is produced by transmutation reactions in reactor structural materials
such as Nickel (59Ni+1n→56Fe+4He). When the He fills the void it becomes stable, and it
cannot be annealed out, so it becomes a permanent defect. Those voids that are stabilized by
inert gas are called cavities or bubbles [23]. Cavities lead to volume expansion and decrease
in the material density; this phenomenon is known as irradiation induced swelling [24]. If
irradiation induced swelling continued to increase with fluence, then large increases in the
size of the reactor structural materials could be expected, leading to catastrophical results.
Some materials are more affected by swelling than others (Figure 2.2). However, irradiation
induced swilling depends on irradiation temperature, dose, material composition and
10 Moreover, irradiation also induces line defects (1D, ex: dislocations), planer defects
[25] (2D, ex: dislocation loops) and volume defects [26] (3D, ex: precipitates or solute
clusters) that will affect the microstructure of the irradiated material and consequently
influence its physical and mechanical properties [19]. Interactions between dislocations
themselves (forest strengthening) or dislocations and other volume defects impede the glide
of those dislocations through the crystallite, increasing the stress needed for plastic
deformation (friction hardening). However, radiation damage can also affect the stress
required to start the dislocation motion on its glide plane (source hardening) [27]. Figure 2.3
illustrates the different effects of neutron irradiation on the two components that comprise
yield stress in mild steel. While the friction stress follows the square root dependence, the
source hardening decreases as neutron radiation fluence increases, because impurity atoms
get attracted to radiation produced defects leading to reduced net concentration of interstitial
atoms in solution available for locking the dislocation sources (this trend is opposite to that
expected in fcc metals) [28].
Irradiation produces fluxes of point defects near surfaces, dislocations, grain
boundaries and other defect sinks, different atomic species in irradiated alloys move at
different rates and in different directions in response to these point defects (toward sinks or
away from them). Enrichment or depletion of each element occurs according to the relative
interaction of each element with the defect flux. Segregation of alloys elements leads to
changes in alloys local compositions and can degrade the integrity of structural reactor
materials. Figure 2.4 shows radiation induced segregation profile for different elements of
11 Irradiation damage causes different effects in the microstructural, mechanical and
physical properties of the irradiated materials, books by Was [19], Olander [20] and Murty et
al. [29] introduce these effects and illustrate their consequences on the materials integrity.
Figure 2.2: Fuel bin bundles irradiated at Fast Flux Test Facility (FFTF) to 75 dpa. While HT9 shows no swelling (a), D-9 austenitic clad exhibits pin-to-pin variations caused by
swelling (b) [13].
12 Figure 2.4: Radiation induced segregation at grain boundary of irradiated stainless steel [30].
2.2
Irradiation Effects on Reactor Pressure Vessel Ferritic Steels
Ferritic steels have been used widely as structural materials in light water reactors,
but they suffer from irradiation hardening and embrittlement accompanied by increased
ductile to brittle transition temperature (DBTT) and decreased upper shelf energy [27].
Previous studies have shown that major factors affecting low carbon steels under neutron
irradiation are neutron fluence, irradiation temperature and chemical composition [31]. Due
to their adequate mechanical properties and relatively low cost, ferritic steels are usually used
to construct the reactor pressure vessel (RPV). The RPV serves as both a pressure and
containment barrier for the radioactive fission products produced during the nuclear fission
13 reactor component so if it’s mechanical properties degrade sufficiently, this means the end of
the reactor life. The thickness of the vessel is about 20 cm with interior lined by a thin layer
(5 ̶ 10 mm) of an austenitic stainless steel to provide corrosion resistance to the reactor
coolant [32]. Intensive studies have been conducted on the RPV steel to ascertain that the
vessel will not fracture under any possible circumstances. Figure 2.5 shows a pressure vessel
that failed during hydrostatic testing (this is not due to irradiation but it shows the
catastrophic results that may occur if the pressure vessel steel fails). Since the RPV is
relatively far from the reactor core, the fast neutron flux is three to four orders of magnitude
lower at the RPV compared to core internal structures (For most Western-type light water
reactor (LWR) pressure vessels, the flux of neutrons with energy higher than 1 MeV at the
irradiation peak location of an RPV is around 1010 n.cm-2.s-1 while it is 6×10¹³ n.cm-2.s-1 for
reactor internal structures) [33]; however, it is still of sufficient intensity to induce changes in
the properties of ferritic steels. In order for the reactor license to be renewed, the integrity of
the RPV steel needs to be assured. Thus the reactor vessel surveillance program (RVSP) was
initiated to provide the needed data to examine the adequacy of the RPV steel for
maintaining its purpose. When the reactor is designed and built, samples from different
locations of the RPV steel were added to an irradiation capsule known as “Surveillance
Capsule” which was loaded relatively close to the reactor core (closer than the RPV) to
ensure that the surveillance samples will reach higher damage level than the RPV steel itself.
Material specimens exposed to neutron irradiation in surveillance capsules are withdrawn
periodically from the reactor vessel and fracture toughness test data are obtained from them
14 [34]. Neutron irradiation can cause severe elevation of the brittle fracture temperatures in
steels due to precipitation and defect hardening. Figure 2.6 shows the effect of neutron
irradiation on the DBTT of RPV steel and the data clearly reveals the increase in the
transition temperature and the decrease of the shelf energy. The primary mechanism of
embrittlement in RPV steels is the hardening formed by irradiation induced fine scale
microstructural features [35]. In steels with high copper levels, high number density of
copper-enriched precipitates is formed during neutron irradiation, acting as a major
contributor in degrading RPV steel mechanical properties [36]. However, more data is
needed to examine irradiation effects on ferritic steels with different compositions and
microstructures toward development of radiation tolerant ferritic steels.
15 Figure 2.6: Charpy impact energy-temperature plots for the unirradiated and irradiated KS-01
weld (0.37 wt.% Cu, 1.23 wt.% Ni) [38].
2.3
UFG Materials Processed by ECAP
While nano grained materials have a grain size less than 100nm, ultra-fine grained
materials are with grain size between 100nm-1000nm [39]. UFG and NC materials can be
produced by two major approaches [40]: bottom-up methods which involve consolidating
nano or ultra-fine grained materials from the atomic scale; examples of methods that use this
approach are electro-deposition [41] and inert gas condensation [15, 42]. The second method
is the top-down approach that involves refining the coarse grain materials to produce the
16 approach, in which very high plastic strain is imposed in the material to refine its grain size
[43]. Two basic procedures for SPD are commonly used to produce the ultra-fine grained
materials: high pressure torsion (HPT) [44] and equal channel angular pressing (ECAP)
procedure [45, 46]. While HPT produces relatively small size specimens, ECAP technique
provides large bulk metals and considered as one of the most efficient techniques in
producing ultra-fine grained materials by SPD [46]. ECAP process involves imposing a very
high plastic strain to the polycrystalline material by passing it through a special die. The die
is constructed of two channels which are equal in cross-section and intersect at an angle of Φ
(Figure 2.7). The total strain accumulated by passage through the die depends on the
channels’ intersecting angle (Φ), outer arc of curvature angle (Ψ) and the number of passages
through the die (Npass) [47]. Figure 2.8a [48] shows a schematic illustration of ECAP
processing where the X plane (perpendicular to the pressing direction), and Y, Z planes (side
and top faces of the pressed sample) have the same dimensions as of the original specimen.
The combination of high pressure and large uniform shear strain that is applied on the
material results in a considerable refining of the grains. Thus, larger grain boundary surface
area per unit volume will be produced. Since the grains are oriented in different directions,
dislocations will need more energy to travel to the adjacent grains and this impediment of
dislocation movement will prevent the plastic behavior of the material, leading to
improvement in the strength.
Since the cross-sectional area of the work piece remains the same when it processed
through the die, there is no geometric restriction on the strain that can be achieved, and it is
17 sample is inserted in the die and then it is removed, rotated and reinserted again in the die.
Four processing routes have been identified to define the rotational angle between each
passage through the die (A, Ba, Bc and C) [45, 46]. Figure 2.8b [45] illustrates the difference
between the ECAP processing routes; in route A the sample is inserted in the die for the
second pass without any rotation. For route Ba the sample is rotated 90° in alternate direction.
In route Bc the sample is rotated 90° in the same direction after each pass while in route C the
sample is rotated through 180° between each pressing. It was found that route Bc is the most
efficient processing route [49] because of the eventual restoration of the cubic element after
4n passes, where n is an integer. Many factors made the ECAP one of the unique industrial
processes [50] such as the enormous deformation without changing the cross-sectional
dimensions, the large size production of bulk metals, the uniform structure of the worked
18 Figure 2.7: Schematic illustration of the passage of a sample through the die in ECAP
technique.
Figure 2.8: Schematic illustration of a typical ECAP facility (a) and the rotational scheme of the four processing routes in ECAP (b).[45, 48]
19
2.4
Irradiation Effects on Nano and Ultra-Fine Grained Materials -
Literature Review
Nano and ultra-fine structured materials have opened a new and fascinating bath in
materials research due to their unique and improved properties. Small grain size enhances the
strength of the material (Hall-Petch relationship), indicating promising potential for these
materials. High grain boundary density provides large free surface to volume ratio and offers
short circuit diffusion paths toward grain boundaries. Moreover, Nano structured materials
also showed higher heat capacity and enhanced magnetic properties as compared with
conventional materials [15].
Extreme operating conditions in advanced reactors accelerate the aging process in
reactor structural materials leading to degradation in their performance and eventual failure.
Recombination of radiation-induced point defects at free surfaces such as grain boundaries is
energetically favorable and is one mechanism whereby the rate of radiation damage build-up
can be retarded. Hence, large volume fraction of grain boundaries in UFG materials can act
as an important sink for radiation damage; it provides free surfaces that attract, absorb and
annihilate point and line defects produced by neutron radiation exposure. Thus, high grain
boundary density may prevent, delay or minimize the effects of radiation damage in materials
[51, 52].
The influence of materials’ grain size on its irradiation resistance was first observed
in early seventies by Singh [53] who illustrated that void formation is reduced by decreasing
grain size. Using austenite stainless steel irradiated by 1 MeV electrons, Singh showed that
20 demonstrated that the larger the grain size the higher the void volume swelling at all dose
levels (Figure 2.9) indicating that ultra-fine grained materials show better resistance to
irradiation induced swelling.
Figure 2.9: Void volume swelling in electron irradiated austenite stainless steel at different doses and grain sizes [53].
2.4.1 Reduced Defect Density
Rose et al. [54] studied the defect evolution in nanostructured materials using
transmission electron microscopy (TEM). They showed that defect densities in
21 condensation technique (IGC) and irradiated by 4 MeV Kr ions at room temperature,
decrease as the grain size decreases (Figure 2.10). Defects are not present for grain sizes
below 30 nm (Pd) and 15 nm (ZrO2). The difference in the defect free grain size is due to
different diffusion lengths for point defects in palladium compared to zirconium oxide. Later,
Chimi et al. [55] used the electrical resistivity measurements to investigate the radiation
resistance of nanocrystalline gold and compared it to coarse grained counterparts. Results
indicate that rate of resistivity change in nanocrystalline Au irradiated by C ions at 300K is
smaller than in its coarse grain counterparts, owing to the decrease of defect accumulation
rate in the nanocrystalline material (Figure 2.11). Analogues results from other studies [56]
suggested good irradiation resistance of nanocrystalline materials due to the lower irradiation
induced defect densities. Matsuoka et al. [57] studied the effects of neutron irradiation on
UFG SUS316L stainless steel developed by mechanical alloying (MA) and NC Ni and Ni–W
prepared by electrodeposition technique. Their TEM observations revealed defect-free zones
along grain boundaries in SUS316L steels, suggesting that the grain boundaries are acting as
sinks for radiation induced defects. Vickers microhardness data of the studied materials with
different grain sizes were reported before and after neutron irradiation to 1.14 × 1024 n/m2 at
290 °C. Figure 2.12 illustrates that while irradiation causes increased hardness in coarse grain
stainless steel samples, the hardness of the UFG hot isotactic pressed (HIP) SUS316L stainless steel (grain size of 0.1 and 0.3 μm) was almost unchanged. Similar results were
obtained in the case of NC Ni (grain size 50 nm). It’s important to note that NC Ni (grain size
of 50 nm) exhibited grain growth after irradiation up to one order of magnitude (50 nm to
22 in this case. Interestingly, large increase in the hardness of the NC Ni-W was noted after
irradiation in spite of the grain growth from 6 to 8.5 nm. For Ni-W material with grain size
less than about 10 nm, it was observed that as the grain size decreases, the hardness will
decrease (inverse Hall–Petch relationship) [58]. So, this increase in hardness might be caused
mainly by the grain growth during the irradiation. Another neutron irradiation study was
carried out by Kurishita et al. [59]. They studied neutron and ion (He) irradiation effects on
ultra-fine grained tungsten alloy (W-(0.25-0.8) wt% TiC) fabricated by mechanical alloying
(MA) in different gas atmospheres (Ar, H2). After neutron irradiation both interstitial-type
dislocation loops (I-loop) and void number densities were calculated using TEM (Table 2.1).
Void density decreases drastically in UFG W-0.5TiC alloys compared to CG pure tungsten,
whereas I-loop number densities didn’t show significant difference. Irradiation hardening
was assessed utilizing Vickers micro hardness test. CG pure tungsten exhibited an increase
in hardness after neutron irradiation (∆HV=98) while UFG alloys didn’t show significant
change indicating better irradiation hardening resistance. Kurishita et al. also showed that
after ion irradiation by 3MeV He at 550 °C, the critical fluence for exfoliation and surface
cracking along grain boundaries will occur at 2×10²² He/m2 in the coarse grain commercial
tungsten, while it will occur at about 10 times higher fluence (3×10²³ He/m2) in case of UFG
W-0.5TiC-H2, illustrating higher surface damage resistance. Recently, Sun et at. [60] also
observed lower densities of helium bubbles in the irradiated UFG Fe-14Cr-16Ni (wt%)
austenite steel (grain size of 400 nm) compared to the CG counterparts (grain size of 17 μm)
after irradiation with 100 keV helium ions at room temperature. Consequently, less
23 Figure 2.10: Defect density vs. grain size in ion irradiated ZO2 (a) and Pd (b) [54].
24 Figure 2.12: Vickers microhardness as a function of neutron irradiation fluence for different
grain size Stainless steel (a), Ni and Ni ̶ W materials (b) [57].
Table 2.1: Number densities of I-loops and voids in coarse grain pure tungsten and UFG tungsten alloys after neutron irradiation at 600 °C to 2×1024n/m2.
Number density (N/μm3
) Pure W W-0.5TiC-H2 W-0.5TiC-Ar
I-loop 6×10³ 5×10³ 5×10³
Void 125×103 32×103 25×103
2.4.2 Irradiation Induced Amorphization
Amorphization induced by irradiation is affected by four factors: type of the material,
grain size, temperature and irradiation dose [51]. Irradiation often enhances amorphization in
coarse grained materials [61, 62] . However, experimental results have controversial results
25 65] . Meldrum et al. [63], found that nanocrystalline zirconia (ZrO2) irradiated by Xe ions
can be amorphized at a dose of 0.9 dpa, while coarse grain counterparts didn’t show any
evidence of amorphization even after irradiation to 640 dpa. On other hand, Shen et al. [66]
showed that NC ionic material (MgGaO4) has an enhanced irradiation amorphization
resistance. While coarse grain MgGaO4 began amorphization at fluence of around 5×10¹⁹
Kr/m2, NC counterparts remained crystalline even at higher fluences. Similar results were
obtained by Kilmametov et al. [64] where nanocrystalline Ti49.5Ni50.6 showed better
irradiation amorphization resistance than its coarse grain counterparts. Figure 2.13 shows
X-ray diffractograms for Ar+ ion irradiated TiNi and it illustrates that CG material exhibits
increasing broad background with increasing intensity even at relatively small dose (0.4 dpa)
indicating partial amorphization. Moreover, in case of CG TiNi both (100) and (200) peaks
disappear after irradiation. In contrast, the NC TiNi shows no amorphous background even
after irradiation to 5.6 dpa and the peak (200) was still shown revealing smaller tendency for
irradiation induced amorphization. The article by Ovid'ko and Sheinerman [67] demonstrated
that in nanostructured materials, two scenarios may affect radiation induced amorphization:
first, grain boundaries act as sinks for radiation damage leading to reduced defect densities
and thus hinder and suppress amorphization driven by defect accumulation. Secondly,
nanostructured materials provide high-density of free surfaces (grain boundaries) which
characterized by excess energy and essentially contribute to the total energy of the crystalline
state. Ovid'ko and Sheinerman suggested a theoretical model to explain the contradiction in
26 experimental results on the effect of irradiation on amorphization of NC and UFG materials
are summarized in reviews [17, 18].
Figure 2.13: XRD profiles of CG TiNi (a) and NC TiNi (b) before and after the irradiation.
2.4.3 Irradiation Induced Recrystallization Processes
Grain growth may occur during irradiation if the volume of the irradiation
displacement cascade exceeds the grain size or overlaps the grain boundaries. Hence,
recrystallization occurs during cooling and shrinking of the cascade resulting in grain growth
[68]. It was shown by TEM that after irradiation with Kr+ ions at room temperature, grain
growth was clearly observed in nanocrystalline Pd [69]. Radiguet et al. [70] investigated the
effect of irradiation on the microstructure of nanostructured 316 austenite stainless steel
27 iron ions at 350 °C causes grain growth in the material (40 nm before irradiation and 60 nm
post irradiation), annealing the NC stainless steel at 350 °C (same as irradiation temperature)
for 24 hours has no influence on the average grain size (Figure 2.14) indicating that the
observed grain growth in the irradiated samples was not thermally activated but instead it
was due to irradiation damage. Kaoumi et al. [71] showed that grain growth in irradiated
materials can be divided into three regions: non thermal growth at low irradiation
temperatures (below 0.15-0.22 Tm) (Figure 2.15 shows grain-growth induced by ion
irradiation at room temperature), thermally assisted region where both irradiation effects and
thermal motions may increase the grain growth rate, and high temperature region where grain
growth is dominated by the increase of irradiation temperature (i.e., thermal effect). They
proposed a model to describe grain growth in the low temperature region where grain growth
is induced by ion irradiation damage. After the collision displacement cascade, the remaining
kinetic energy of the recoil atoms is thermalized within the crystal lattice resulting in a short
lived thermal spike in a very localized region. If the spike occurs near grain boundary, atoms
which are thermally activated within the thermal spike region can jump across the boundary
resulting in grain boundary migration and hence grain growth. The model relates the average
grain size with the ion dose and it illustrated a good agreement with experiments
(Figure 2.16). However, some studies showed a contradictory behavior of nano and ultra-fine
grained materials under irradiation. Nita et al. [56, 72] observed grain size refinement in SPD
Ni following irradiation with 590 MeV protons at room temperature and Figure 2.17
elucidated the average grain size deduced from TEM observations. Average grain size for
28 that the grain refinement may be due to migration of defect clusters produced by irradiation
to sub-grain boundaries and forming a cell structure that eventually may result in the
formation of new smaller grains. In order to clarify the mechanisms of recrystallization and
grain growth in nano and ultra-fine structured materials, more studies are needed on
irradiation experiments on different materials at various irradiation temperatures and doses to
demonstrate the influence of irradiation on the average grain size.
29 Figure 2.15: Bright field TEM images of the Au, Pt, and Cu films in the initial state and after
30 Figure 2.16: Average grain size vs ion irradiation dose. Experimental data vs model at low
irradiation temperatures. Pt irradiated with Ar 500 keV ions at 298 K; Pt irradiated with 1 MeV Kr ions at 50 K and 298 K; Zr irradiated with 500 keV Kr ions at 20 K; Cu irradiated
31 Figure 2.17: Grain size distributions for UFG Ni before (red) and after (blue) proton
irradiation at room temperature [56].
2.4.4 Computer Simulations Studies
The combination of the experimental results (neutron and ion irradiation) along with
predictive simulation models is a great tool to develop improved candidate materials for
advanced reactors. Computer simulations allow us to investigate the irradiation interaction
with matter at atomic scale. Modeling of radiation damage and displacement cascades in
materials has been investigated utilizing different materials and crystal structures [73, 74].
32 computer simulations. Through molecular dynamics (MD) simulations on nanostructured bcc
molybdenum Millett et al. [75] demonstrated that grain boundary sinks have equal bias to
both interstitials and vacancies. Samaras et al. [21] investigated the primary damage state
after irradiation in both NC iron (bcc) and Ni (fcc) and they concluded that grain boundaries
play a significant role in damage production during displacement cascade. Analogues study
was performed on copper [76]. In order to understand the atomistic mechanism leading to
irradiation tolerance behavior of the nano and ultra-fine grained materials, and to understand
how defects interact with grain boundaries, Bai et al.[77] elucidated using different
simulation methods (MD, temperature accelerated dynamics (TAD) and molecular statics)
that grain boundaries upon irradiation are loaded with interstitials and eventually they
become sources emitting interstitials via replacement process to annihilate vacancies in the
bulk (Figure 2.18). Moreover, they found that interstitial-rich grain boundaries reduce
vacancy diffusion barriers thus enhancing vacancies hopping and vacancies can migrate to
the grain boundary more easily. Their “loading-unloading” model explains the previous
experimental observations where the nano and ultra-fine grain materials may have better or
worse radiation tolerance properties compared to their coarse grain counterpatrs, depending
on the experimental conditions. Using MD simulation studies on copper, Bai et al.[77] also
found that the number of surviving defects after irradiation depends on the distance between
the initial PKA and the grain boundary, and the optimum distance where the number of
defects is minimum was found to be 20 nm. Molecular dynamics computer simulations on
irradiated NC Ni [68] showed that grain growth is observed if the irradiation damage spike
33 growth will not occur. Samaras et al. [78] also used molecular dynamics simulation to
investigate the role of GBs in irradiated NC Ni. They showed that grain boundaries act as
sinks for interstitials leaving the interior of the grain with only vacancy defects which may be
removed by surrounding grain boundaries or triple junction regions.
As a conclusion from this literature review, knowledge about neutron irradiation on
UFG grain materials is scarce and most of the previous studies were performed using charged
particle irradiations which would not have the same effect as neutron irradiation because, for
the same incident particle energy, the heavier particles are slower, stopped easier and deposit
their entire energy over much shorter distances. Hence, innovative research that elucidates
34 Figure 2.18: Temperature accelerated dynamics (TAD) simulation snap shots for the radiation damage cascade at 300 K in copper at different time intervals to follow the defect
kinetics. It shows the damage self-healing near the grain boundary. Black small spheres represent the lattice atoms before irradiation, green spheres are interstitial atoms, red cubes
are vacancies, blue spheres are atoms that moves more than 1Å during an event, purple vectors represent the direction of moving atoms and the two horizontal lines in all the snap
35
Chapter 3.
Materials and Irradiation Experiments
This chapter provides detailed information about the alloy used in this study, the
processing procedure, sample preparation and irradiation experiment procedures and
calculations. The irradiation experiments were performed in two reactors: 1) PULSTAR
reactor at North Carolina State University (NCSU) at Raleigh, North Carolina and 2)
Advanced Test Reactor (ATR) at Idaho National Laboratory (INL) at Idaho Falls, Idaho.
3.1
Materials and Sample Perpetration
Two material cases are considered in this study; ultra-fine grain low carbon steel
(weight composition is shown in Table 3.1) processed through ECAP (section 2.3) and their
conventional coarse grain counterparts that were produced by annealing the UFG material at
800 °C for one hour. UFG steel was made by ECAP using Bc route [45] with four passes
where the material is rotated 90° in the same direction after each pass. This processing route
ensures eventual restoration of the material cubic element (section 2.3). Pre-irradiated mean
grain sizes for the UFG and CG steels are 0.35±0.18 and 4.4±1.8 μm, respectively
(Figure 3.1).
The UFG steel was received from UFA State University in the form of parallelepiped
bar with 1x1 cm2 cross-sectional area. As mentioned earlier, the coarse grain counterparts
were produced in the nuclear materials laboratory at NCSU by annealing the UFG samples to
800°C for 1 hour. The heat treatment was performed in flowing argon atmosphere to
36 before and after annealing process (Figure 3.2) showed that Vickers micro-hardness of the
as-prepared and the post-annealed samples treated up to 420°C have nearly the same value
equal to 3.09 GPa. Annealing at higher temperatures leads to a gradual decrease in the
micro-hardness values of the samples to attain 1.28 GPa for the sample that was annealed at 800°C
and this annealed material is considered as conventional grain sized (CG) steel in this study.
Following heat treatment, the thin oxide layer created during heat treatment was removed
using 600 grit SiC grinding paper. Prior to irradiation, specimens with four different
geometries were prepared from both UFG and CG steels. Figure 3.3 shows the geometries for
the four types of specimens used in this study. Samples were cut from the bulk material and
were prepared by grinding with a series of silicon carbide papers (600, 800 and 1200 grits) to
optical flatness and then polished in colloidal silica resulting in deformation free surfaces. In
order to minimize induced radioactivity, relatively small disc and coupon samples along with
miniature tensile specimens were used in this study, and special tensile grips were designed
for testing those miniature tensile samples (Figure 3.4).
Table 3.1: The chemical composition of the steel material (weight percent).
Elements C Si Mn Fe
37 Figure 3.1: Transmission electron microscopy (TEM) micrograph showing the grin size distribution for UFG steel (d= 0.35±0.18 μm) (a) and electron back scattered diffraction
(EBSD) micrograph for CG Steel (d= 4.4±1.8 μm) (b).
38 Figure 3.3: Pre irradiation sample geometries for both UFG and CG steels.
39 3.1.1 ECAP Imposed Strain Calculations
ECAP process imposes high shear strain to the work piece resulting in significant
grain refinement. The strain introduced to the work piece due to the ECA pressing is
calculated using Iwahashi model [47]. Iwahashi analysis assumes that the dies are fabricated
as illustrated in Figure 3.5 and the specimen is lubricated so that frictional effects may be
neglected.
40 Using the notations in Figure 3.5, a small element in the sample, initially square in
cross-section with dimensions given by abcd, becomes deformed by shear on passage
through the die into the configuration given by ' ' ' 'a b c d .
The shear strain (γ) is given by:
γ=tan (𝜃) = ' ' a q
d q. (3.1)
But d ' q=ad because ECAP process does not change the cross-sectional dimensions of the
deformed work piece. Due to geometry b ' a=c'd=a'p=pq and ' cot 2 a p= pq=ad Φ
Then ' 2 cot 2 a q= ad Φ
, (3.2)
where Φ is the inner contact angle between the two intersecting channels. From Equ 3.1 and
Equ 3.2 the shear strain is given by:
2 cot 2 γ = Φ
. (3.3)
However, the equivalent Von Mises strain is given by:
0.5
2 2 2
2 2 2
2
2
3
xy xz yz
x y z
eq
γ γ γ
e e e
e + + + + + =
. (3.4)
41 2 cot 2 3 e Φ =
. (3.5)
The imposed strain is proportional to the number of passes though the die (Npass) and thus the
total strain is given by,
2 cot 2 3 pass N e Φ =
. (3.6)
However, it was shown [47] that if the arc of curvature angle (Ψ) (Figure 3.6 b) at the outer
point of contact between channels of the die was not zero then the total imposed strain is
given by:
2
cot csc
2 2 2 2 2
3
pass eq
N
e = Φ Ψ+ +Ψ Φ Ψ +
. (3.7)
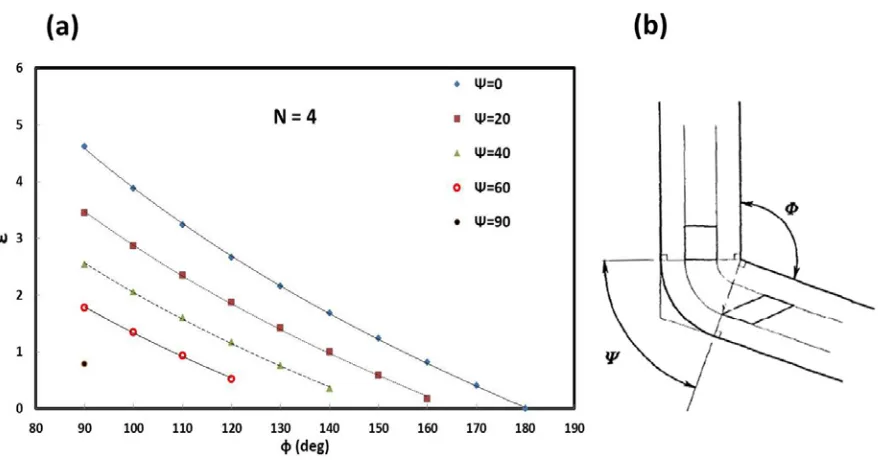
In our study, the inner contact angle (Φ) and the arc of curvature (Ψ) at the outer
point of contact between channels of the die were 90 and 0 deg, respectively. Using Equ.3.7
the imposed strain is calculated and found to be 4.618. As shown in Figure 3.6 the imposed
strain is inversely proportional to both inner (Φ) and outer (Ψ) angles and the largest imposed
42 Figure 3.6: Imposed strain due to 4 passes through the die versus the inner contact angle (Φ) between channels of the die (a). Schematic of ECAP die showing the inner contact angle (Φ) and the arc of curvature angle (Ψ) at the outer point of contact between channels of the die (b).
3.2
Irradiation Experiments
Sample neutron irradiation was performed in two reactors at different irradiation
doses. In this section, the irradiation procedures and calculations of irradiation parameters are
presented for both PULSTAR and ATR experiments.
3.2.1 Fast Neutron Spectrum Determination for the dpa Calculations
In order to predict the effects of radiation on materials following neutron irradiation, a
quantitative description of the irradiation damage produced by the incoming neutrons has to
43 irradiated materials and can be defined as the average number of times each atom of a solid is
displaced from its lattice site during radiation exposure [79]. As a standard parameter in
determining radiation damage in materials, dpa measures the destruction energy deposited by
neutrons in terms of the number of atoms that are permanently displaced from their lattice
position to a stable interstitial position [80]. The dpa is used to correlate the damage in
materials irradiated at different neutron environments. Different neutron irradiation facilities
have different neutron spectra and can lead to different levels of radiation damage in
materials. However, dpa quantity can account for these spectral differences and fit the data in
one curve so that the irradiation effects on materials irradiated at different environments can
be compared. Figure 3.7 shows the relationship between the irradiation dose and the
irradiation effect (irradiation hardening) in 316 stainless steel alloy irradiated at three
different neutron energy flux spectra. It can be shown that unlike fluence (Φ × tirr), dpa can
properly relate the results from the three different facilities and hence, the irradiation effects
data from the different facilities can be compared easily. The dpa quantity can be calculated
from the following equation [19]:
dis
R t
dpa N
⋅
= , (3.8)
where Rdis is the number of displacements per unit volume per unit time (displacement rate),
N is the atomic number density and t is the irradiation time. The displacement rate can be
evaluated as,
( ) ( )
max
min
E
dis i d i i
E
44 where
φ
( )
E
i is the energy dependent neutron flux,σ
d( )
E
i is the energy dependentdisplacement cross-section and Emax andEmin are the maximum and minimum energy of the
incident neutrons.
As shown in Equ 3.9, unless the neutron flux spectrum at the irradiation position in
the reactor is well defined, the dpa measurement will not be accurate, and the objective of
predicting the change in the material properties after irradiation based on the dpa
measurement will not be precise. Thus, the rest of this section illustrates the technique and
the measurements that were conducted to map the high energy flux at the material irradiation
45 Figure 3.7: Comparison of yield stress change in 316 steel following irradiation in three
46 3.2.1.1 Foil Activation Technique
Several measuring techniques are used to determine the fast neutron flux spectrum.
One of the most common techniques for fission reactors is the activation of multiple
threshold detectors [81]. It involves the irradiation of target materials (foils) with a flux of
neutrons for a pre-determined period. The foil is removed after a measured period of time
and the induced activity is determined [82]. The neutrons interact with the nucleus of the
target material and produce new radioactive isotopes. These radioactive isotopes emit a
unique combination of gamma rays that can be detected and then used to measure the neutron
spectrum inside the reactor at the position of the irradiation experiment. Neutron interactions
with material nucleus can have many different reaction types such as: (n,γ), (n,α), (n,p),
(n,2n), etc. Each of these interactions has a probability of occurring defined by its
cross-section. Some interactions such as (n,γ) reactions can occur at any incident neutron energy,
while others require neutrons above a minimum (threshold) energy for the reaction to occur.
Different materials undergo different neutron reactions that have different threshold energies.
The foils have to meet some conditions in order to be suitable for this activation technique
[82, 83]:
• The different reaction cross-sections should cover the entire neutron energy of the flux
spectrum of interest.
• In order to obtain higher saturation activity, foil materials is preferred to have high
![Figure 1.1: Light bulbs lit by the world's first electricity generated from nuclear power [2]](https://thumb-us.123doks.com/thumbv2/123dok_us/1381720.1170851/21.612.105.529.381.583/figure-light-bulbs-world-electricity-generated-nuclear-power.webp)

![Figure 3.7: Comparison of yield stress change in 316 steel following irradiation in three different facilities [81]](https://thumb-us.123doks.com/thumbv2/123dok_us/1381720.1170851/61.612.185.477.78.504/figure-comparison-stress-change-following-irradiation-different-facilities.webp)
![Table 3.2: Characteristics of threshold reactions [90–92]](https://thumb-us.123doks.com/thumbv2/123dok_us/1381720.1170851/68.612.90.538.238.503/table-characteristics-threshold-reactions.webp)
![Table 3.3: Decay properties of the 152Eu standard source [91].](https://thumb-us.123doks.com/thumbv2/123dok_us/1381720.1170851/69.612.140.502.72.355/table-decay-properties-eu-standard-source.webp)