Scholarship at UWindsor
Scholarship at UWindsor
Electronic Theses and Dissertations Theses, Dissertations, and Major Papers
8-13-1965
The effect of anxiety, neuroticism and task difficulty on serial
The effect of anxiety, neuroticism and task difficulty on serial
learning.
learning.
F. Xavier Plaus University of Windsor
Follow this and additional works at: https://scholar.uwindsor.ca/etd
Recommended Citation Recommended Citation
Plaus, F. Xavier, "The effect of anxiety, neuroticism and task difficulty on serial learning." (1965). Electronic Theses and Dissertations. 6399.
https://scholar.uwindsor.ca/etd/6399
This online database contains the full-text of PhD dissertations and Masters’ theses of University of Windsor students from 1954 forward. These documents are made available for personal study and research purposes only, in accordance with the Canadian Copyright Act and the Creative Commons license—CC BY-NC-ND (Attribution, Non-Commercial, No Derivative Works). Under this license, works must always be attributed to the copyright holder (original author), cannot be used for any commercial purposes, and may not be altered. Any other use would require the permission of the copyright holder. Students may inquire about withdrawing their dissertation and/or thesis from this database. For additional inquiries, please contact the repository administrator via email
NOTE TO USERS
Page(s) not included in the original manuscript and are
unavailable from the author or university. The manuscript
was scanned as received.
53-58
This reproduction is the best copy available.
®
THE EFFECT OF ANXIETT,
NEUROTICISM AND TASK DIFFICULT!
CSX SERIAL LEARNING
by
F*. XAYIER FLAGS
B.A*,, Assumption XMIveralty of Windsor, 1963
A Thesis
Submitted to the Faculty of Graduate Studies through the Department of Psychology in. Partial Fulfillment of the Requirements
for the Degree of Master of Arts at the l&iiversity of Windsor
Windsor, Ontariofc Canada
INFORMATION TO USERS
The quality of this reproduction is dependent upon the quality of the copy
submitted. Broken or indistinct print, colored or poor quality illustrations and
photographs, print bleed-through, substandard margins, and improper
alignment can adversely affect reproduction.
In the unlikely event that the author did not send a complete manuscript
and there are missing pages, these will be noted. Also, if unauthorized
copyright material had to be removed, a note will indicate the deletion.
®
UMI
UMI Microform EC52580
Copyright 2008 by ProQuest LLC.
All rights reserved. This microform edition is protected against
unauthorized copying under Title 17, United States Code.
ProQuest LLC
789 E. Eisenhower Parkway PO Box 1346
Ann Arbor, Ml 48106-1346
ft&K
i o 5^1APPROVED BX:
y
This study was an attempt to demonstrate the
Xerkes-Dodson law- Specifically* the. combined effects of
motivation, and task difficulty on sequential learning
were
investigated-The experimental group consisted of 64 Ss
assigned to four difficulty levels," each level was split,
on. the median, first on the basis of scores on the Taylor
Manifest Anxiety Scale and secondly on the basis of the
neuroticism scale of the Maudsley Personality Inventory.
The levels of difficulty of the task which the Ss were
required to l e a m was pre-determined by the .number of
alternate responses in the sequence of numbers.
Analysis of variance yielded a statistically
significant interaction between anxiety and tasx difficulty;
there was, however, no significant interaction between
neuroticism and. task
PREFACE
Tiiia study began as a result of my interest in
the relationship of personality variables to learning.
The specific techniques employed, i.e, the; Taylor Manifest
Anxiety Scale and the Maudsley Personality Inventory, were,
adopted because, of the author's experience with them in. a
clinical situation and a desire to learn more about their
applicability in an experimental situation.*
I would like to express my appreciation to
Dr. A.A. Smith, under whose direction this, study was under
taken and without whose assistance it would never have
been completed; to my readers Fr. R.C. Eehr Ph.D. and
Fr* C.P.J. Crowley Ph.D* for their non-directive guidance;
and to John and. Mary Bonner for their encouragement and
Page PREFACE . •. *. ... . . . . iv
LIST OP TABLES . . . vi
LIST OF FIGURES . . . vii
Chapter
I. INTRODUCTION. . . . . . . 1 Background of Related Research . . IQ Purpose, of the Study . . .. ., 24
II: METHODOLOGY AND. PROCEDURE . . . 26 Experimental Sample • . . . 26 Testing Materials . .. . . 26 Experimental Procedure, and Apparatus . 2?
H I PRESENTATION AND ANALYSIS OF RESULTS . 34.
IT DISCUSSION OF RESULTS . . . . 4X Research Hypotheses Reconsidered. . • 4X Results in Relation to the.
Yerkes-Dodson Law . . 42
Y SUMMARY AND CONCLUSIONS . . . . 46
APPENDIX A Taylor Manifest Anxiety Scale • . 48 Maudlsley Personality Inventory . 50
APPENDIX B. Instructions for TMAS and. MPI: . . 53:
APPENDIX C Instructions for Experimental Groups . 54
APPENDIX D Sequences employed in Learning. Task . 57'
APPENDIX E Raw Data . . . . 58
BIBLIOGRAPHY . . . . 5 9
VITA AUCTORIS . . r • • * * 63
vr
LIST OF TABLES
Table
1 Mean. Learning Scores (correct responses)
2 Mean number of' trials to criterion, for high and. low anxious subjects on. "easy material. (Saltz & Hbehn, 1957)
3 Mean Performance Scores (mean, test blocks to. criterion for high, and low anxiety Ss according to difficulty level)
4 . Analysis of Variance of Test. Blocks to Criterion for Degree of Anxiety and Level,
of Task. Difficulty .
5 Analysis of Variance for Simple Effects of Anxiety and Task Difficulty . •
6 Mean Performance Scores (mean test, blocks to criterion for high and low neuroticism. subjects according to difficulty level of task.
7 Analysis of Variance of Test Blocks to criterion for Degree of Neuroticism and. Level of Task. Difficulty
Page 14
16
34
35
37
38
Figure 1
2
3
4
5
6
Learning as a function of difficulty and degree of motivation
Conditioning curves for high and low anxiety subjects
The performance of anxious and non- anxious subjects when level of diffi culty and degree of competition are inversely related. . • .
Individual subject panel of the General. Learning. Apparatus .
The effects of anxiety and task difficulty on performance
The effects of neuroticism and task difficulty on performance .
vil
Page
6
11.
IT
29
36
39
CHAPTER I
INTRODUCTION
The current period in psychology is. marked by
widespread, and. energetic attempts, to incorporate motivational
variables into models of behavior* There is. less effort
spent in trying to rule out. those conditions which, In any
theoretical language, can be called motivational* The
result of this union, of personality theory and classical
experimental, psychology can, at the risk of oversimplifica
tion, be divided into two general approaches or techniques*
The first approach, is the antecedent measurement of
personality traits as they bear on variations in perform- •
ance, while the: second is the deliberate and controlled
manipulation of extrinsic motivational variables to deter
mine their effect on performance. Poll.owing Hebb (1955),,
motivation refers in a rather general sense to the
energizing of behavior.
In. the specific area of the applications of
learning theory to the problems, of personality and
especially to motivation, the concept of anxiety has, for
many years, occupied a. central position. The general point
of view Is that anxiety plays a double role, being on the
-ment through, its. reduction.., No attempt will. be. made, here
to. review the vast amount of literature concerned, with the
concept of anxiety as reinforcement through, its reduction.
Young (1961) has clearly outlined the dimensions
of the concept of drive. Following him, if the behavioral
(descriptive) views of drive are disregarded, there
remains: a general agreement upon, the following points:
Drive is an. organic motivation, rather than something
environmental. Drive is persisting motivation rather than,
a brief stimulation. Finally, drive Is. an activating,,
energizing process. The functions of drive can be summed up
as instigating, sustaining, regulating and organizing
behavior.
As an. abstract formulation, the above statements
have certain summary values. For experimental purposes,
however, some more operational, definition is. needed. In
learning situations with, rats, the position is relatively
straightforward:, hunger and thirst can be employed, with the.
assumption, justifiable, within certain limits, that drive.
Increases mono.tonically with the. number of hours, of
deprivation, of food or water.
In studies of human learning, however, such a
simple manipulation, of basic needs is not generally prac
tical. Spence, basing his hypothesis on experiments such
3
as that of Spence and Taylor (1951) and Taylor (1951), has
suggested that drive in human, subjects might be measured
by the level of anxiety, as determined by scores on the
Taylor Manifest Anxiety Scale (TMAS). He and his associates,
as. we. shall see,, have shown that high-anxious subjects
condition more rapidly than those lower on the TEAS.
Eyelid conditioning, as used by Spence (1951), is
a relatively simple form of learning. When. the. acquisition
of more difficult habits is investigated, the position, as
we shall also see, is reversed; highly anxious subjects
learn, more slowly than those with, presumably lower levels
of drive. How is this apparent contradiction to be
resolved?
Before attempting to answer this question, it is
necessary to, digress briefly, and decide what, shall be
meant by the term "difficult", as applied to a learning
situation. Two definitions may be considered. One, which
might, be called, ."a priori difficulty", equates difficulty
with stimulus and/or response complexity. That is to say,
simple conditioning is simple, precisely because it involves
only one or two stimuli and one or two responses. On the
other hand,, the learning of a list, of words would be
judged more difficult because it involves a much, larger
set of potential stimulus-response connections. This
how well people, will actually perform. Most investigations*,
including the. present one* which have studied the effects
of task difficulty, have defined difficulty in this
a priori sense.
Difficulty could, however* be defined in. another'
way; in. fact, in the common sense way which asserts that,
the harder it is to learn something, the more difficult, must
be the task. This, of course,, is “a posteriori difficulty1*.
Its experimental, use could entail the use of a standardized,
or "calibration" group of subjects, with mean trials to
criterion, or some similar performance score on a number of
trials, being taken as the difficulty measure. So far as
the present investigation is aware, only one recent study
has used this procedure.
It should be clear, however, that, in. the sense
of proof, these, definitions are by no means necessarily
synonymous. With this in mind, it is now possible to return
to the. apparently paradoxical relationship Detween, drive
and difficulty in learning, and point to one possible,
resolution of this paradox.
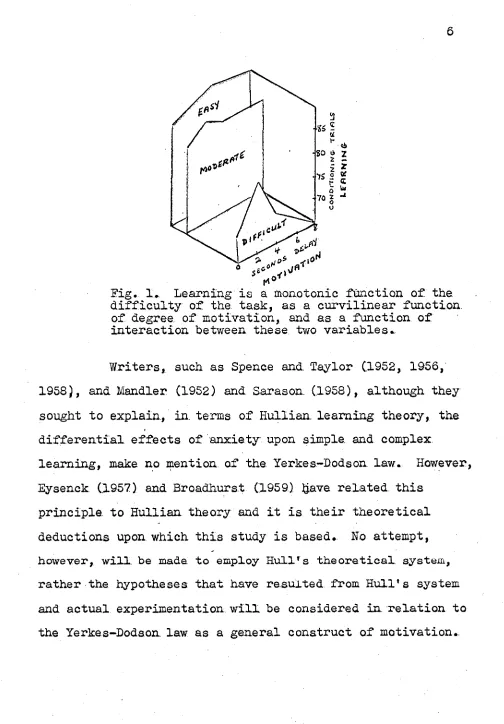
Yerkea and Dodson (1908) have probably formulated
the earliest clear statement regarding this, in what is now
known*as the. Xerkes-Dodson law. They stated that "an
easily acquired habit ... may be readily formed under strong
stimulation, whereas, a difficult habit may be readily
acquired only under relatively weak stimulation." (Yerkes
and Dodson; 1908, P. 482} .Tones (1961, P.. 493) in.applying
this principle to learning situations, stated it in terms
of two. general tenets:
1. Efficiency of learning is a curvilinear function of drive strength, some inter mediate level of drive, being optimal.
2.. Optimal drive is an inverse function of the difficulty of a learning task.
Young (.1936) in. reviewing previous studies found
that this law held true for both animals and humans.
Further work, such as Broadhurst (.1957) with rats and
Eysenek (1963) with humans, have continued to support this
law. In. Broadhurst*s experiment, the motivation was
supplied by keeping the rats deprived of air (underwater)
for various periods up to eight seconds, before releasing
them to. attempt a discrimination task. The three levels of
difficulty were established by employing three levels of
illumination in the discrimination, task... The results of
Broadhurst*s experiment are presented in Figure 1.
Assuming that the Yerkes-Dodson law has a certain
range of generality, its. significance according to.
Broadhurst. (1959, P. 330)' is. "in its relevance to some
problems arising from the current, integration of Hullian
learning theory most, closely associated with the names of
70 I
Fig. 1*. Learning is a monotonic function of the difficulty of the task, as a curvilinear function, of degree of motivation, and as a function of interaction between these two variables..
Writers, such as Spence and Taylor (.1952, 1956,
1958), and Handler (1952) and Sarason (1958), although they
sought to explain, in. terms of Hullian. learning theory, the
differential effects of anxiety upon simple, and complex
learning, make no mention of the Yerkes-Dodson law. However,
Eysenck (1957) and Broadhurst (1959) &ave related this
principle, to Hullian theory and it is their theoretical
deductions upon which this study is based.. No attempt,
however, will be made to employ Hull's theoretical system,
rather the hypotheses that have resulted from Hull's system
and actual experimentation will be considered in relation to
the Yerkes-Dodson. law as a general construct of motivation..
In. this regard, the fundamental concept is the
notion of anxiety as a drive. Mowrer (1939) first postulated
this concept and subsequent work (Miller, 1951; Farber, 1954;
Taylor, 1956;. and Spence, 1958) have since, put this notion
on a ^irm basis. One study that particularly pertains is
that of Malmo and Amsel (1948). They investigated the effect
of neurotic anxiety upon.rote learning, in which the subjects,
were required to learn a list of eight nonsense syllables.
They found slower serial learning with anxious subjects than
with non-anxious controls. Thus, in relation to anxiety,
this study exemplifies the Yerkes-Dodson law for a difficult
task.
Several theories have been postulated to account
for the Yerkes-Dodson effect. The first hypothesis was put
forward by Spence and his associates; their position has
been, reviewed, in many articles in the past decade (Taylor &
Spence, 1952; Farber,. 1954; Taylor, 1956; and Spence, 1958).
A succinct statement of Spence's position seems to be that
of Broadhurst (.1959, P.331). According to him,.
It may be that the increase of motivation, may operate not only on the potentially correct habit tending to the solution of the problem in a complex situation, but also upon incorrect habits as. well and consequently the emergence
The major alternative to Spence's conception of
the Yerkes-Dodson effect is the hypothesis postulated by
Handler and Sarason (1952) and also supported by Child.
(1954) concerning the possible distracting effects of the
stimuli arising from'the drive itself. With increasing
drive, the intensity of the drive stimulus is also, increased
with the result that task-interfering responses are generated
and consequently the performance of the correct habit is
impeded.. The argument here is that in a simple task, such
-as eyelid conditioning, where there is a stable relationship
between a single stimulus and a single response. Whatever
internal responses the subject is making at the time, they’
are not sufficient in number or intensity to have any effect,
thus the presence of high drive makes for improved perform
ance. However, in complex situations, where the subject is
already in conflict between various response tendencies
relevant to. the task, the presence of irrelevant responses
made to the anxiety interferes with performance to a greater
extent than. the. increased drive improves it.
A survey of the possible theoretical interpreta
tions of the Yerkes-Dodson. law has. been also, contributed by
drones (1961). He stresses two further aspects in addition
to the two mentioned above.. The third possible effect of
changes in drive concerns the stimulus properties of driven
According to. Jones (1961, P. 494), "the stronger the drive,
the more, intense the drive stimulus, the greater its share
of the stimulus complex, the greater the similarity between
the positive and negative stimuli and, therefore, the great
er the difficulty of discrimination.'1 He. goes on to state
that this effect'would be opposed to any energizing value
of increased drive and the interaction of the two effects
would determine the optimal level of drive, thus producing
a pattern of results similar to those reported by Yerkes-
and Dodson.
The fourth possible hypothesis is. that there
exists a stable curvilinear relationship between, drive and
efficiency with a stable optimum drive value (Hebb, 1955).
However, increasing; task difficulty increases the individ
ual' s general drive state in a manner analogous to the
drive increment postulated as following frustration (Brown.
& Farber, 1951;. Child & Waterhouse, 1953;; and Marx, 1956).
If so the optimum pretask drive level would be lower the more
difficult the task.
Broadhurst (1959) adds a fifth interpretation for
the Yerkes-Dodson law which is due to Easterbrook (1959) and
concerns the reduction in the range of perceptual, cues
utilized in learning when motivation is increased or when,
anxiety is present. According to Easterbrook (1959, P. 197),
"on. e.v-'ja tasks reduction in the range of cue utilization
drive is then, said to be organizing or motivating. In other
tasks, proficiency demands the use of a wide range of cues
and drive is disorganizing or emotional." Easterbrook pos
tulates that there is an optimal level of cues utilization,
beyond which the effect of task-irrelevant cues is deleter
ious to the subjects' performance.
Jones (1961, P. 495) concludes that the,... "hypo
theses are not mutually exclusive and the postulated effect
may contribute to the nature of the interaction between
drive and performance." He goes on to point out that their
relative importance may vary from situation to> situation,
but all are likely to produce the type of relationship
reported by Yerkes and Dodson.
BACKGROUND OF RELATED. RESEARCH
In. research concerning the concept of anxiety as
having the energizing properties of a drive, many have
employed the 'MAS (Taylor, 1953). It. is principally these
studies which will be reviewed here, along with incidental,
investigations which elucidate the, five, theories presented
above.
Spence and Taylor (1951) and Taylor (1951) con
ducted the original studies in this regard, and they employed
eyelid conditioning as the learning procedure. They hypo
thesized that in a simple experimental arrangement, involving
only a single habit tendency the performance level of high
drive subjects. CSs) should be greater than, for low drive
groups. The results were, in the predicted direction
(see Fig* 2) and were also obtained in. a number of other
studies (Spence, Farber and E. Taylor, 1954; and Spence and.
Ross, 1957).
a Vo
Z
50-Ao
io
T R i R U S
Fig.. 2 Conditioning curves for high- and low-anxiety subjects. (Taylor, 1951)
Spence and Taylor (1952) conducted an experiment
in serial learning. Here the hypothesis was that the per
formance of high-anxious Ss would be inferior to that of low-
anxious Ss in. a learning situation that involved competing
responses... The. learning task, consisted of a series of
twenty choices between two responses, the words left and
word, "right" appearing in the right window of a memory drum
or- the word "left” in the left window. The. Ss were required
to anticipate, whether the correct response would be to the
left or right. The results were in agreement with, the
theoretical expectation. The mean number of trials for the
anxious Ss. to reach criterion, of two consecutive errorless
trials was 32.78, while the mean number of trials for the.
nonanxious Ss was. 25.12 which, was a significant difference
at the .01 level of confidence. Another study by Farber and
Spence. (.1953) on. serial learning also supported the hypo
thesis that high, anxious Ss would be inferior on complex tasks.
Montague (.1953) investigated the effect of anxiety
upon performance as a function of the relative number and
strength of correct and incorrect response tendencies elicit
ed in the experimental situation* Ss were, given three, verbal
tasks, which had been made to vary in. the relative number of
correct and incorrect tendencies elicited, by the manipula
tion of intralist similarity and association value of the non
sense syllables employed. It was found that anxious Ss per
formed less well than nonanxious Ss on. the difficult task with
many incorrect response tendencies, showed greater improve
ment. of performance as the task became easier and surpassed
non-anxious Ss on the task with the least number of incorrect
tendencies.
Lucas (.1952) attempted to determine the reason for
13
the lowered performance of anxious Ss. He studied the effect
of anxiety on performance concomitantly with two other var
iables, failure and intra-serial duplication.. He found that
the low anxious Ss were significantly superior to: high, anx
ious Ss in immediate recall for consonant lists which con
tained confusing duplications. Also there was a significant
interaction between anxiety and failure and also anxiety and
duplication. He, found that the greater the number of fail
ure reports given, to. the Ss, the greater was the superiority
of the low anxious Ss.
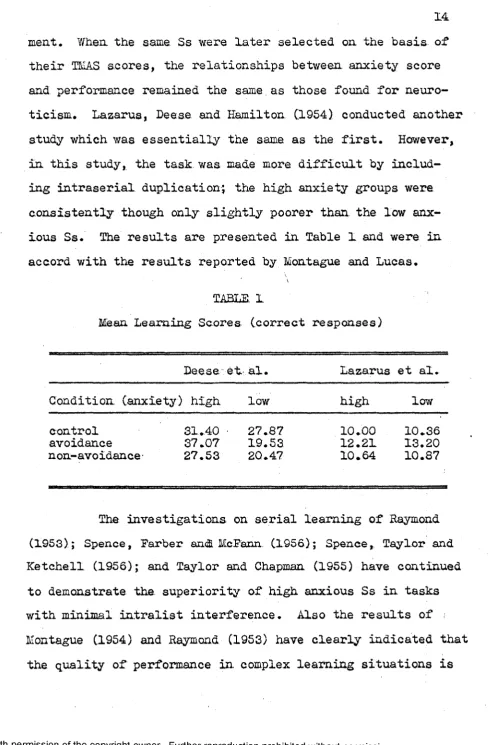
Deese, Lazarus and Keenan (,1953) showed that there
was an important interaction between scores obtained on a
neuroticism questionaire and the conditions of stress under
which learning takes place. Under control conditions, high
neuroticism was. associated with slightly more correct res
ponses than, low neuroticism. Under a second condition
(avoidance) in. which incorrect responses were followed by an
electric shock, there was a very large difference between
the high and low neuroticism groups. The high neuroticism
group showed some facilitation in performance over the com
parable control group. The low neuroticism group showed
considerable impairment in performance as a consequence of
the electric, shock. In a third condition (non-avoidance), ■
in which shock was administered, randomly, no alteration of
performance for the high neuroticism group was observed.
ment. When the same Ss were later selected on the basis of
their TMAS. scores, the relationships between anxiety score
and performance remained the same.as those found for neuro
ticism. Lazarus, Dee.se and Hamilton C1954) conducted another
study which was essentially the same as the first. However,
in this study, the task was made more difficult by includ
ing intraserial duplication; the high anxiety groups were
consistently though only slightly poorer than the low anx
ious Ss. The results are presented in Table 1 and were in
accord with the results reported by Montague and Lucas.
TABLE. 1
Mean Learning Scores Ceorrect responses)
Deese et al. Lazarus et al.
Condition (anxiety) high low high low
control 31.40 • 27.87 10.00 10.36
avoidance 37.07 19.53 12.21 13.20
non-avoidance- 27.53 20.47 10.64 10.87
The investigations on serial learning of Raymond
(1953); Spence, Farber ani McFann. (1956); Spence, Taylor and
Ketchell (1956); and Taylor and Chapman (1955) have continued
to demonstrate the superiority of high anxious Ss in tasks
with minimal intralist interference. Also the results of .■
Montague (.1954) and Raymond (1953) have clearly indicated that
the quality of performance in complex learning situations is
15
inversely related to Ss* degree of anxiety, as measured by
the TMAS, and furthermore that the advantage of the non
anxious over the anxious Ss is positively related to the prob
able number and strength of competing responses elicited.
Raymondrs study is of particular interest; he em
ployed a choice-learning situation. The Ss had to choose, one
of two alternative responseswords for each of sixteen stim
ulus words. In one half of the items the associative connec
tion of the correct word was stronger than, the incorrect word;
in the other half the incorrect word was stronger.. It was .
found that under the condition, in which the incorrect word
was stronger, the high anxious Ss did significantly worse than
the low anxious. Ss, but under the reverse condition there was
not a significant difference in overall performance. Al
though. the high anxious Ss started out better, they subse
quently became poorer than the low anxious Ss in the latter
portion, of the learning. Since the task-interfering behavior,
if there was any, would be presumably equal for the two kinds
of learning items, which were intermixed with each other in
the list, the relatively inferior performance of the high
anxious Ss with one set of items must be accounted for by
something other than distracting task-interfering responses.
Spence, Farber and McFann. (1956) posit the explanation that
once again the greater drive level of the high anxious Ss in
creased the strength of cthe; incorrect. responses and thus lead
Saltz and Hoehn. tried to control both competing
responses and the level of task difficulty to determine their
respective effects... In the first experiment, competing and
noncompeting lists of nonsense syllables were selected which
had been empirically determined (a posteriori) to have equal,
difficulty levels for a group of low anxious Ss. The pre
diction on. the basis of the Taylor-Spence, theory, was that
high anxious Ss should do more poorly on the competing
material than on the noncompeting since the increased drive
of the high anxious Ss should increase the strength of com
peting erroneous responses. The results do not. support
this prediction. Table 2 shows the mean learning rates.
TABLE 2
Mean number of trials to criterion for high and low anxious Ss on "easy” material. CS<n & Hoehn, 1957)
High Anxious
Low Anxious
Noncompeting 13% association material
31.09 ■ 27.83
Competing 90% -association material.
28.09 28.4.4
The. difference in means between the two high anxious, groups
was not significant at. the .05 level and in fact was in. the
opposite, direction...
17
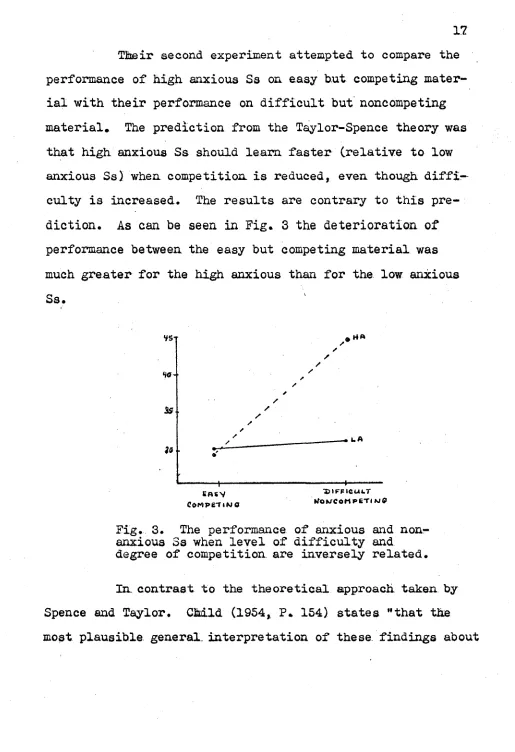
Their second experiment attempted to compare the
performance of high anxious Ss on easy hut competing mater
ial with their performance on difficult but noncompeting
material. The prediction from the Taylor-Spence theory was
that high anxious Ss should learn faster (relative to low
anxious Ss) when competition, is reduced, even though diffi
culty is increased. The results are contrary to this pre
diction. As can be seen in Fig. 3 the deterioration of
performance between the easy but competing material was
much greater for the high anxious than for the low anxious
Ss.
VST
He
ss
3i
l a
Ensv
COMPeTlNIO
^difficult
tfOMCOMPETI Wff
Fig. 3. The performance of anxious and non- anxious Ss when level of difficulty and. degree of competition, are inversely related.
In. contrast to the theoretical approach taken by
Spence and Taylor. C M l d (1954,, P. 154) states "that the
task complexity is that the disruptive effects of various
responses to anxiety vary with, the nature.of the task-"
As mentioned earlier, this is also the theore
tical approach, taken by Mandler and Sarason in their studies.
Mandler and Sarason (1952) also developed a questionaire
but it was intended not as a measure of general anxiety but
of anxiety in the situation being tested.. Their hypothesis,
is that Ss scoring high on their test respond not only with
increased drive, but also with previously learned task-
irrelevant responses to their anxiety which interfere with
performance. Predictions, derived from this hypothesis, are.
made concerning the results of an experiment involving re
peated testing with items of Koh's Block Design Test and
versions of the Wechsler Digit, Symbol Test. Stress was ex
perimentally varied by success, neutral and failure reports
to the Ss at the half way stage. As predicted, during the
non-stress period, anxious Ss tended to be inferior but not
always to a significant degree. Under stress,, the anxious.
Ss were expected to deteriorate, owing to interfering ten
dencies, while the non-anxious were, expected to improve:
owing to increased drive. Appropriate results were obtained
£br the Koh*s. designs but no significant effects were obser
ved on. the Digit Symbol Test. Success tended to produce
effects similar to failure stimulation though to a lesser
degree. In a second experiment, Sarason, Mandler and
Craighill C1952} made a similar digit symbol task sufficient
ly long to ensure that no subject could complete it on any
one trial. Stress was varied by telling the Ss that they
either should or should not be able to finish in the time
allowed. As predicted, anxious Ss were inferior but sig
nificantly so only for the stress condition. Stress, as
expected, improved the performance of nonanxious Ss but had
no apparent effect on the anxious group.
In a later experiment, Sarason Cl956) was concern
ed with the effects of three motivational variables on per
formance in serial learning. The levels of the variables
employed were a) high, middle, and low anxiety as defined
by the Ss* scores on the TMAS; b) high and low motivating
instructions; and c) administration of failure and non
failure reports. The results obtained in this study were
that high anxious, high motivating groups performed at a
lower level than did high anxious, low motivating groups.
The reverse was the case among low- and middle anxious groups,
with high motivation instructions resulting in a higher level
of performance than with low motivation instructions. In'
this experiment, either the. Spence-Taylor hypothesis or the
Mandler-Sarason hypothesis could provide the basis for the
interaction between anxiety and motivational instructions.
For the high anxious subjects, the addition of high motiva
optimum, thus resulting in a deterioration of performance,.
Spence and Taylor would hypothesize that, the increased drive
accentuates task-ineorrect responses while Mandler and
Sarason would hypothesize that the increased drive produces
task-interfering responses. However, whether, in this
particular situation, the former or the latter hypothesis
is the more relevant, the result remains the same. The
result is a deterioration in performance, of high anxious,
high motivating groups in relation to high anxious sub jects
with law motivation, instructions.
All groups in the study who received failure
reports, regardless, of TMAS scores, showed marked decrements
in level of performance immediatley after failure. In terms
of an optimal facilitative drive level, the failure reports
can be viewed as increasing drive level of all failed groups
beyond the optimal point,
Sarason (1957), in a further study on anxiety,
motivating instructions, and verbal learning, seems to
demonstrate once again; the difficulty in really separating
the two; theories* In this experiment, two kinds of motivating
instructions were employed. The first, called subject-orient
ed, emphasized the need for Ss to perform well in order to
maintain their self-esteem. The second kind, experimenter-
oriented, involved enlisting Ss to help the experimenter by
21
performing well. It was found that under both sets of
instructions the performance of the high anxious Ss was
deleteriously affected* However, the detrimental effect of
the experimenter-oriented motivation, of the high anxious Ss
tended to be less than the effect obtained with subject-
oriented instructions* For all medium and low anxious Ss
the subject-oriented motivations led to better performance
than did the experimenter-oriented instructions. However,,
the problem is that the poorer performance for the high
anxious Ss could just as well be due to the increased drive
accentuating task-incorrect responses (Spence-Taylor) as to
the accentuating of task-irrelevant responses (Mandler-
Sarason)*
The final study to o e reviewed here is an experi
mental arrangement designed by Taylor (1958) in which the
effects of increasing drive levels would be expected to re
sult in a difference between high and low anxious Ss in the
opposite direction to those expected if extratask-interfering
responses were aroused by the stress condition. If the
introduction, of stress results simply in an increase in
drive level, and, further high anxious Ss are more reactive
to such stress, these Ss should increase their margin of
superiority over the low anxious (when compared to neutral
groups). If, on the other hand, the major effect of stress
group should no longer exhibit a performance superior to the
low anxious and may even be inferior to them. The results
of Taylor's study were that high anxious Ss under neutral
nonstress conditions performed at a superior level to the
low anxious group, as predicted by drive theory. The sub
groups told that their performance had been inadequate show
ed a significant decrement, in subsequent performance when
compared to their neutral controls. According to Taylor,,
no evidence was found to support the contention that high
anxious Ss are more prone to exhibit extratask responses,
i.e., there was no interaction between anxiety level and the
stress-neutral conditions.
The first two hypotheses presented in the intro
duction are the basic theoretical constructs which have
prompted the proliferation of studies just outlined. Since '
the other three theories were not touched on in relation to
studies concerned with the TMAS, they will not be elaborated
on any further, at least as far as previous research is con
cerned. However, the experimenter takes the position
(following Eysenck, 1957; and Broadhurst, 1959) that all
five theories can be subsumed under the Yerkes-Dodson law as
a general construct of motivation. The evidence presented in
the various studies suggest very strongly that the two hypo
theses dealt with, have an element of truth in them and that
therefore the Yerkes-Dodson law, as an empirical statement
23
of relationships| may be the result of quite different
causal aets of influences.
One problem of vital importance is the dimensional,
aspects of the term ’’anxiety". Eysenck has suggested that
with respect to complex tasks, the relevant portion of the
variance of the scale is that related to neuroticism. This
hypothesis then, would relate neuroticism directly to the
Yerkes-Dodson law as a kind of multivariate personality var
iable interacting with the objective drive stimuli. There
is some evidence which would suggest this interpretation.
Bendig (1.957) found a correlation of' .77 between the TMAS
and the K. scale of the Maudsley Personality Inventory
(Eysenck, 1958; and Jensen, 1958). Franks C1956) found a
correlation, of .86 between anxiety as measured by the TMAS
and general neuroticism (.Guilford’s scales D &. C). Indirect
evidence also gives partial support from such findings as
the inferiority of neurotics as compared with normals,
matched for sex,-age, and intelligence, on complex motor
skills such as those involved in manual and finger dexterity
(Eysenck. 1947, 1952). Such differences in performance
could be rationalized in terms of the Yerkes-Dodson law and
might be regarded as a prototype of a whole group of perform
ances of a complex nature in. which neurotics have been found
The essence of the Yerkes-Dodson law is that
there is a decrease in the appropriate level of motivation
with increasing difficulty of a task. The studies reviewed
amply demonstrate that there is an optimum level of motiva-'
tion beyond which it has a deleterious effect on performance.
However,, the effect of task difficulty appears to have been
less systematically undertaken. The tasks involved in 12116
studies cited were ones of high complexity, and attention
was not focused on task difference. One exception was the
previously mentioned work of Saltz and Hoehn C1957). They
concluded from their results that T M A S scores are related to
difficulty level, rather than response competition, and,
suggest that greater difficulty imposes greater stress,, and,
therefore, releases potential energy. This view is consis
tent with the fourth hypothesis mentioned in ;the introduc
tion. The trend of research in. this area, however, has been
to deal with the, interaction of personality differences not
with task variables but with a set of experimental variables
which might all be regarded as falling in the general class
of experimental manipulation of anxiety arousal.
The problems in this study are Cl) to investigate
the interactive effects of the level of motivation (.specific
ally Anxiety) and the degree of neuroticism with the level
of task difficulty on performance; (2) to determine if there
25
is a significant difference between the level of anxiety and
degree of neuroticism in their effects on learning.
It is hypothesized in the light of the Yerkes-
Dodson law that:
1* The optimum level of motivation for a task
decreases with increasing a priori difficulty
of the task.
More specifically that: #
2, In simple tasks, low anxiety subjects will be
inferior In performance to high anxiety subjects..
2, In simple tasks, low neuroticism subjects will
be inferior in, performance to high neuroticism
subjects,
4* In difficult tasks, low anxiety subjects will
be superior in performance to high anxiety
subjects.
5» In difficult tasks, low neuroticism subjects
will be superior in performance to high
neuroticism subjects.
METHODOLOGY AND PROCEDURE
Experimental Sample
Sixty-four undergraduate female university students
from the University of Windsor were employed for this study,.
Initially one hundred and two Ss from an introductory psycho
logy class were randomly distributed into three groups from
which the first sixteen available Ssv in each group were
selected to participate In. the study. Later, when it was
decided to add another experimental group, 2 Ss were obtained
from the original group, 6 others from the same introductory
psychology class; the remaining S Ss were obtained from the
general female population of the university* The only
controls imposed in regard to subjects were that they were
between the ages of eighteen and twenty-five and that they
were naive concerning the apparatus employed and the theore
tical problem of concern in this study*
Testing Materials
The Taylor Manifest Anxiety Scale (TMAS) and the
Maudsley Personality Inventory (MPI) (see Appendix A) were
selected to measure the level of anxiety and the, degree of
-26—
2 7
neuroticism respectively, because of simplicity of adminis
tration and objective scoring system. The TMAS is composed
of fifty items from the Minnesota MultIphasic Personality ,
Inventory (MMPI) that clinicians have judged to be indica
tive of chronic anxiety. In the main, these items are one-
sentence descriptions of anxiety symptoms and the S is asked,
to indicate whether each is characteristic of him. The
measure of anxiety is the number of such symptoms to which
the S admits. The possible range of scores is from 0 to 50*
The MPI consists of forty-eight one-sentence items, twenty-
four of which make up the neuroticism scale, while the other
twenty-four items make up an extraversion scale. The develop
ment of the MPI; has been described in. great detail by
Eysenck (1958). The E and R scales of the MPI were derived
from rather elaborate procedures involving item analysis and
factor analysis of other personality inventories, principally
the Guilford inventory of factors S, T, D, C and R and the
Maudsley Medical Questionnaire. Although the whole of the .
MPI was given to all Ss the E scale was not employed in this
'investigation..
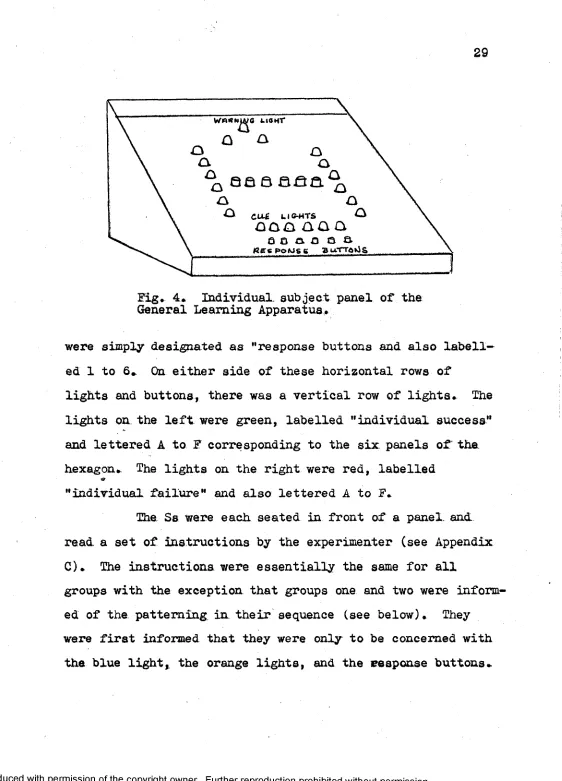
Experimental Procedure and Apparatus
The, TMAS and the MPI were administered to all
students, both males and females, in the introductory psycho
logy class of the. University of Windsor* Prom this group the
controls previously mentioned* The Ss* from this group,
who agreed to take part in the experiment proper, were run
on the learning apparatus, at a later date* The Ss who were
later obtained from the general female population of the
university* were administered the personality tests Just
before being given the learning task* The instructions
for the personality tests were read to the Ss, and are
presented I in Appendix. B*
The Ss were contacted either in person or by tele
phone and asked to participate, for approximately an hour,,
in an experiment being run in the Psychology department*
For those that agreed to participate, a time was then
arranged for them to come to the laboratory*
The Ss were ushered into the laboratory in which
there was six panels arranged around a hexagonal table, with
barriers between each subject's section. On each panel
there was an arrangement of lights and buttons (see Fig* 4)*.
At the top of the panel there was a blue warning light;
beneath this light, to the left and right of it, there was
a green light and a red light* labelled respectively "group
success" and "group failure". In xhe centre of the panel
there were two horizontal rows, of six lights and a horizontal
row of six buttons* The uppermost row of lights were white,
numbered 1 to 6, and labelled "stimulus lights", while the
second row was orange and labelled "cue lights"* The buttons
29
v/n«Ni&/G tianr
C U . B LIG-HTS *-»
q q q . a a a 0 0 0.0 o s
W es p o m s c a u .T T a*Js
Fig. 4. Individual, subject panel of the General Learning Apparatus.
were simply designated as "response buttons and also labell
ed 1 to 6* On either side of these horizontal rows of
lights and buttons, there was a vertical row of lights. The
lights on the left were green, labelled "individual success"
and lettered A to F corresponding to the six panels of the.
hexagon.. The lights on the right were red, labelled
O '
"individual failure" and also lettered A to F.
The. Ss were each seated in front of a panel, and.
read, a set of instructions by the experimenter (see Appendix
C). The instructions were essentially the same for all
groups with the exception that groups one and two were inform
ed of the patterning, in their sequence (see below). They
were first informed that they were only to be concerned with
The experimental procedure was then outlined* First the
blue light came on for two seconds; this light simply served
as a warning light and a pacer* Following this light, one
of the six orange lights came on for four seconds. The Ss
were told that their task was to learn which orange light
would be following the blue light and that they were to
indicate their choice by pressing a response button. The
Ss were allowed four seconds in which to make their response*.
The onset, offset, and duration times of the lights and the
inter-trial interval were preprogramed and automatically
\
controlled*. There were alternating test and training phases*
In the training phases the Ss received the blue light and
then the orange lights to respond to, while in the test
phases, they received only the blue light. It was explained
:1
to the Ss that they had to remember the sequence in which
the orange light s.'came on during the training phase and then
indicate this by pressing the response buttons in the same;
order or sequence. The Ss were also told that, during the:
test phase, they were not to press a button until the blue
light went out* The beginning of a test phase was to be
indicated by the sounding once of a buzzer, while the beginn
ing of the training phase was indicated when the buzzer sound
ed twice. The Ss were then given the instructions to read
over and any questions were answered. When the experimenter
i ,
felt that the: Ss understood the task required, the experiment
31
waa then begun, commencing with a test phase*
The Ss were divided at random into four groups;
to. each group a task of different a priori difficulty was
assigned*. Task difficulty was measured by the number of
possible alternative responses, consistent with the instruc
tions* To take, a simple example, consider a subject who is
told that he Is to learn to press six buttons in a random,
sequence, with the only restriction being that no button is
to be pressed more than once in the sequence of six* For his
first response, he has six possibilities; for his second,
five; and so on, for a total difficulty measure of 6 + 5 + 4
+ 3 + 2 + 1 = 21* If he has to learn two such sequences,
each independent of the other, he will have a difficulty
measure of 2 r 21 = 42; and for three independent sequences,
the difficulty will be 3 x 21 = 63*
If, however, he is also told to consider the res
ponse sequence divided into two halves, the responses of
pressing buttons 1, 2, and 3 being one half, and 4, 5, and 6
being the other; and further, that no two consecutive res
ponses are to fall in the same halves, or sub-sets: his
possible responses are six for the first, three for the
second, two. for the third and fourth, and one for the fifth
and sixth. For such a restricted sequence of six, the
difficulty measure will be 6 + 3 + 2 + 2 + 1 + 1 = 15 • For
but for two such, sequences,, when the second is a replica of
the first, the difficulty will also be taken as 15*
In. the present experiment, the task difficulties
were
a) level 1 - two restricted but repeated sequences (difficulty 15)*
b.) level 2 - two restricted, independent sequences (difficulty 30)*
c.). level 3 — two random, independent sequences (difficulty 42).
d) level 4 - three random, independent sequences (difficulty 63)*
/
Twelve consecutive correct responses were required at the
first three levels; eighteen were required for the more
difficult task.
On the basis of the, scores obtained on the TMAS,
each of the experimental groups was further subdivided into
a high anxiety and aJlow anxiety group* The median was em
ployed to. distinguish the two groups. The Ss in each exper
imental group were also redistributed into high neuroticism
and low neuroticism groups* The median for the scores of
each group on the MPI was employed to distinguish the Ss on
this basis.
In each experimental session, a preliminary test
phase (no cue lights) preceded the first training phase*
Through this procedure, the naivete of the Ss concerning the
sequence employed, was established. The sequences of
33
numbers used for the four experimental groups are presented
in Appendix D.
From one to three Ss, depending on the number able
to participate at each session, were run on the learning
apparatus. In each session, the experiment was run until
each S correctly completed the sequence one during a test,
PRESENTATION. AND; ANALYSIS OF RESULTS
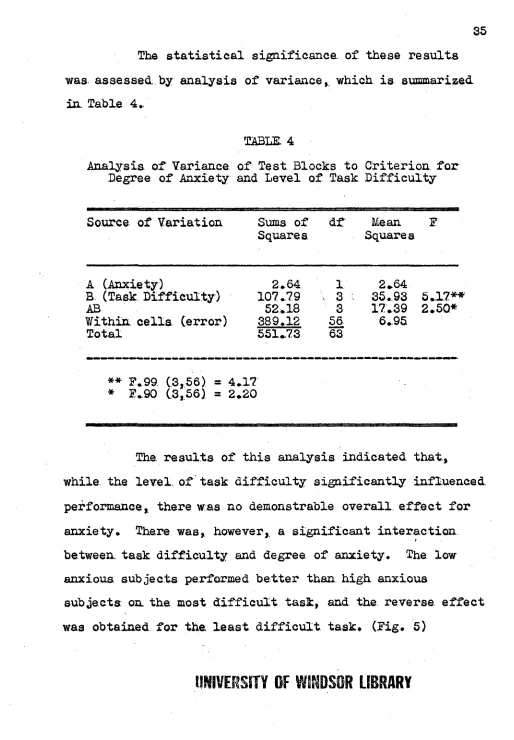
Since this study was concerned with investigating
the effects of anxiety and neuroticism on task difficulty in.
serial learning, a test for correlation waa first performed
on the scores obtained, from the TMAS and MPI,. The correla
tion coefficient between anxiety and neuroticism was .79, .
This score compares favourably with \other research presented
in the literature. CBendig, 1957).
The primary data consisted of the number of test
blocks required by each S to reach a criterion, which was pre
established as the first correct completion, of the sequence.
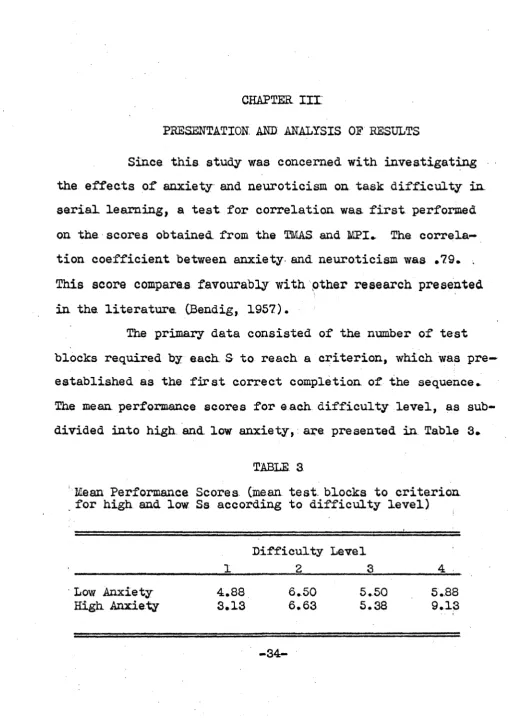
The mean performance scores for each difficulty level, as sub
divided into high and. low anxiety,; are presented in Table 3.
TABLE 3
Mean Performance Scores, (mean test, blocks to criterion . for high and low Ss according to difficulty level)
Difficulty Level
1 2 3 4
Low Anxiety 4.88 6.50 5.50 5.88
High Anxiety 3.13 6.63 5.38 9.13
The statistical significance, of these results
was assessed by analysis of variance,, which is summarized
in Table 4.,
TABLE. 4
Analysis of Variance of Test Blocks to Criterion for Degree of Anxiety and Level of Task Difficulty
Source of Variation Sums of df Mean Squares Squares
A (Anxiety) 2.64 1 2.64
B (Task Difficulty) 107.79 \ 3 ; 35.93 5.17**
AB 52.18 3 17.39 2.50*
Within cells (error) 389.12 56 6.95
Total 551.73 63
** F.99. (3.56) - 4.17 * F.90 (3,56) = 2.20
The: results of this analysis indicated that,
while, the level, of task difficulty significantly influenced
performance, there was no demonstrable overall effect for
anxiety. There was,, however, a significant interaction
between task difficulty and degree of anxiety. The low
anxious, subjects performed better than high anxious
subjects on the most difficult task, and the. reverse effect
P fR F O R H R N te -S C O R 6 S ( M E f t I O T E S T B E O C K S T o tR l T e tt lo K j) 10 <*■' s -y *
3 •
— Low .Anxiety — High Anxiety
/
/
T-t a. J
u e v e u o f i x F F i c u u t y
Fig, 5 The effects of anxiety and task difficulty on performance.*
37
Tests were carried out for the effects of anxiety
at each, difficulty level and similarly for the effects of
task difficulty at each level of anxiety* The results of
this analysis are presented in Table 5*
TABLE: 5
Analysis of Variance for Simple Effects of Anxiety and: Task Difficulty
Source of Variation. Sums: of df Mean. E Squares Squares
A for B]_ (Anxiety for 1st. level of difficu3 A for B2
A for Bg A for B a
B. for aJ (Difficult
for low anxiety) B. for Ag
Within
12.25 0
1 12.25 1.76
.25 1. .25 .04
.07 1 .07 .01
42.25 I. 42.25 6.08*
9.60 3 3.20 ' .46 150.37 3 50.12 7.21**
389.12 ' 56 6.95
* ■ F. 95 (1, 56) = 4.02 ** F. 99 (3, 56) = 6.27
— — M M B B J l ' J . l . J l I ML. "JLJ11B"■ ^LU!1 LJg . « « ■ - J - U L a M B a i
« The results indicate that, the effect of anxiety
was significant only at the most difficult- level, although,
there, was a trend toward significance for the egfect of
anxiety on. the least difficult task. As regards difficulty
level, the results indicated that this factor was signifi
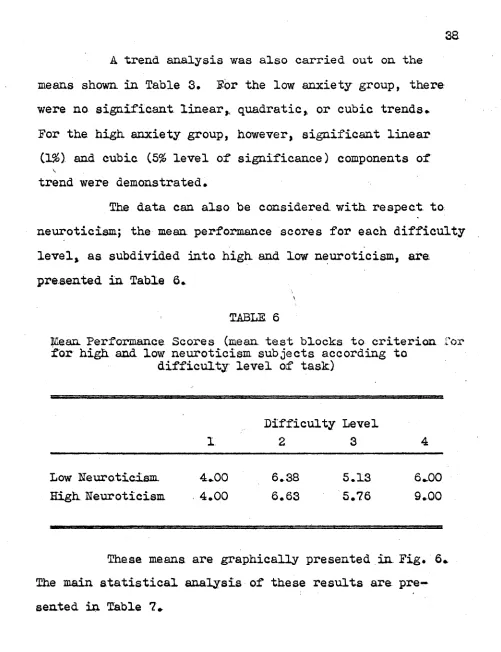
A trend analysis was also carried out on the
means shown in Table 3* For the low anxiety group, there
were no significant linear,, quadratic, or cubic trends*
For the high anxiety group, however, significant linear
Cl#). and cubic (5% level of significance) components of
trend were demonstrated.
The data can also be considered with respect to
neuroticism; the mean performance scores for each difficulty
level, as subdivided into high and low neuroticism, are
presented in Table 6*
\
TABLE 6
Mean Performance Scores (mean test blocks to criterion for for high and low neuroticism subjects according to
difficulty level of task)
Difficulty Level
1 2 3 4
Low Meuroticism 4*00 6*38 5.13 6*00 High Eeuroticism 4.00 6.63 5.76 9.00
These means, are graphically presented in. Fig. 6*
The main statistical analysis of these results are pre
sented in Table 7*
P E T R F < iR .M l= * N IC r S C O R E ’S ( M e f lU T E S T B L O C K S T O C r it e r io n ) 39;
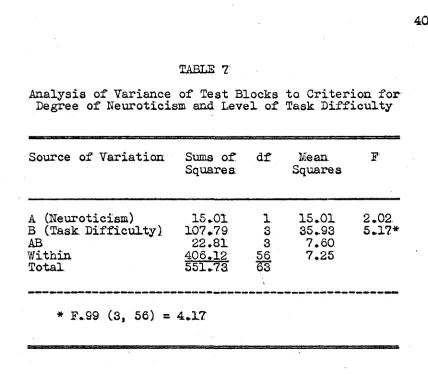
Analysis of Variance of Test Blocks to Criterion for Degree of Neuroticism and Level of Task Difficulty
Source of Variation Sums of Squares
df Mean. Squares
F
A (Neuroticism) 15*01. 1 15*01 2*02 B (Task. Difficulty) 107*79 3 35*93 5*17*
AB 22.81 3 7.60
Within 406*12 56 7.25
Total 551*73 $3
V
* F..99 (3, 56) = 4*17
CHAPTER IV
DISCUSSIOH OP RESULTS
Research. Hypotheses Reconsidered
The hypotheses underlying this study were stated
as follows in Chapter 1:
1* The optimum level of motivation for a task decreases with increasing, a priori difficulty
of the task*
2* On simple tasks, low anxiety subjects will be inferior in performance' to high anxiety
subjects.
3* On simple tasks, low neuroticism subjects will be inferior in performance to high neuroticism subjects.
4* On difficult tasks, low anxiety subjects will be superior in performance to high anxiety subjects.
5. On difficult tasks,-low neuroticism subjects will be superior in performance to high
neuroticism subjects.
Only in part, did- the. re suits obtained; in this study
support the hypotheses outlined above. The fourth hypothesis
was statistically confirmed, that is, on difficult tasks, low
anxiety subjects were significantly superior in performance
to high anxiety subjects. In regard to the second hypothesis,
the low anxiety subjects were inferior in performance to
high anxious subjects, however, this hypothesis was not
-41-statistically significant*. Similarly, the fifth hypothesis
was not statistically confirmed, although the results were
in the predicted direction* In contradiction to the third
hypothesis, on simple tasks, there was no distinction be
tween high and low neuroticism subjects*
The results of the present study seem to fit
neatly into place with the earlier findings of Spence and
his co-workers. They found, It will be recalled, that high,
anxious subjects condition more rapidly, but were slower in
serial verbal learning. In terms of the present concept of
a priori difficulty (as measured by the number of possible
alternative responses), eyelid conditioning Is a learning
task of much lower level of difficulty than any employed
here. On the other hand, his serial learning tasks are prob
ably more difficult (their exact measure possibly depending
on S's vocabulary size and a priori familiarity with nonsense
syllables). ( The tentative hypothesis might then be advanced
9
that even the simplest of the present trials was still too
difficult to admit of any significant superiority in per
formance. for subjects with high anxiety*
Results Considered In Relation to the Yerkes-Dodson Law
The results of this study on the whole support the
Yerkes-Dodson law as an empirical statement of the relation
ship between motivation and task difficulty* Problems arise,
43.
however, when an. attempt is made to., elucidate the underlying
mechanisms which bring about the results covered, in the.
Xerkes-Dodson law. As indicated earlier, the position of
the experimenter is that the five hypotheses outlined in the
first chapter are. subsumed under this law and provide some
explanation for the causal influences that result. The
deterioration in. performance resulting from (a) an increase,
in motivation beyond an optimum, (b) an increase in task
difficulty, or (c) a combination of both, could, following
Spence and Taylor, be at least partly due to an increase in
task-incorrect, responses. The difficulty with this hypo
thesis, especially in regard to serial learning, is that the
experimenter has no way of measuring the relative strengths
of the competing responses. Similarly, in. regard to the
hypothesis put forward, by Handler and Sarason, it is granted
that such, distracting, task-interfering responses will occur.
However, it is difficult to know when and to. what extent
they function in. a particular situation. In serial learning
situations, one can not be certain if the decrement in per
formance was due, even partly, to greater task-interfering
responses on the part of more anxious subjects. These situa
tions simply do not permit, the separating, of the role played
by this factor and that of drive level per se.
From the. studies reviewed earlier it appears that
drive variable, only when threatening or noxious stimuli
are present,. Where anxiety as measured by the TMAS: does,
show an effect, it is. always compared, to the effect of
threat-induced, anxiety. The fourth hypothesis appears to-
be the. most relevant to this, study. This hypothesis once
again is that there exists a stable curvilinear relationship
between drive and efficiency with a stable optimum drive
value but that increasing task difficulty increases drive
and thereby produces a decrease in the quality of perform-,
ance. Tikis appears, then,, to be the underlying mechanise
involved in this study, that is, that theiincreasing diffi
culty of the task imposed greater stress, generated increased
anxiety and thereby adversely affected performance. Task-r 1
incorrect, responses and/or task-irrelevant responses pro
duced by the anxiety would be taken as the specific manner,
in which the increased motivation adversely affected motiva
tion. For the low anxiety subjects, the.ir--pre-task drive
level was so low that the increase in task difficulty was ,
not sufficient to generate enough anxiety to adversely affect
performance. For the high anxiety subjects, on the other
hand, their pre-task drive level was so high that for the i-
difficult task, group the level of motivation was increased■
beyond, the optimum level of drive resulting in a deteriora
tion of performance.
45
It can be argued that the type of anxiety that
has drive properties may always be brought on. by the situa
tion and that its effects can not be studied or even demon
strated unless it is. aroused in. relation to the phenomena:,
under consideration. The anxiety that originally caused or
perhaps sustained neurotic symptoms may not be a relevant
drive in the laboratory experiment. If anxiety is an
emotional reaction, It should be reflected in certain auton
omic reactions. Thus if physiological activity Is the key
to distinguishing high drive from low drive subjects, then
direct physiological measurements would appear not only
preferable but necessary. Unfortunately, the appropriate
physiological indices are not available.
In summary,, support was found in this study for
the hypothesis-that the optimal level of motivation for a
task decreases with increasing difficulty of 'the task.
However, the relative difficulty of the experimental task
is clearly of importance in. determining the nature and
direction of group differences in learning, and appears to
be the. most important single factor. It is felt that
although, the validity of the Yerkes-Bodson law has been con
SUMMARY AND. CONCLUSIONS
This study attempted to demonstrate the valid
ity of the Yerkes-Dodson law as applied to human serial
learning; the law, in essence, states that the optimum level
of motivation for a task decreases with increasing diffi
culty of a task. The level of motivation was measured in.
terms of anxiety by the Taylor Manifest Anxiety Scale, and in
terms of neuroticism by the Maudsley' Personality Inventory.
Sixty-four female undergraduate college students
participated in. this study. They were first given the TMAS
and the MPI, and. on. the basis of the TMAS scores, the sub
jects were split into four experimental groups. These four
groups were distinguished on the basis of the difficulty of
a sequence of numbers which, they were required to learn.
The experimental procedure employed, was that each
subject was brought into a laboratory and seated in front of
a panel, on which there were, a row of numbered lights and a
corresponding row of numbered buttons. The subjects were,
told that they were required to learn a sequence of numbers.
This sequence was indicated to the subjects through the
lights flashing in a certain order. The subjects indicated
- 46
that they were learning the sequence by pressing a button,
corresponding to eachi light in the same order that the
lights flashed.
Analysis of variance revealed that there was a
significant interaction (.01 level of confidence) between
anxiety and task difficulty, but not between neuroticism
and task difficulty. The data revealed that for an easy task,
high anxiety subjects were superior in performance on a serial
learning task than were low anxiety subjects. However, on a
difficult task, the low anxiety subjects were superior in
performance to the high anxiety subjects. Thus the general
hypothesis that with increasing task difficulty the optimum
level of motivation decreases, was confirmed.
In conclusion, it was felt that this study has
demonstrated the need for further research into the1 relation
ship of level of motivation to task difficulty in human
learning and it is suggested that the most appropriate
Taylor Manifest Anxiety Scale.
1. X believe I. am no more nervous than most others. Tv F
2* X work, under a great deal of tension.* T P
3* X can not keep my mxnd on one thing. T F
4*. I am more sensitive than most other people. T F
5.. I frequently find myself worrying about. T F something.
6. I am usually calm and not easily upset. T. F
7* I feel anxiety about someone or something T F almost all the: time .
8. X am happy most of the time- ' T F
9. I have periods of such great restlessness that T F I can not sit long in a chair*
XQ* I have sometimes felt that, difficulties were X F piling up so high that I could not overcome them.
II.. My sleep is fitful, and disturbed. T F
12* I am not usually self-conscious* T F
13. I am inclined to take things hard. T F
14. Life Is a strain for me much of the. time. X F
15. At times X think that X am no good at all. X F
16. I am certainly lacking In self-confidence. X F
17. I do not tire quickly. X F
18. I have few headaches. T F
19. X frequently notice, my hand shakes, when I try T F to da something.
20* I worry quite a bit over possible misfortunes. T. F
21. X am very seldom troubled by constipation. X. F