Patron: Her Majesty The Queen Rothamsted Research Harpenden, Herts, AL5 2JQ
Telephone: +44 (0)1582 763133 Web: http://www.rothamsted.ac.uk/
Rothamsted Research is a Company Limited by Guarantee Registered Office: as above. Registered in England No. 2393175. Registered Charity No. 802038. VAT No. 197 4201 51. Founded in 1843 by John Bennet Lawes.
Rothamsted Repository Download
A - Papers appearing in refereed journals
Veerkamp, R. F. and Thompson, R. 1999. A covariance function for feed
intake, live weight and milk yield estimated using a random regression
model. Journal of Dairy Science. 82 (7), pp. 1565-1573.
The publisher's version can be accessed at:
•
https://dx.doi.org/10.3168/jds.S0022-0302(99)75384-1
The output can be accessed at: https://repository.rothamsted.ac.uk/item/88148.
© 7 July 1999, Elsevier Science Inc.
1999 J Dairy Sci 82:1565–1573 1565
Received October 21, 1998. Accepted March 4, 1999. 1Corresponding author.
Estimated Using a Random Regression Model
R. F. VEERKAMP*,1 and R. THOMPSON†
*Department of Animal Breeding and Genetics, DLO-Institute for Animal Science and Health, PO Box 65, 8200 AB Lelystad, The Netherlands
†Statistics Department, Institute of Arable Crops Research,
Harpenden, Hertfordshire AL5 2JQ, United Kingdom
ABSTRACT
To enable investigation of genetic variation during early lactation in heifers, multitrait covariance func-tions were used to describe genetic covariances among feed intake, live weight, and milk yield during the first 15 wk of lactation ( n = 628). Random regression models were used to estimate covariance functions for the additive genetic and permanent environmental effects. Fixed effects were date of the week that records were collected, a group effect, and week of lactation. Second or third order polynomials were sufficient to describe the additive genetic variation for milk yield, dry matter intake, and live weight during the first 15 wk of lactation. Estimates for the genetic covariance function demonstrated that a high milk yield is only moderately correlated with high feed intake (0.21) but is very strongly correlated to an increase of intake and a loss of live weight during the first 15 wk of lactation. Levels of weight and intake were correlated strongly (0.81). The reduced fit covariance function was used to estimate genetic correlations between traits at different lactation stages. Estimates for the genetic correlations between wk 1 and 15 were 0.62, 0.24, and 0.79 for milk yield, dry matter intake, and live weight, respectively. Feed intake during early lactation was negatively cor-related with milk yield, but feed intake during the later weeks was positively correlated with milk yield. The implication is that when selection is for a linear combination of milk yield, feed intake, and live weight (i.e., energy balance or efficiency), it is impor-tant to consider when each trait is measured during lactation.
(Key words: random regression, genetic correla-tions, feed intake, live weight)
Abbreviation key: CF= covariance function, LW= live weight, MY = milk yield.
INTRODUCTION
Energy balance seems to have an implicit economic value because negative energy balance is generally related to poorer health and fertility (1, 5), and the magnitude of the energy deficit during the first 2 to 3 wk after calving is closely correlated with the interval to first estrus (14). Also, considerable genetic varia-tion is apparent in energy balance. The genetic corre-lation with milk yield (MY) is such that selection for MY alone results in a more negative energy balance during early lactation (19), which might explain the importance of energy balance for dairy cattle breed-ing.
Heritabilities are moderately high, and genetic correlations are also moderate among DMI, MY, and live weight (LW) . Hence, genetic improvement of energy balance should be straightforward. However, several complications arise when deciding which trait to measure at what time during lactation. For exam-ple, both duration and magnitude of energy deficit might be important for energy balance. Also, DMI during early lactation might be a different trait from DMI during later lactation; Koenen and Veerkamp ( 1 0 ) found genetic correlations below zero between DMI during early and late lactation. Furthermore, the effects of body tissue mobilization during early lactation lead to further complications. For example, correlations between MY and LW vary depending upon when LW is measured (18), probably because of the genetic association of body condition score with both LW and MY (20). Hence, these complications seem to suggest that genetic variation for traits related to energy balance should be investigated as a function of lactation stage (e.g., the genetic correla-tion between MY and DMI at different lactacorrela-tion stages), and use of means over time might not reflect all genetic (co)variation accurately.
Journal of Dairy Science Vol. 82, No. 7, 1999
VEERKAMP AND THOMPSON
1566
large number of possible traits, 2 ) no account is taken of the ordering and spacing of records in time, and 3 ) biological interpretation of a large number of correla-tions is often difficult. Furthermore, correlacorrela-tions are often high between measures with short time inter-vals and, therefore, models are often overparameter-ized. The use of covariance functions (CF) (8, 9 ) overcome some of these disadvantages because the functions provide a more parsimonious description of the full covariance matrix. For dairy cattle, Veerkamp and Goddard ( 2 2 ) applied CF methodology to the (co)variance matrix for MY and fat and protein yields across two trajectories: lactation stage and herd yield level. However, these authors were not able to estimate the CF directly from the data as suggested by Meyer and Hill (12). Others ( 1 0 ) were able to apply this method ( 1 2 ) to estimate CF for DMI, LW, and condition score in first lactation heif-ers. However, records were still treated as if different lactation stages were different traits (albeit account-ing for the spacaccount-ing and orderaccount-ing of records while reducing the order of the full matrix). The disadvan-tages were that computational limitations did not allow all lactation stages to be included in the analy-sis and that estimates for the fixed effect levels were different for each lactation stage. Random regression models ( 1 6 ) can overcome these disadvantages and are further equivalent to the CF methodology (17). To investigate potential strategies to use genetic selection for the improvement of the negative energy balance during early lactation, genetic parameters are required for MY, LW, and DMI during early lacta-tion. Hence, the objective of this study was to esti-mate genetic (co)variances between these traits over the first 15 wk of lactation for first lactation heifers. Because only a limited data set was available, the second objective was to find a parsimonious CF to describe these (co)variances, estimated using a ran-dom regression model.
MATERIAL AND METHODS
Data
Weekly records for MY, LW, and DMI were availa-ble on Holstein heifers for the first 15 wk of lactation. Heifers calved between October 1991 and 1997 and were fed ad libitum a total mixed ration of artificially dried grass, corn silage, and concentrates (6:5:10). Heifers that were of high genetic merit were from the Delta testing program (Holland Genetics, Arnhem, The Netherlands), and those of medium genetic merit originated from the experimental farm of the Insti-tute for Animal Science and Health (ID-DLO;
Lelystad, The Netherlands). For MY, DMI, and LW; 8946, 9004, and 8611 weekly records were available, respectively. The smaller number of records for LW was due to only a few heifers being weighed in the first lactation week. In total, 628 heifers had records, and the pedigree contained 1540 unique animals and traced back at least three generations.
Analyses
Estimates of variance components were obtained using ASREML software ( 3 ) . Two different types of analyses were performed. First, a conventional analy-sis was performed wherein each week of lactation for MY, DMI, and LW was treated as a different trait to obtain indicative values for the variance components. Second, records at different lactation stages were treated as if they were on a continuous scale, and random regressions models were used to estimate a parsimonious CF (8, 9, 16).
Multitrait analysis. Additive genetic and residual variances were estimated in 45 single-trait analyses (15 wk × 3 traits). Next, 990 bivariate analyses were performed to estimate the genetic (co)variances between these traits. The model in-cluded a random animal effect and the additive genetic relationship matrix plus fixed effects for year-season of calving (each year contained four year-seasons) and genetic group (heifers from Delta or ID-DLO).
CF. The second type of analysis treated repeated records for the same trait as if they were on a con-tinuous scale (i.e., lactation stage). To estimate such a CF, random regression models were used: first for MY, DMI, or LW separately and then for a combina-tion of the three traits simultaneously. For each trait, the mean lactation curve was fitted as a week of lactation effect, and additive genetic or permanent environmental deviations from this curve were esti-mated using the random regression coefficients. The (co)variance matrix for the random regression coeffi-cients represents the CF (17). The model fitted was as follows:
Yijkq = m + groupi + seasonj + wkk + Faq(wkk) +
Fpq(wkk) + eijkq
where
Yijkq = observation for milk, LW, or DMI on
animal q at lactation stage k, m = mean for all observations,
groupi = genetic group (Delta or ID-DLO), seasonj = date of week that measurement was
taken ( n = 345),
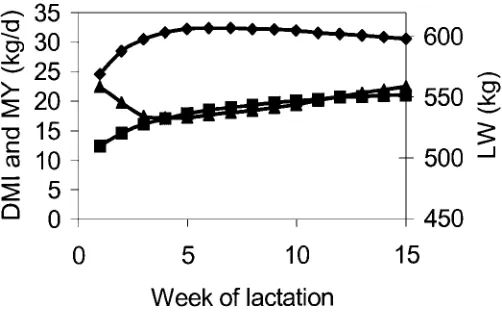
Figure 1. Mean lactation curves for DMI (⁄) , live weight (LW; π) , and milk yield (MY; ♦) during the first 15 wk of lactation of 628 first lactation cows.
Faq(wkk) = function for the random additive genetic effect for animal q (described later),
Fpq(wkk) = function for the random permanent
environmental effect, and eijkq = random residual term.
Rather than fitting a function with a predefined shape, orthogonal polynomials ( 9 ) were used for both the additive genetic and permanent environmental CF:
Faq(wkk) = mq + bq 1 N1(wkk) + . . . .
+ bq n Nn(wkk)
mq = level effect of animal q
N1(wkk) . . .
Nn(wkk)
= coefficients of orthogonal polynomi-als of wkk of order n
bq 1 . . . bq n = random regression coefficients for
animal q
To find the most parsimonious CF, the order of fit for both the additive genetic and permanent environ-mental effects was increased from level only (denoted as L1) to polynomials of order 4 (denoted as L4). Models are named as LnLn, giving the order of fit for the genetic and permanent environmental CF, respec-tively. Different orders of fit were compared using the standard error of the variance components (test statistic = component/SE; when test statistic >2, the hypothesis that the component = 0 is rejected) and the likelihood of nested models.
To investigate how genetic correlations between MY, DMI, and LW varied with lactation stage, a CF was estimated for all three traits simultaneously. The same model was used as described for the univariate analysis, but covariances between the function parameters for different traits were included. Order of fit for the additive genetic and permanent environ-mental effects were determined from the univariate CF.
RESULTS
The means for MY, DMI, and LW were 29.9 kg/d, 18.5 kg/d, and 520 kg, respectively, and mean lacta-tion curves for MY, DMI, and LW are given in Figure 1. Estimates for variance components at different weeks of lactation are erratic (Table 1 ) because of large standard errors.
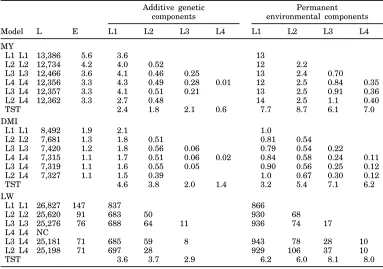
Estimates of the variance components for different order CF are given in Table 2. When level only was fitted (assuming a constant (co)variance for all lacta-tion stages) genetic variances were estimated to be 3.6, 2.1, and 837 for MY, DMI, and LW, respectively.
When models were extended to the fourth order for both the permanent environmental effect and the ad-ditive genetic effect, the log likelihood improved sig-nificantly. However, this phenomenon was primarily due to the permanent environmental effects. For the additive genetic effects, lower orders were sufficient: second or third order for MY and DMI and third order for LW. Fit of the permanent environmental effect of order four during a fit of a second order function to the genetic effect seemed inappropriate because some of the genetic variance was then partitioned to the permanent environmental effect. For example, for MY the variance component for level ( L 1 ) is reduced from around 4.0 to 2.7.
These CF could be used to estimate (co)variances for all 15 wk of lactation. This method was applied to the first four models for each trait presented in Table 2. Genetic variances for the first 15 wk of lactation are compared in Figure 2 with the additive genetic variances estimated in the univariate analysis. Genetic variances seemed to approximate the univari-ate estimunivari-ates reasonably well, especially for the higher order fits. The DMI estimates of the variances of the CF were slightly higher than the univariate estimates, especially during late lactation. Further-more, genetic correlations between different lactation stages were calculated using the third order CF (Ta-ble 3). These correlations approximate the genetic correlations from the bivariate analyses closely, although only a three by three symmetric matrix is estimated to describe the full 15 by 15 symmetric matrix. The correlation for DMI measured 14 wk apart is only 0.24, but estimates for MY and LW are 0.62 and 0.79, respectively.
Journal of Dairy Science Vol. 82, No. 7, 1999
VEERKAMP AND THOMPSON
1568
TABLE 1. Univariate estimates for the additive genetic variance ( A ) , residual variance ( E ) , and heritability ( h2) for milk yield (MY), DMI, and live weight ( L W ) at each lactation week.
MY DMI LW
wk A E h2 A E h2 A E h2
1 3.3 11.8 0.22 1.6 3.4 0.32 . . . .
2 2.2 17.9 0.11 1.4 3.9 0.27 648 1185 0.35
3 3.9 18.1 0.18 1.1 3.8 0.23 695 1089 0.39
4 5.9 16.3 0.27 0.6 3.9 0.13 651 1047 0.38
5 4.5 18.6 0.20 1.3 3.0 0.31 652 1001 0.39
6 3.7 20.9 0.15 1.5 2.4 0.39 693 1001 0.41
7 4.1 18.5 0.18 1.5 2.3 0.40 476 1145 0.29
8 5.5 17.6 0.24 1.4 2.7 0.33 568 1100 0.34
9 6.8 15.2 0.31 2.3 1.9 0.54 793 906 0.47
10 5.9 15.6 0.27 0.9 3.1 0.23 690 1051 0.40
11 6.0 15.0 0.29 1.7 2.1 0.44 677 1043 0.39
12 7.6 14.4 0.35 0.9 3.2 0.22 803 1020 0.44
13 5.4 14.8 0.27 1.4 2.9 0.33 775 1039 0.43
14 4.0 16.9 0.19 1.0 3.4 0.23 719 1134 0.39
15 4.0 16.6 0.19 1.0 3.5 0.23 715 1063 0.40
TABLE 2. Log likelihood ( L ) , residual variance ( E ) , and variance components1 for models with different orders of fit2 for milk yield (MY), DMI, and live weight (LW).
1Covariances between the additive genetic and between the permanent environmental components were estimated but are not presented here.
2Test statistics (TST) are the estimate divided by the standard error for highest order model. Different random regression models are indicated by order of fit for additive genetic and permanent environmental effects respectively (i.e., L2L2 fits level and slope for both effects). NC = No conver-gence.
Additive genetic Permanent components environmental components
Model L E L1 L2 L3 L4 L1 L2 L3 L4
MY
L1 L1 13,386 5.6 3.6 13
L2 L2 12,734 4.2 4.0 0.52 12 2.2
L3 L3 12,466 3.6 4.1 0.46 0.25 13 2.4 0.70
L4 L4 12,356 3.3 4.3 0.49 0.28 0.01 12 2.5 0.84 0.35 L3 L4 12,357 3.3 4.1 0.51 0.21 13 2.5 0.91 0.36
L2 L4 12,362 3.3 2.7 0.48 14 2.5 1.1 0.40
TST 2.4 1.8 2.1 0.6 7.7 8.7 6.1 7.0
DMI
L1 L1 8,492 1.9 2.1 1.0
L2 L2 7,681 1.3 1.8 0.51 0.81 0.54
L3 L3 7,420 1.2 1.8 0.56 0.06 0.79 0.54 0.22
L4 L4 7,315 1.1 1.7 0.51 0.06 0.02 0.84 0.58 0.24 0.11 L3 L4 7,319 1.1 1.6 0.55 0.05 0.90 0.56 0.25 0.12
L2 L4 7,327 1.1 1.5 0.39 1.0 0.67 0.30 0.12
TST 4.6 3.8 2.0 1.4 3.2 5.4 7.1 6.2
LW
L1 L1 26,827 147 837 866
L2 L2 25,620 91 683 50 930 68
L3 L3 25,276 76 688 64 11 936 74 17
L4 L4 NC
L3 L4 25,181 71 685 59 8 943 78 28 10
L2 L4 25,198 71 697 28 929 106 37 10
TST 3.6 3.7 2.9 6.2 6.0 8.1 8.0
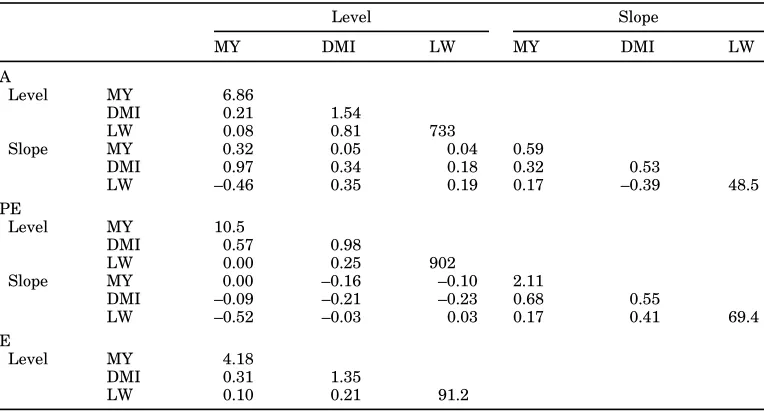
effects converged. High MY are associated with cows that have a high level of intake ( rg = 0.21), that
increase their intake ( rg= 0.97), and that lose weight
( rg = –0.46) during the first 15 wk of lactation. A
high weight is correlated with a high level of intake
during the measured period (0.81) but not with level or persistency of MY.
TABLE 3. Comparison of genetic correlation estimated by separate bivariate analysis for each correlation or by single trait covariance functions (third order polynomial for both the additive genetic and permanent environmental effects) for milk yield (MY), DMI, and live weight (LW).
Bivariate analyses Covariance function
MY 1 3 5 7 9 11 13 1 3 5 7 9 11 13
3 0.89 0.92
5 0.94 0.99 0.83 0.98
7 0.99 0.94 1.00 0.77 0.95 0.99
9 0.78 0.96 1.00 0.93 0.73 0.93 0.98 1.00
11 0.75 0.88 1.00 0.97 1.00 0.70 0.90 0.96 0.98 0.99
13 0.55 0.90 0.96 0.85 1.00 1.00 0.67 0.85 0.91 0.94 0.96 0.99
15 0.55 0.82 0.88 0.74 0.97 0.96 0.98 0.62 0.75 0.79 0.82 0.86 0.91 0.97
DMI 1 3 5 7 9 11 13 1 3 5 7 9 11 13
3 0.95 0.93
5 0.49 0.88 0.74 0.94
7 0.43 0.83 0.99 0.55 0.82 0.97
9 0.37 0.82 1.00 0.99 0.41 0.72 0.92 0.99
11 0.20 0.80 0.98 1.00 0.93 0.32 0.65 0.87 0.97 0.99
13 0.22 0.80 0.95 0.93 0.89 0.93 0.26 0.60 0.84 0.95 0.99 1.00
15 –0.24 0.66 0.87 0.87 1.00 0.95 0.87 0.24 0.59 0.82 0.94 0.98 0.99 1.00
LW 1 3 5 7 9 11 13 1 3 5 7 9 11 13
3 . . . 0.98
5 . . . 0.98 0.93 0.98
7 . . . 0.97 1.00 0.85 0.94 0.99
9 . . . 0.90 0.99 1.00 0.80 0.90 0.97 0.99
11 . . . 0.88 0.97 0.98 0.99 0.76 0.87 0.95 0.99 1.00
13 . . . 0.92 0.99 1.00 1.00 1.00 0.76 0.87 0.95 0.99 1.00 1.00
15 . . . 0.89 0.99 0.99 0.99 0.99 1.00 0.79 0.89 0.96 0.99 1.00 1.00 1.00
TABLE 4. Estimates for the additive genetic ( A ) , permanent environmental (PE), and residual variance ( E ) components using the second order covariance function for milk yield (MY), DMI, and live weight ( L W ) (variance on the diagonal; correlations on the off-diagonals).
Level Slope
MY DMI LW MY DMI LW
A
Level MY 6.86
DMI 0.21 1.54
LW 0.08 0.81 733
Slope MY 0.32 0.05 0.04 0.59
DMI 0.97 0.34 0.18 0.32 0.53
LW –0.46 0.35 0.19 0.17 –0.39 48.5
PE
Level MY 10.5
DMI 0.57 0.98
LW 0.00 0.25 902
Slope MY 0.00 –0.16 –0.10 2.11
DMI –0.09 –0.21 –0.23 0.68 0.55
LW –0.52 –0.03 0.03 0.17 0.41 69.4
E
Level MY 4.18
DMI 0.31 1.35
LW 0.10 0.21 91.2
traits matched those of the univariate CF; therefore, genetic correlations between the traits only are given (Table 5). With the exception of correlations between MY and LW, estimates of the CF approximated the
Journal of Dairy Science Vol. 82, No. 7, 1999
VEERKAMP AND THOMPSON
1570
TABLE 5. Genetic correlations between milk yield (MY), DMI, and live weight ( L W ) measured at different stages of lactation (weeks) and estimated using bivariate analysis and a multitrait covariance function (CF).
Bivariate analysis Multitrait CF
MY 1 3 5 7 9 11 13 15 1 3 5 7 9 11 13 15
DMI 1 –0.77 –0.51 –1.00 –0.53 –0.32 –1.00 –0.85 –0.62 –0.44 –0.46 –0.47 –0.48 –0.48 –0.48 –0.47 –0.46 3 –0.46 –0.58 –0.68 –0.33 –0.40 –0.14 –0.15 –0.37 –0.27 –0.28 –0.29 –0.30 –0.30 –0.30 –0.30 –0.29 5 0.50 –0.24 –0.20 0.06 0.01 0.03 0.20 0.02 –0.08 –0.08 –0.09 –0.09 –0.09 –0.09 –0.09 –0.09 7 0.67 0.38 0.38 0.24 0.29 0.30 0.44 0.32 0.12 0.12 0.12 0.12 0.12 0.11 0.11 0.11 9 0.43 0.21 0.31 0.26 0.35 0.42 0.42 0.47 0.28 0.29 0.29 0.30 0.29 0.29 0.28 0.28 11 0.43 0.44 0.21 0.35 0.17 0.21 0.31 0.18 0.42 0.43 0.44 0.44 0.44 0.44 0.43 0.42 13 0.60 0.56 0.41 0.44 0.45 0.43 0.37 0.35 0.52 0.54 0.55 0.56 0.56 0.55 0.54 0.53 15 0.26 0.18 0.28 0.39 0.39 0.52 0.30 0.39 0.60 0.62 0.63 0.64 0.64 0.63 0.62 0.61
MY 1 3 5 7 9 11 13 15 1 3 5 7 9 11 13 15
LW 1 0.24 0.24 0.24 0.23 0.22 0.21 0.20 0.19
3 –0.32 –0.06 0.03 –0.04 –0.24 –0.03 –0.04 0.11 0.20 0.20 0.19 0.19 0.18 0.18 0.17 0.16 5 –0.58 –0.20 –0.08 –0.10 –0.26 –0.04 0.04 0.16 0.15 0.15 0.15 0.15 0.14 0.14 0.13 0.13 7 –0.59 –0.29 –0.16 –0.13 –0.24 –0.01 –0.07 0.07 0.09 0.10 0.10 0.10 0.10 0.10 0.10 0.10 9 –0.59 –0.25 –0.23 –0.28 –0.24 –0.12 –0.04 0.00 0.04 0.05 0.05 0.06 0.06 0.06 0.06 0.07 11 –0.61 –0.29 –0.10 –0.16 –0.24 –0.01 0.04 0.08 0.00 0.00 0.01 0.02 0.02 0.03 0.03 0.03 13 –0.47 –0.23 –0.12 –0.09 –0.18 0.01 0.06 0.12 –0.05 –0.04 –0.03 –0.03 –0.02 –0.01 0.00 0.00 15 –0.64 –0.18 –0.09 –0.16 –0.24 0.00 0.01 0.02 –0.09 –0.08 –0.07 –0.06 –0.05 –0.04 –0.03 –0.02
DMI 1 3 5 7 9 11 13 15 1 3 5 7 9 11 13 15
LW 1 0.48 0.58 0.65 0.70 0.71 0.70 0.68 0.66
3 0.56 0.82 0.75 0.47 0.59 0.49 0.67 0.54 0.54 0.63 0.70 0.74 0.74 0.73 0.70 0.66 5 0.70 0.83 0.84 0.55 0.68 0.57 0.73 0.64 0.60 0.69 0.75 0.78 0.77 0.74 0.71 0.67 7 0.61 0.88 0.85 0.65 0.79 0.63 0.84 0.71 0.65 0.73 0.79 0.80 0.79 0.76 0.71 0.67 9 0.61 0.89 0.89 0.66 0.82 0.63 0.74 0.71 0.69 0.77 0.82 0.83 0.80 0.76 0.71 0.66 11 0.58 0.83 0.87 0.63 0.82 0.72 0.82 0.70 0.73 0.80 0.84 0.84 0.81 0.76 0.70 0.65 13 0.52 0.87 0.88 0.63 0.79 0.70 0.81 0.71 0.76 0.83 0.86 0.85 0.81 0.75 0.69 0.63 15 0.54 0.86 0.88 0.62 0.78 0.74 0.61 0.66 0.79 0.84 0.87 0.85 0.81 0.74 0.68 0.62
TABLE 6. Genetic correlations between milk yield ( M Y ) and live weight ( L W ) measured at different stages of lactation and estimated using bivariate covariance function of the third order for both MY and LW.
MY
1 3 5 7 9 11 13 15
LW 1 0.37 0.28 0.21 0.18 0.18 0.19 0.23 0.27
3 0.26 0.14 0.08 0.06 0.06 0.08 0.12 0.20 5 0.14 0.02 –0.04 –0.06 –0.06 –0.03 0.03 0.12 7 0.04 –0.08 –0.14 –0.15 –0.14 –0.11 –0.05 0.05 9 –0.02 –0.14 –0.19 –0.20 –0.19 –0.15 –0.09 0.02 11 –0.04 –0.16 –0.21 –0.22 –0.20 –0.17 –0.11 0.00 13 –0.03 –0.15 –0.20 –0.20 –0.19 –0.16 –0.09 0.01 15 0.01 –0.11 –0.15 –0.16 –0.15 –0.12 –0.06 0.04
wk 11 is estimated to be –1.0 in the bivariate analy-sis, but the CF gives an estimate of –0.48. Addition-ally, the (co)variance matrix resulting from all bivar-iate analysis is not positive definite, which would require a form of smoothing to obtain a workable matrix. The CF gives a smoothed and positive definite matrix and accounts for the ordering and spacing of records. Correlations between different traits at different lactation stages are not symmetric. For ex-ample, DMI during early lactation is negatively cor-related with MY during the whole period, but DMI
during later weeks is positively correlated. The corre-lation between DMI and LW appears to be less af-fected by lactation stage.
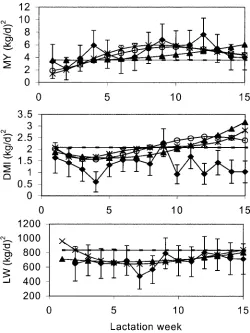
Figure 2. Additive genetic variance at different stages of lacta-tion for milk yield (MY), DMI, and live weight ( L W ) calculated from first to fourth order covariance functions: L1L1 ( – ) , L2L2 (π) , L3L3 (o) , and L4L4 ( * ) , respectively. Estimates for the variances from univariate analysis for each week of lactation (♦) are given with their standard error bars.
The correlations calculated from this function (Table 6 ) agreed more closely with the bivariate analysis, although there is still an apparent conflict in the first few weeks, which was probably due to sampling er-rors in the bivariate analysis; correlations between MY in wk 2 and LW in wk 2, 3, and 4 were 0.07, 0.23, and –0.05, respectively.
DISCUSSION
To investigate potential strategies to use genetic selection for the improvement of the negative energy balance during early lactation, genetic parameters are required for MY, LW, and DMI during early lacta-tion. However, because of the high cost of recording DMI only, limited data are available to estimate these parameters. The consequence is large sampling errors when traits are treated as if each lactation stage is a different trait. Use of the parameters with large sampling errors, either in a selection index or multitrait breeding value estimation, results in bias ( 6 ) in several practical animal breeding circum-stances (4, 21, 23). Therefore, apart from the reasons described previously, it is important to estimate (co)variances with a function with fewer parameters than the full (co)variance matrix.
A second or third order polynomial for the additive genetic effect adequately described variation around the mean lactation curve for MY, DMI, and LW when using likelihood to test whether variance components were significantly different from zero. However, com-parison of estimated variances at different lactation stages suggest that the genetic variance for DMI is estimated to be higher with the CF approach than with individual estimates of the univariate analyses, especially at the end of the 15-wk period (Figure 2). There is no obvious explanation for this result. The three main differences between the two methods are that 1 ) random regression models allow adjustment for measurement week rather than year-season of calving, 2 ) random regression models take into ac-count all records simultaneously rather than records in 1 wk only, and 3 ) the random regression models used here assume a normally distributed and uncor-related error term unaffected by lactation stage (apart from the permanent environmental effect). Ptak and Scheaffer ( 1 3 ) suggested that error vari-ance for MY decreased by 24% as a consequence of adjusting for date of measurement rather than herd-year-season; however, it is unlikely that this adjust-ment, or taking all records into account simultane-ously, could explain the difference in variance be-tween the two methods used. Therefore, it is more
Journal of Dairy Science Vol. 82, No. 7, 1999
VEERKAMP AND THOMPSON
1572
Although functions of a higher order than three were not significantly different from 0 for the genetic effect, for the permanent environmental effect, more extensive polynomials were still significant. However, fitting a higher order polynomial for the permanent environmental effect rather than for the additive genetic effect seemed inappropriate as the genetic variation became unrealistically small. The most likely explanation is that due to the small data set, these two effects might have been partially con-founded and, therefore, addition of more permanent environmental components seemed unjustified. Inclu-sion of more appropriate error structures might also reduce the need for a high order of fit for the perma-nent environmental effects.
Extension of the single-trait CF to the multitrait CF resulted in more convergence problems. The primary reason was that correlations between the components across traits were at the boundary of the parameter space. For example, correlations between levels for intake and LW and between level for yield and slope for intake were both estimated at unity, which suggests that either not enough data was avail-able to separate these components or that a simpler model is sufficient to explain the data. In both situa-tions, it seems appropriate to present the second-order function, albeit better fit models will exist. An improvement of the current functions might be possi-ble by fitting some common parameters to all three traits (after scaling). Veerkamp and Goddard ( 2 2 ) applied this improvement to milk, fat, and protein yields and found that one common function describing the change in genetic (co)variance across the full lactation and one matrix describing the correlations between the yield traits gave a sufficient description of the full (co)variance matrix between these traits across the full lactation. Such a simple model unlikely would be sufficient here given the correlation struc-ture in Table 5, but the high correlations between components across traits suggest that further investi-gation is needed.
Estimates of the genetic correlations between wk 1 and 15 confirm the results from another dataset (10); genetic correlations between DMI in early and late lactation were low. These authors found a correlation of –0.14 between wk 3 and 25. Correlations between components of the multitrait CF also confirm the importance of LW change for increasing the level of MY. Several authors ( 1 9 ) reported a negative corre-lation between MY and LW change (–0.37 to –0.65). The magnitude of the effect of lactation stage on the correlation between traits is large. From this data, it is suggested that heifers that eat less than average
during the first wk of lactation but then manage to increase their intakes to above average give the highest yield during the 15 wk. These cows are likely to rely heavily on body tissue mobilization or to ex-perience the most negative energy balance during early lactation, which in terms of LW is illustrated by the genetic correlations between LW and MY. If weight is measured later than MY (i.e., below the diagonal in Table 6), the genetic correlation between yield and weight becomes more negative. Thus, LW lags behind MY.
Implications of the genetic correlations in this study are that stage of lactation influences measure-ment of DMI and LW for genetic selection. Correla-tions within trait (with the possible exception of DMI) seem to be less affected than do correlations across traits. These results are particularly important when the interest is in selection for a linear combina-tion of the traits analyzed in this study such as energy balance. The random regression model can be used to estimate breeding values for level and slope directly or to estimate breeding values for each trait at each lactation stage. However, it seems important that CF and genetic parameters in this study are confirmed with a larger data set.
ACKNOWLEDGMENTS
The authors thank Arthur Gilmour for the use of his ASREML program, which was invaluable in this study.
REFERENCES
1 Berglund, B., and B. Danell. 1987. Live weight changes, feed consumption, milk yield, and energy balance in dairy cattle during the first period of lactation. Acta Agric. Scand. 37: 495–509.
2 Foulley, J. L., M. S. Cristobal, D. Gianola, and S. Im. 1992. Marginal likelihood and Bayesian approaches to the analysis of heterogeneous residual variances in mixed linear Gaussian models. Comput. Stat. Data Analysis 13:291–305.
3 Gilmour, A. R., B. R. Cullis, S. J. Welham, and R. Thompson. 1998. ASREML User’s Manual, Version 11, Aug. 1998. New South Wales Agriculture, Orange Agric. Inst., Orange, NSW, Australia.
4 Goddard, M. E., and R. Thompson. 1997. Use of prior informa-tion in forming selecinforma-tion indices. J. Anim. Breed. Genet. 115: 327–340.
5 Harrison, R. O., S. P. Ford, J. W. Young, A. J. Conley, and A. E. Freeman. 1990. Increased milk production versus reproductive and energy status of high producing dairy cows. J. Dairy Sci. 73:2749–2758.
6 Hill, W. G., and R. Thompson. 1978. Probabilities of non-positive definite between-group or genetic covariance matrices. Biometrics 34:429–439.
8 Kirkpatrick, M., and N. Heckman. 1989. A quantitative genetic model for growth, shape, reaction norms, and other infinite-dimensional characters. J. Math. Biol. 27:429–450.
9 Kirkpatrick, M., W. G. Hill, and R. Thompson, 1994. Estimating the covariance structure of traits during growth and ageing, illustrated with lactation in dairy cattle. Genet. Res. (Cam-bridge) 64:57–69.
10 Koenen, E.P.C., and R. F. Veerkamp. 1998. Genetic covariance functions for live-weight, condition score, and dry-matter intake of lactating Holstein Friesian heifers. Livest. Prod. Sci. 57: 67–77.
11 Meuwissen, T.H.E., G. de Jong, and B. Engel. 1996. Joint estimation of breeding values and heterogeneous variances of large data files. J. Dairy Sci. 79:310–316.
12 Meyer, K., and W. G. Hill. 1997. Estimation of genetic and phenotypic functions for longitudinal or ‘repeated’ records by restricted maximum likelihood. Livest. Prod. Sci. 47:185–200. 13 Ptak, E., and L. R. Scheaffer. 1993. Use of test day yields for genetic evaluation of dairy sires and cows. Livest. Prod. Sci. 34: 23–34.
14 Robinson, J. J. 1996. Nutrition and reproduction. Anim. Reprod. Sci. 42:25–34.
15 Schaeffer, L. R. 1997. Subject: random regressions. http:// chuck.agsci.colostate.edu/wais/logs/agdg869258263.html. Ac-cessed October 1998.
16 Schaeffer, L. R., and J.C.M. Dekkers. 1994. Random regressions in animal models for test-day production in dairy cattle. 5th World Congr. Genet. Appl. Livest. Prod. 18:443–446.
17 Van der Werf, J.H.J., M. E. Goddard, and K. Meyer. 1998. The use of covariance functions and random regression for genetic evaluation of milk production based on test day records. J. Dairy Sci. 81:3300–3308.
18 Van Elzakker, P.J.M., and J.A.M. Van Arendonk. 1993. Feed intake, body weight and milk production: genetic analysis of different measurements in lactating dairy heifers. Livest. Prod. Sci. 37:37–51.
19 Veerkamp, R. F. 1998. Selection for economic efficiency of dairy cattle using information on live weight and feed intake: a review. J. Dairy Sci. 81:1109–1119.
20 Veerkamp, R. F., and S. Brotherstone. 1997. Genetic correla-tions between linear type traits, food intake, live weight and body condition score in Holstein Friesian dairy cattle. Anim. Sci. 64:385–392.
21 Veerkamp, R. F., G. C. Emmans, A. R. Cromie, and G. Simm. 1995. Variance components for residual feed intake in dairy cows. Livest. Prod. Sci. 41:111–120.
22 Veerkamp, R. F., and M. Goddard. 1998. Covariance functions across herd production levels for test day records on milk, fat, and protein yields. J. Dairy Sci. 81:1690–1701.
23 Visscher, P. M. 1995. Bias in multiple genetic correlation from half sib designs. Genet. Sel. Evol. 27:335–345.