ISSN(Online): 2320-9801
ISSN (Print): 2320-9798
I
nternational
J
ournal of
I
nnovative
R
esearch in
C
omputer
and
C
ommunication
E
ngineering
(An ISO 3297: 2007 Certified Organization)
Vol. 4, Issue 10, October 2016
Performance Comparison based on Attribute
Selection Techniques of WEKA and ROSE
Tools
Kavitha C.R1, Mahalekshmi T2
Research Scholar, R&D, Bharathiar University, Coimbatore, India1 Principal, Sree Narayana Institute of Technology, Kollam, India2
ABSTRACT: In this paper firstly, two different rough set based attribute selection techniques available in ROSE 2 such as lattice search and heuristic search has been applied to three datasets and a comparative study between these two techniques is made based upon the performance of classification accuracy. Secondly, five different selected feature selection methods available in WEKA 3.7 tool have been applied to three datasets and compared. Also the performance of feature selection methods in tools like WEKA 3.7 and ROSE2 is compared. The datasets used in this study are hypothyroid dataset, Pima Diabetes dataset and Hepatitis dataset. The result shows that attributes selection with heuristic search gives better results than the lattice search.
KEYWORDS: Rough Set Theory, Attribute Selection, Lattice Search, Heuristic Search, Classification, Performance I. INTRODUCTION
The quality of the dataset is one of the most important factors that affect the success of data mining applications. If the dataset contains irrelevant, redundant, noisy and unreliable data, then knowledge discovery during training becomes more difficult. [1] Given a big dataset with a large number of attributes, many of the attributes present in the dataset may be irrelevant or redundant. The process of removing such irrelevant and redundant attributes from the dataset and creating an attribute subset containing the original attributes based on an attribute evaluation criteria used along with a search strategy is called attribute selection or attribute reduction. [2]
Fig 1: Functionalities of ROSE2 tool [3] Fig 2: Functionalities of WEKA3.7 [3]
ISSN(Online): 2320-9801
ISSN (Print): 2320-9798
I
nternational
J
ournal of
I
nnovative
R
esearch in
C
omputer
and
C
ommunication
E
ngineering
(An ISO 3297: 2007 Certified Organization)
Vol. 4, Issue 10, October 2016
rules from rough approximations of decision classes and using them as classifiers, and evaluating sets of rules on testing data in classification experiment as shown in the figure 1 [3]. WEKA (Waikato Environment for Knowledge Analysis) is a machine learning software suite developed at the University of Waikato, New Zealand. It provides tasks such as data processing, classification, clustering, association, regression and visualization as shown in the figure 2 [3]. This paper is organized as follows. Related work is given in Section II. A brief description of attribute selection methods is given in Section III. The experiment is described in Section IV followed by the Results and Discussions of the study in Section V. Finally, the Conclusion is given in Section VI followed by the references.
II. RELATED WORK
In [3] authors have described the importance of rough set theory (RST) and have summarised two algorithms for reducts calculation. They have conducted a survey of frequently used packages that are used to perform data analysis based on Rough Sets. In [5] authors have compared the performance of attribute selection methods using two technical tools namely WEKA 3.7 and ROSE2 on the internet usage data set. In [6] authors have developed a new feature selection mechanism based on fuzzy forward and backward reducts and also have presented an effective and efficient new entropy- based modification of the original rough set-based approach. Their technique tries to avoid the calculation of discernibility functions or positive regions, which can be computationally expensive. In [7] according to the authors, Rough set theory is a formal methodology that can be employed to reduce the dimensionality of datasets as a preprocessing step to training a learning system on the data. Their work consists of the utilization of the Rough Set Attribute Reduction (RSAR) technique to both supervised learning (used Lozowski's fuzzy Rule Induction Algorithm (RIA) [8] and unsupervised learning (Friedman's Multivariate Adaptive Regression Splines (MARS) [9]. These were applied in estimating river algae populations as influenced by changes in the concentration of chemicals in the water. The success of the application was evident by the reduction in the number of attributes required and also the accuracy matched closely that was produced by training on the original, unreduced dataset. In [10] the authors have presented a new method for dealing with attribute selection based on conditional mutual information. Their method was able to select feature subset with minimum number of features, which are relevant to get higher average classification accuracy for datasets. The experimental results with UC Irvine datasets and Naïve Bayes classifier showed that their algorithm is effective and efficient in selecting subset with minimum number of features getting higher classification accuracy than the existing feature selection methods. In [11] the authors have developed a new rough set-based unsupervised feature selection using relative dependency measures. The method employs a backward elimination-type search to remove features from the complete set of original features. The subsets returned by this unsupervised method are of similar size to that of the supervised method and classification of the reduced data shows that the method selects useful features which are of comparable quality. In [12] the author in her paper has presented a theoretical comparative review on some existing RST methods with their pros and cons. Three RST based feature selection algorithms like Quickreduct (QR), Relative Reduct (RR) and Entropy based Reduct (EBR) were applied on six public domain datasets available in UCI machine learning repository. From their study it has been found that EBR and QR performance is preferably better than RR on some dataset with respect to number of feature selection and execution time. In [13] the authors have presented a survey about feature selection methods. They identified four steps of a typical feature selection method such as generation procedure, evaluation function, stopping criterion, and validation procedure, and categorized the different existing methods in three categories: complete, heuristic, and random, and the evaluation functions into five categories: distance, information, dependence, consistency, and classifier error rate measures. In [14] the rough set theory approach has been used for conducting attribute selection for classifying hypothyroidism that improved the performance and accuracy of the classifiers.
III. ATTRIBUTE SELECTION – AN OVERVIEW
ISSN(Online): 2320-9801
ISSN (Print): 2320-9798
I
nternational
J
ournal of
I
nnovative
R
esearch in
C
omputer
and
C
ommunication
E
ngineering
(An ISO 3297: 2007 Certified Organization)
Vol. 4, Issue 10, October 2016
possible relevant information found in the entire set of attributes. [17] In wrapper approach as shown in the figure 3, attribute selection is performed by taking into account the classification algorithm that will be applied to the selected attributes. Here an optimized subset of attributes for a given classification algorithm is selected. [17] The embedded approach as shown in the figure 5 incorporates variable selection as a part of model fitting and the selection technique is specific to the model. The external search algorithms that are used in the filter and wrapper approaches cannot cover all possible variable combinations, excluding problems with only a few variables. Thereby, their solutions are likely to be suboptimal. [19]
Fig 3 : Wrapper Approach [18]
Fig 4 : Filter Approach [18]
Fig 5: Embedded Approach [18]
IV. EXPERIMENT
A. DATASET DESCRIPTION
Three datasets namely hypothyroid dataset, hepatitis dataset and Pima Diabetes dataset were used in this experiment. These datasets were downloaded from UCI Machine Learning Repository (“https://archive.ics.uci.edu /ml/machine-learning -databases). [20] The characteristics of the data sets are summarized in the Table 1.
Table 1: Datasets Characteristics
ISSN(Online): 2320-9801
ISSN (Print): 2320-9798
I
nternational
J
ournal of
I
nnovative
R
esearch in
C
omputer
and
C
ommunication
E
ngineering
(An ISO 3297: 2007 Certified Organization)
Vol. 4, Issue 10, October 2016
B. ATTRIBUTE DESCRIPTION
The attributes of the hypothyroid data set includes age, sex, on_thyroxine,query_on_thyroxine, onantithyroid _medication, sick, pregnant, thyroid_surgery, I131_treatment, query hyperthyroid, query hypothyroid, lithium, goitre, tumour, hypopitutory, psych, TSH_measured, T3_measured, TT4_measured, FTI_measured, TBG_measured, TSH, T3, TT4, FTI, TBG ,referral source,T4U_measured and T4U. The attributes of the hepatitis dataset includes age, sex, steroid, antivirals, fatigue, malaise, anorexia, liver big, liver firm, spleen palpable, spiders, ascites, varices, bilirubin,alk phosphate, sgot, albumin, protime, histology and class. The attributes of the Pima Indian Diabetes dataset includes number of times pregnant, plasma glucose concentration, Diastolic blood pressure (mm Hg), Triceps skin fold thickness (mm), 2-Hour serum insulin, Body mass index (kg/m2), Diabetes pedigree function, Age and class.
C. METHODOLOGY
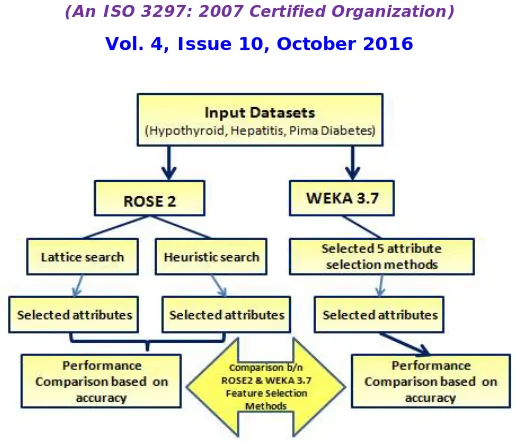
The general framework for conducting this experiment is given in figure 6. In this paper, attribute selection methods which are available in ROSE2 [21] and WEKA 3.7 [22] tools have been applied to the three datasets. The aim of the proposed work is to make a comparison based on the performance of the attribute selection methods of ROSE2 and WEKA 3.7. This experiment consists of the following steps:
Step1: The datasets namely Hypothyroid dataset, Hepatitis dataset and Pima Indian Diabetes dataset are taken as the input dataset. The data pre-processing is performed on the datasets since the hypothyroid and Hepatitis datasets contains missing and noisy attributes. It is evident from several research studies that the data pre-processing is very essential since it enhances the performance accuracy of the classifiers. [23]
Step2: Classification accuracy is determined for the three datasets without attribute selection using the classifiers such as J48 [24], Multilayer Perceptron [25] and Jrip [26]. The classification accuracy of the classifiers without attribute selection is given in table 2.
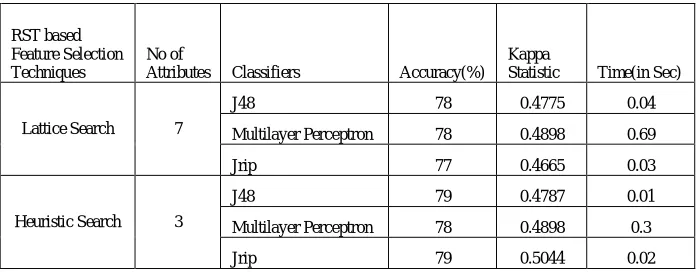
Step3: Attribute selection is performed on the three datasets using Lattice search [27] and Heuristic search [28] of ROSE2 tool. The number of attributes and the selected attributes are described in the table 3.
Step4: Performance comparison of the attribute selection on three datasets using Lattice search and Heuristic search is done using classifiers like J48, Multilayer Perceptron and Jrip in WEKA 3.7 based on the classification accuracy as shown in the table 4, table 5 and table 6.
Step5: Attribute selection is performed on the three datasets using 5 selected methods of WEKA 3.7. This is shown in the table 7.
Step 6: Performance comparison of the five different selected methods of attribute selection in WEKA3.7 is done using classifiers such as J48, Multilayer Perceptron and Jrip in WEKA 3.7 based on the classification accuracy.
ISSN(Online): 2320-9801
ISSN (Print): 2320-9798
I
nternational
J
ournal of
I
nnovative
R
esearch in
C
omputer
and
C
ommunication
E
ngineering
(An ISO 3297: 2007 Certified Organization)
Vol. 4, Issue 10, October 2016
Fig-6: A General Framework for the proposed study
Table 2: Performance Comparison before Attribute Selection
Dataset Before Attribute Selection
Classifiers Accuracy (%) Kappa Statistic Time (in Sec)
Hyphothyroid
J48 92 0.793 0.02 Multilayer Perceptron 90 0.7403 15.21 Jrip 90 0.74 0.1 Pima Indian
Diabetes
J48 78 0.4775 0.04 Multilayer Perceptron 78 0.4898 0.69 Jrip 77 0.4665 0.03 Hepatitis
J48 84 0.436 0.05 Multilayer Perceptron 82 0.4356 1.22 Jrip 80 0.2817 0.04
Table 3: Attribute Selection using ROSE2
Tool Dataset Method
No of
attributes Attributes Selected
ROSE 2
Hypothyroid
Lattice Search 13
age, sex, query_ hypothyroid, TSH_ measured, TF, TT4_ measured,T4U,FTI,psych, thyroid_surgery, TT4, referral_ source, TSH
Heuristic Search 12 age, sex,query_ hypothyroid, TSH_ measured, TF,TT4_ measured,T4U,FTI,psych, thyroid_surgery,TT4,TSH
Hepatitis Lattice Search
19 all attributes
Heuristic Search 8 age,ascites,SGOT,Bilirubin,albumin,fatigue,alk_phosphate, malaise
Pima Indian Diabetes Lattice Search
7 all attributes
ISSN(Online): 2320-9801
ISSN (Print): 2320-9798
I
nternational
J
ournal of
I
nnovative
R
esearch in
C
omputer
and
C
ommunication
E
ngineering
(An ISO 3297: 2007 Certified Organization)
Vol. 4, Issue 10, October 2016
Table 4: Performance Comparison after Attribute Selection on Hypothyroid dataset
RST based Feature Selection Techniques
No of
Attributes Classifiers Accuracy(%) Kappa Statistic Time(in Sec)
Lattice Search 13
J48 91 0.7697 0.02
Multilayer Perceptron 89 0.7224 6.56
Jrip 91 0.7622 0.05
Heuristic Search 12
J48 91 0.7697 0.01
Multilayer Perceptron 91 0.7546 4.04
Jrip 91 0.7428 0.04
Table 5: Performance Comparison after Attribute Selection on Hepatitis dataset
RST based Feature Selection Techniques
No of
Attributes Classifiers Accuracy(%)
Kappa Statistic
Time(in Sec)
Lattice Search 7
J48 84 0.436 0.05
Multilayer Perceptron 82 0.4356 1.22
Jrip 80 0.2817 0.04
Heuristic Search 3
J48 79 0.3057 0.02
Multilayer Perceptron 82 0.4487 0.41
Jrip 79 0.3057 0.02
Table 6: Performance Comparison after Attribute Selection on Pima Indian Diabetes dataset
RST based Feature Selection Techniques
No of
Attributes Classifiers Accuracy(%)
Kappa
Statistic Time(in Sec)
Lattice Search 7
J48 78 0.4775 0.04
Multilayer Perceptron 78 0.4898 0.69
Jrip 77 0.4665 0.03
Heuristic Search 3
J48 79 0.4787 0.01
Multilayer Perceptron 78 0.4898 0.3
ISSN(Online): 2320-9801
ISSN (Print): 2320-9798
I
nternational
J
ournal of
I
nnovative
R
esearch in
C
omputer
and
C
ommunication
E
ngineering
(An ISO 3297: 2007 Certified Organization)
Vol. 4, Issue 10, October 2016
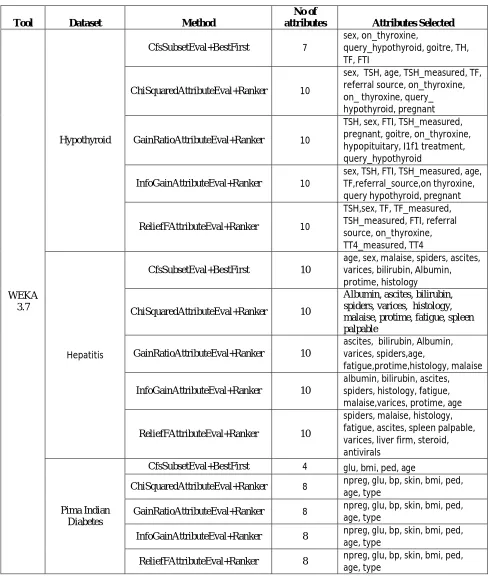
Table 7: Attribute Selection performed using WEKA 3.7
Tool Dataset Method
No of
attributes Attributes Selected
WEKA 3.7
Hypothyroid
CfsSubsetEval+BestFirst 7
sex, on_thyroxine,
query_hypothyroid, goitre, TH, TF, FTI
ChiSquaredAttributeEval+Ranker 10
sex, TSH, age, TSH_measured, TF, referral source, on_thyroxine, on_ thyroxine, query_ hypothyroid, pregnant
GainRatioAttributeEval+Ranker 10
TSH, sex, FTI, TSH_measured, pregnant, goitre, on_thyroxine, hypopituitary, I1f1 treatment, query_hypothyroid
InfoGainAttributeEval+Ranker 10
sex, TSH, FTI, TSH_measured, age, TF,referral_source,on thyroxine, query hypothyroid, pregnant
ReliefFAttributeEval+Ranker 10
TSH,sex, TF, TF_measured, TSH_measured, FTI, referral source, on_thyroxine, TT4_measured, TT4
Hepatitis
CfsSubsetEval+BestFirst 10
age, sex, malaise, spiders, ascites, varices, bilirubin, Albumin, protime, histology
ChiSquaredAttributeEval+Ranker 10
Albumin, ascites, bilirubin, spiders, varices, histology, malaise, protime, fatigue, spleen palpable
GainRatioAttributeEval+Ranker 10
ascites, bilirubin, Albumin, varices, spiders,age,
fatigue,protime,histology, malaise
InfoGainAttributeEval+Ranker 10
albumin, bilirubin, ascites, spiders, histology, fatigue, malaise,varices, protime, age
ReliefFAttributeEval+Ranker 10
spiders, malaise, histology, fatigue, ascites, spleen palpable, varices, liver firm, steroid, antivirals
Pima Indian Diabetes
CfsSubsetEval+BestFirst 4 glu, bmi, ped, age
ChiSquaredAttributeEval+Ranker 8 npreg, glu, bp, skin, bmi, ped, age, type
GainRatioAttributeEval+Ranker 8 npreg, glu, bp, skin, bmi, ped, age, type
InfoGainAttributeEval+Ranker 8 npreg, glu, bp, skin, bmi, ped,
age, type
ReliefFAttributeEval+Ranker 8 npreg, glu, bp, skin, bmi, ped,
age, type
ISSN(Online): 2320-9801
ISSN (Print): 2320-9798
I
nternational
J
ournal of
I
nnovative
R
esearch in
C
omputer
and
C
ommunication
E
ngineering
(An ISO 3297: 2007 Certified Organization)
Vol. 4, Issue 10, October 2016
Selection Techniques in WEKA Classifiers Accuracy(%) Kappa Statistic
Time(in Sec)
CfsSubsetEval+BestFirst
J48 92 0.7898 0.01
Multilayer
Perceptron 91 0.7602 1.66
Jrip 91 0.7622 0.03
ChiSquaredAttributeEval+Ranker
J48 91 0.7812 0.01
Multilayer
Perceptron 91 0.7574 5.27
Jrip 91 0.7544 0.05
GainRatioAttributeEval+Ranker
J48 92 0.7851 0.01
Multilayer
Perceptron 92 0.7937 2.53
Jrip 91 0.7534 0.03
InfoGainAttributeEval+Ranker
J48 92 0.7812 0.02
Multilayer
Perceptron 91 0.7574 5.34
Jrip 91 0.7544 0.06
ReliefFAttributeEval+Ranker
J48 92 0.7833 0.01
Multilayer
Perceptron 91 0.7639 3.95
Jrip 91 0.7524 0.04
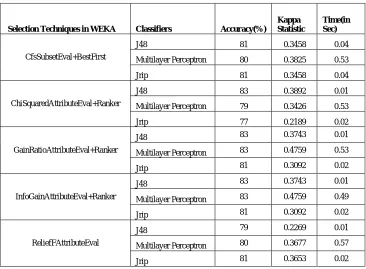
Table 9: Performance Comparison after Attribute Selection on Hepatitis dataset
Selection Techniques in WEKA Classifiers Accuracy(%)
Kappa Statistic
Time(in Sec)
CfsSubsetEval+BestFirst
J48 81 0.3458 0.04
Multilayer Perceptron 80 0.3825 0.53
Jrip 81 0.3458 0.04
ChiSquaredAttributeEval+Ranker
J48 83 0.3892 0.01
Multilayer Perceptron 79 0.3426 0.53
Jrip 77 0.2189 0.02
GainRatioAttributeEval+Ranker
J48 83 0.3743 0.01
Multilayer Perceptron 83 0.4759 0.53
Jrip 81 0.3092 0.02
InfoGainAttributeEval+Ranker
J48 83 0.3743 0.01
Multilayer Perceptron 83 0.4759 0.49
Jrip 81 0.3092 0.02
ReliefFAttributeEval
J48 79 0.2269 0.01
Multilayer Perceptron 80 0.3677 0.57
Jrip 81 0.3653 0.02
ISSN(Online): 2320-9801
ISSN (Print): 2320-9798
I
nternational
J
ournal of
I
nnovative
R
esearch in
C
omputer
and
C
ommunication
E
ngineering
(An ISO 3297: 2007 Certified Organization)
Vol. 4, Issue 10, October 2016
Selection Techniques in WEKA Classifiers Accuracy(%)
Kappa Statistic
Time(in Sec)
CfsSubsetEval+BestFirst
J48 78 0.4941 0.01
Multilayer Perceptron 82 0.5744 0.44
Jrip 78 0.4833 0.03
ChiSquaredAttributeEval+Ranker
J48 77 0.4665 0.04
Multilayer Perceptron 78 0.4898 0.64
Jrip 77 0.4665 0.04
GainRatioAttributeEval+Ranker
J48 77 0.4665 0.04
Multilayer Perceptron 78 0.4898 0.64
Jrip 77 0.4665 0.04
InfoGainAttributeEval+Ranker
J48 77 0.4665 0.04
Multilayer Perceptron 78 0.4898 0.64
Jrip 77 0.4665 0.04
ReliefFAttributeEval+Ranker
J48 77 0.4665 0.04
Multilayer Perceptron 78 0.4898 0.64
Jrip 77 0.4665 0.04
V. RESULTS AND DISCUSSION
In this experiment, a comparative study of attribute selection using ROSE2, a tool that implements rough set theory and WEKA 3.7 with its attribute selection methods on three datasets namely Hypothyroid, Hepatitis and Pima Indian diabetes. Attribute selection is performed using ROSE2 and WEKA3.7. The reduced attributes are then used for conducting classification using classifiers like J48, Multilayer Perceptron and Jrip using WEKA 3.7. The comparison of the attribute selection techniques of ROSE2 and WEKA 3.7 was done on the basis of classification accuracy and Kappa Statistics. In this paper, Lattice search and Heuristic search of ROSE2 tool and five different combination of attribute selection methods namely CfsSubsetEval [29]+BestFirst [30], ChiSquaredAttributeEval [31]+Ranker [32], GainRatioAttributeEval [33]+Ranker, InfoGainAttributeEval [34]+Ranker and ReliefFAttributeEval [35]+Ranker were used for conducting attribute selection. The performance comparison graph before attribute selection is given in the figure 7. After feature selection is performed, it is understood from the analysis of the graphs in the figures that J48 classifier achieves the highest accuracy of 92% with the Hypothyroid dataset, 84% with the Hepatitis dataset and 78% with the Pima Indian Diabetes dataset. The three classifiers J48, Multilayer perceptron and Jrip achieve higher accuracy with the hypothyroid dataset followed by the three classifiers with the Pima Indian Diabetes dataset. From the graph in figure 8, it is found that multilayer perceptron classifier has the lowest classification accuracy with the lattice attribute selection method. From the graph in figure 9, J48 and JRip classifier has the highest accuracy with 79% with the heuristic search on Pima Indian Diabetes dataset.
With attribute selection methods of ROSE2 tool, it was found that the heuristic search performs better than the lattice search with hypothyroid and Pima Indian Diabetes dataset. Heuristic search could achieve 91% of accuracy with the hypothyroid dataset.
ISSN(Online): 2320-9801
ISSN (Print): 2320-9798
I
nternational
J
ournal of
I
nnovative
R
esearch in
C
omputer
and
C
ommunication
E
ngineering
(An ISO 3297: 2007 Certified Organization)
Vol. 4, Issue 10, October 2016
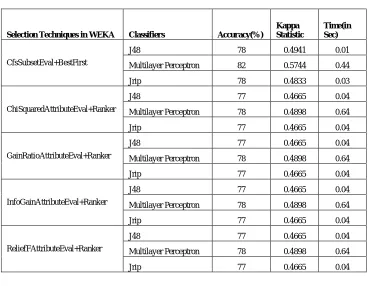
Fig 7: Performance Comparison before Attribute Selection Fig 8: Performance Comparison after ROSE2 Attribute Selection on Hypothyroid dataset
The above figure 7 shows the performance comparison of the various classifiers such as J48, Multilayer Perceptron and JRip. From the graph in figure 8, it is clear that the classifiers J48 and JRip shows the highest performance with the lattice search of ROSE2 whereas all the classifiers achieves the same highest performance of 91% with the heuristic search of ROSE2.
Fig 9: Performance Comparison after ROSE2 Attribute Selection on Fig 10: Performance Comparison after ROSE2 Attribute
Pima Indian Diabetes dataset Selection on Hepatitis dataset
ISSN(Online): 2320-9801
ISSN (Print): 2320-9798
I
nternational
J
ournal of
I
nnovative
R
esearch in
C
omputer
and
C
ommunication
E
ngineering
(An ISO 3297: 2007 Certified Organization)
Vol. 4, Issue 10, October 2016
Fig 11: Performance Comparison after WEKA 3.7 Attribute Selection on Fig 12: Performance Comparison after WEKA 3.7 Attribute Hypothyroid dataset Selection on Hepatitis dataset
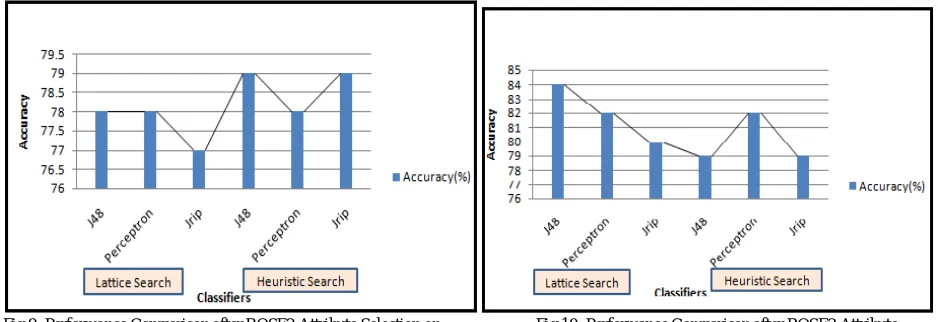
Figure 11 shows the performance comparison of the different classifiers with the selected WEKA3.7 attribute selection methods on the hypothyroid dataset. From the figure it is understood that the J48 classifier could achieve the highest classification accuracy with the ChiSquaredAttributeEval +Ranker, GainRatioAttributeEval +Ranker and InfoGainAttributeEval +Ranker attribute selection methods on hypothyroid dataset. Multilayer Perceptron was able to achieve the same accuracy of J48 in the case of GainRatioAttributeEval +Ranker and InfoGainAttributeEval. Figure 12 shows the performance comparison of different classifiers with the selected WEKA3.7 attribute selection methods on the hepatitis dataset. With this dataset, J48 could achieve the highest accuracy with all the selected attribute selection methods except ChiSquaredAttributeEval +Ranker of WEKA3.7.
Fig 13: Performance Comparison after WEKA 3.7 Fig 14: Comparison of Attribute Selection methods of ROSE2 Attribute Selection on Pima Indian Diabetes dataset and WEKA 3.7on Hypothyroid dataset
ISSN(Online): 2320-9801
ISSN (Print): 2320-9798
I
nternational
J
ournal of
I
nnovative
R
esearch in
C
omputer
and
C
ommunication
E
ngineering
(An ISO 3297: 2007 Certified Organization)
Vol. 4, Issue 10, October 2016
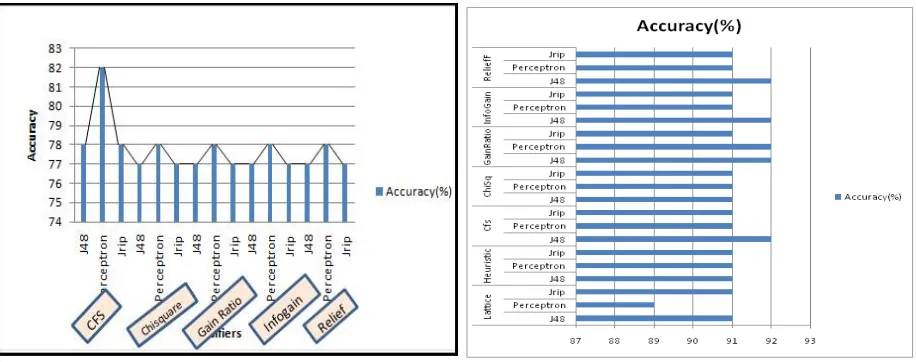
ChiSquaredAttributeEval+Ranker with J48. From the graph in figure 16, multilayer perceptron classifier with CfsSubsetEval+BestFirst has the highest accuracy of 82% in the case of Pima Indian Diabetes dataset which is followed by J48 classifier with heuristic search, Jrip classifier with heuristic search of ROSE 2 tool.
Fig 15. Comparison of Attribute Selection methods of ROSE2 Fig 16. Comparison of Attribute Selection methods of ROSE2 and WEKA 3.7 on Hepatitis dataset and WEKA 3.7 on Pima Indian Diabetes dataset
VI. CONCLUSION
In this paperthe relationship between two rough set based feature selection methods and the resulting classification performance and the relation between the five selected attribute selection from WEKA 3.7 and the resulting classification performance has been investigated. From the study it is quite clear that all the attributes are not required for achieving classification accuracy. Only the relevant attributes is required for performing classification. All the redundant, irrelevant and noisy attributes can be removed from the dataset. A comparative study between the attribute selection methods in ROSE2 and WEKA 3.7 has been done. It is clear from the study that attributes selection with heuristic search gives better results than the lattice search of ROSE2.
REFERENCES
1. Mark A. Hall, Geoffrey Holmes,” Benchmarking Attribute Selection Techniques for Discrete Class Data Mining”, IEEE Transactions on Knowledge and Data Engineering, Vol. 15, No. 3, May/June 2003
2. Zheng Alan Zhao and Huan Liu, “Spectral Feature Selection for Data Mining”, CRC Press, Taylor & Francis Group, LLC,ISBN: 13:978-1-4398-6210-0, 2012
3. Abbas, Z. and Burney, A. (2016), “A Survey of Software Packages Used for Rough Set Analysis. Journal of Computer and Communications”, 4, 10-18. http://dx.doi.org/10.4236/jcc.2016.49002
4. Prędki, B. and Wilk, S.,“Rough Set Based Data Exploration Using ROSE System”, 11th International Symposium of Foundations of Intelligent Systems, Warsaw, 8-11 June 1999, 172-180. http://dx.doi.org/10.1007/BFb0095102
5. M. Sudha and A. Kumaravel, “ Performance Comparison based on Attribute Selection Tools for Data Mining”, Indian Journal of Science and Technology, Vol 7(S7), 61–65, November 2014
6. T.R.JeraldBeno, M.Karnan,” Dimensionality Reduction: Rough Set Based Feature Reduction”, International Journal of Scientific and Research Publications, Volume 2, Issue 9, September 2012 ISSN 2250-3153
ISSN(Online): 2320-9801
ISSN (Print): 2320-9798
I
nternational
J
ournal of
I
nnovative
R
esearch in
C
omputer
and
C
ommunication
E
ngineering
(An ISO 3297: 2007 Certified Organization)
Vol. 4, Issue 10, October 2016
8. Lozowski, A., T. J. Cholewo, and J. M. Zurada,” Crisp rule extraction from perceptron network classifiers”, Proceedings of International Conference on Neural Networks, volume of Plenary, Panel and Special Sessions, 94{99 (1996).
9. Friedman, J. H. (1991),"Multivariate Adaptive Regression Splines", The Annals of Statistics. 19: 1. doi:10.1214/aos/1176347963 JSTOR 2241837.MR 1091842 . Zbl 0765.62064.
10. Thu Zar Phyu1 , and Nyein Nyein Oo, ”Performance Comparison of Attributes Selection for Machine Learning Task”, Proceedings of 2015 International Conference on Future Computational Technologies (ICFCT'2015) Singapore, March 29-30, 2015, pp. 171-176 1025475699 8710020032 73C.
11. Velayutham, K. Thangavel, “Rough Set Based Unsupervised Feature Selection Using Relative dependency Measures”, International Journal of Computational Intelligence and Informatics, Vol. 1 : No. 1, April - June 2011
12. R.K. Bania,”Comparative Review on Classical Rough Set Theory based Feature Selection Methods”, International Journal of Computer Applications (0975 – 8887) Volume 114 – No. 19, March 2015
13. M. Dash and H. Liu, “Feature selection for classification”, Elsevier, Intelligent Data Analysis, vol.3, pp.131-156, 1997.
14. Kavitha C.R, Mahalekshmi T,” Rough set approach for feature selection and generation of classification rules of hypothyroid data”, Journal of Advanced Scientific Research, 2016, 7(2): 15-19
15. Avrim L. Bluma, Pat Langley, “Selection of relevant features and examples in machine Llearning”, Artificial Intelligence 97 ( 1997) 245-271
16. Andreas G. K. Janecek , Wilfried N. Gansterer ,”On the Relationship Between Feature Selection and Classification Accuracy”, JMLR: Workshop and Conference Proceedings 4: 90-105
17. Alex A. Freitas,”Data Mining and Knowledge Discovery with Evolutionary Algorithms”,Springer-Verlag Berlin Heidelberg 2002 18. ‘Feature Selection.’ Wikipedia: The Free Encyclopedia. Wikimedia Foundation, Inc., Web. Date accessed (1 October 2016). <
https://en.wikipedia.org/wiki/Feature_selection>
19. Timo Simila,”Advances in Variable Selection and Visualization Methods or Analysis of Multivariate Data”, Helsinki University of Technology, Dissertations in Computer and Information Science Espoo 2007
20. Lichman, M. (2013). UCI Machine Learning Repository [http://archive.ics.uci.edu/ml]. Irvine, CA: University of California, School of Information and Computer Science.
21. B.Predki, Sz.Wilk. “Rough Set Based Data Exploration Using ROSE Syste”, In: Z.W.Ras, A.Skowron, eds.Foundations of Intelligent Systems, Lecture Notes in Artificial Intelligence, vol. 1609. Springer-Verlag, Berlin (1999), 172-180.
22. Mark Hall, Eibe Frank, Geoffrey Holmes, Bernhard Pfahringer, Peter Reutemann, Ian H. Witten (2009); “The WEKA Data Mining Software: An Update”; SIGKDD Explorations, Volume 11, Issue 1.
23. Kavitha C.R, Mahalekshmi T, ”Role of pre-processing in a conceptual framework for toxicity prediction”, GE-International Journal of Engineering Research Vol. 4, Issue 1, Jan 2016 IF- 4.007 ISSN: (2321-1717) © Associated Asia Research Foundation (AARF) Publication 24. Ross Quinlan . “C4.5: Programs for Machine Learning. Morgan Kaufmann Publishers, San Mateo, CA, 1993
25. M. S. Chen, “Analysis and Design of the Multilayer perceptron Using Polynomial Basis Functions”, Ph.D. Dissertation, The University of Texas at Arlington, 1991.
26. William W. Cohen, “Fast Effective Rule Induction. In: Twelfth International Conference on Machine Learning” , 115-123, 1995. 27. N.J. Cercone, K. Naruedomkul, “Computational Approaches to Assistive Technologies for People with Disabilities-Introduction to rough
set theory”, IOS Press, ISBN 978-1-61499-257-8
28. Fuyan Liu , Shaoyi Lu,”A Feature Selection Algorithm Based on Discernibility Matrix”, Computational Intelligence and SecurityVolume 4456 of the series Lecture Notes in Computer Science pp 259-269
29. M. A. Hall (1998), “Correlation-based Feature Subset Selection for Machine Learning”, Hamilton, New Zealand.
30. Russell, Stuart J.; Norvig, Peter (2003), “Artificial Intelligence: A Modern Approach (2nd ed.)”, Upper Saddle River, New Jersey: Prentice Hall, ISBN 0-13-790395-2. pp. 94 and 95 (note 3).
31. Ladha, L. & T. Deepa (2011), “Feature selection methods and algorithms”, International Journal on Computer Science and Engineering, 3, nᵒ 5 (2011): 1787–1797.
28. Fuyan Liu , Shaoyi Lu,” A Feature Selection Algorithm Based on Discernibility Matrix” , Computational Intelligence and Security Volume 4456 of the series Lecture Notes in Computer Science pp 259-269
29. M. A. Hall (1998) ,”Correlation-based Feature Subset Selection for Machine Learning. Hamilton”, New Zealand.
30. Russell, Stuart J.; Norvig, Peter (2003), “Artificial Intelligence: A Modern Approach (2nd ed.)”, Upper Saddle River, New Jersey: Prentice Hall, ISBN 0-13-790395-2. pp. 94 and 95 (note 3).
31. Ladha, L. & T. Deepa (2011), “Feature selection methods and algorithms”, International Journal on Computer Science and Engineering, 3, nᵒ 5 (2011): 1787–1797.
32. Megha Aggarwal, Amrita,”Performance Analysis Of Different Feature Selection Methods In Intrusion Detection”, INTERNATIONAL JOURNAL OF SCIENTIFIC & TECHNOLOGY RESEARCH VOLUME 2, ISSUE 6, JUNE 2013 ISSN 2277-8616
33. Ben-Bassat, M., “Pattern recognition and reduction of dimensionality”, in: P. R. Krishnaiah and L. N. Kanal, (eds), Handbook of Statistics-II, North Holland, 1982, 773–791.
34. Lei Yu, Huan Liu, “Feature selection for high-dimensional data: a fast correlation-based filter solution”, AAAI. 856-863 (2003). 35. Kenji Kira, Larry A. Rendell, “ A Practical Approach to Feature Selection”, In: Ninth International Workshop on Machine Learning,
![Fig 3 : Wrapper Approach [18]](https://thumb-us.123doks.com/thumbv2/123dok_us/1427852.1175271/3.595.177.435.263.483/fig-wrapper-approach.webp)