20th International Conference on Structural Mechanics in Reactor Technology (SMiRT 20) Espoo, Finland, August 9-14, 2009 SMiRT 20-Division 5, Paper 1783
Dynamic Interaction between the Shaking Table and the Specimen
during Earthquake Tests
LE MAOULT Alaina, BAIRRAO Rogeriob, and QUEVAL Jean-Claudea
a
CEA/DEN/SEMT/EMSI, 91191Gif sur Yvette, FRANCE, e-mail: [email protected] b
LNEC/DE/NESDE, Av. do Brasil 101, 1700-066 LISBOA, PORTUGAL
Keywords: Shaking table, test, earthquake, interaction.
1
ABSTRACT
The boundary conditions between the tested structures and the platform of a large shaking table are a major parameter for the design and numerical analyses of shaking table tests. A foremost attention is given to the design of the foundation and anchorage of the structure. All analyses are made considering a completely rigid shaking table: rigid actuators and rigid platform. However, since quite a long time, the shaking table / structure interaction has been clearly observed (Blondet and Esparza, 1988) when analysing the shaking table / actuators interaction, depending on the control tuning. In CEA Saclay, during the last 15 years, decreases of mock-up frequencies between calculations and experimental tests of massive structures have been observed: CASSBA, CAMUS 1 to 4, CAMUS 2000 (Combescure and Ragueneau, 2002) and more recently SMART. For a long time it has been calculated, after tests, the global stiffness that the “Azalée” shaking table should have to explain those decreases.
This paper describes and validates the finite-element model of this shaking table platform, presents the mock-up used and finally deals with and concludes on the shaking table / mock-up interaction.
2
INTRODUCTION
Much advancement is on progress among the members of the European consortia of earthquake engineering laboratories (Bairrao et al., 2006) and the more important needs of the experimental facilities were already identified in detail (Taucer et al., 2005). The optimisation of leading experimental tools like shaking tables is one of the main fields of research as, for example, control systems, hybrid tests, high-speed data transfer and sub-structuring.
The improvement of shaking table technologies is clearly of paramount importance to reduce the seismic vulnerability of the building stock and also to mitigate the consequences of future, and inevitable, seismic events by contributing significantly to the amelioration of new construction techniques.
The global capacities of the biggest European shaking tables are very moderate when compared with the ones of the more recent Japanese laboratories. Therefore the shaking table test of real and very large structures is not foreseen in Europe for the near future. Consequently, the use of sub-structuring techniques must be developed in order to fix to the simulator platform just a part of the structure while all the remainder will be tested on computer, like in the pseudo-dynamic testing procedure (Bairrao, 2008).
3
DESCRIPTION AND VALIDATION OF THE PLATFORM MODEL
This section describes and validates the FE model of the platform of “Azalée” shaking table of CEA Saclay.
3.1 Platform model description
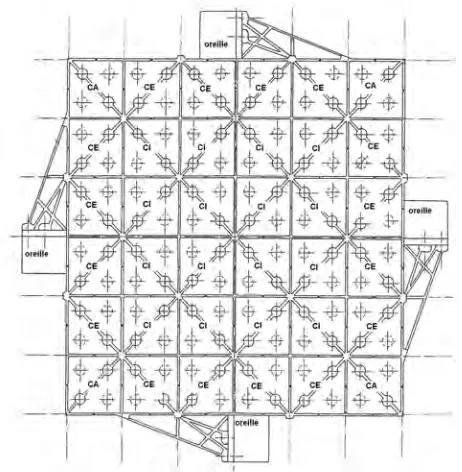
The Azalée platform is a square plate, 6 metres wide and 2 meters deep. It is made of 36 welded aluminium “boxes” and 4 lateral anchorages for the horizontal actuators. The mass of the platform is 23.6 tons and its maximum upload mass is 100 tons.
Figure 1 : Plant view of the Azalée platform.
Simple analytical models have been initested initially, using common springs and plates, but that kind of models did not match correctly the more complex details of the “Azalée” geometry. So, a more detailed, but linear, FE model using thin shell elements has been made and dully simplified in order to be easily reproduced on any FE software.
Two boundary conditions were then analysed:
For the first one, the platform was considered supported by 4 air cushions (64 springs in the model). This configuration will be used in the next section to validate the platform model.
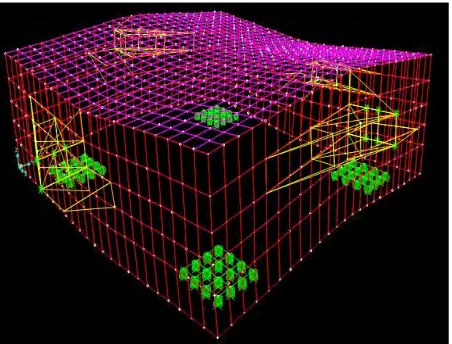
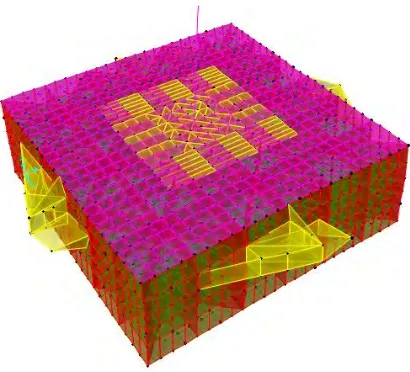
Figure 2 : Azalée platform. Fig. 3 : Detailed CASTEM model of the Azalée platform.
Figure 4 : Simplified Azalée platform model. Figure 5 : Platform on the actuators; mode 6.
3.2 Platform model validation
The validation of this linear FE model was done using 2 reference experimental tests that were performed in 1989 and 2000.
For these frequencies and modes research tests, the platform was simply supported by 4 air cushions (stiffness: Kz_couss =9.08.105 N/m), without any actuators. The next table presents a comparison between
the calculated and the measured frequencies for each mode.
Table 1. Experimental and calculated frequencies with air cushions.
Boundary
conditions Mode 1 Mode 2 Mode 3 Mode 4 Mode 5 Mode 6
Experimental
frequency (Hz) 80.5 95.7 116.2 129.2 129.3 151.1 4 air cushions
Calculated
frequency (Hz) 80.0 95.0 117.0 134.5 134.5 162.2
The platform was then analysed under its usual condition: 8 rigid actuators (hypothesis of a perfect control compensation of the oil column stiffness). Those actuators are represented by 86 unidirectional restraints. The frequencies values, for this situation, are presented in the next table. It should be mentioned that these modes are now different from the ones of the previous configuration.
Table 2. Calculated frequencies with rigid actuators.
Boundary
4
THE MOCK-UP
The evaluation of the platform with the structure is done through a study of the decrease of the mock-up frequency between the configurations “on a rigid soil” and “on the shaking table platform”. Then, this second section presents the mock-up used to check the interaction between the platform and the structure.
2 linear FE models of structures have been created. The next two sub sections present these FE model.
4.1 Simple model
This simple model can be used to make a parametric study.
4.2 More complex and realistic structures to compare with a real test.
These structures allow the analysis of different boundary conditions of the mock-up on the platform (local deformations influences).
A beam fixed on a very rigid square plate (Young modulus = 2.1016 N/m², with no local deformation at the bottom of the beam). Then, several masses and stiffness of the beam have been used to evaluate the frequency decrease of the beam between the configurations “on a rigid soil” and “on the shaking table platform”.
Square section of the beam, 2m wide, 100 mm thin, with no simulation of any torsion mode.
The beam should allow the simulation of flexion and vertical modes of a mock-up.
For example, it was checked that this model can correctly simulate the flexion of the CAMUS mock-up, considering these beam parameters :
Stiffness = 780.6 MN/m.
Mass = 36 ton.
Height = 3.4 m.
The first structure is a non-symmetric reinforced concrete mock-up tested in 2008 during the SMART project in the CEA Saclay lab.
The mass of the mock-up is 45 tons.
Its main dimensions are 3.6m high and a surface of 2.5 m x 3 m.
Special care has been taken to the boundary conditions between the mock-up and the platform.
To evaluate the influence of these boundary conditions, another configuration has been tested including a very rigid square plate (Young modulus = 2.1016 N/m², with no local deformation at the bottom of the mock-up).
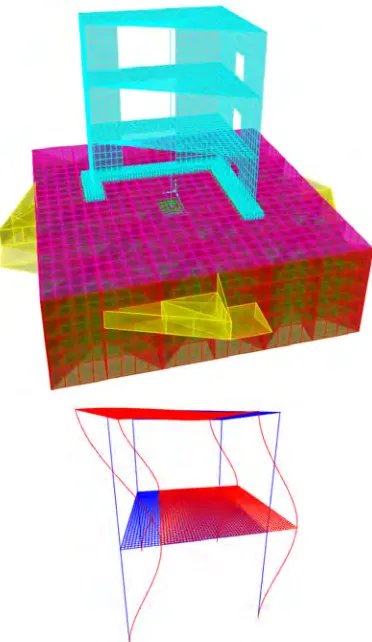
The second structure is a reinforced concrete frame with 2 storeys. This mock-up was tested in the CEA Saclay lab in 2004, being one of the mock-ups tested for the ECOLEADER European project.
The mass of the mock-up is 33 tons.
Its main dimensions are 7m high and a surface of 4m x 4m.
Figure 7 : More complex and realistic structures.
5
RESULTS
The evaluation is done by studying the frequency decrease of the mock-up between the configurations “on a rigid soil” and “on the shaking table platform”.
This study was just performed for each flexion and vertical mode of the mock-up; generally the major ones.
Two abacuses have been created to analyse these results:
- A first one for the mock-up flexion modes: with the modal mass and the centre of mass of the mock-up (flexion moment), we can read the frequency decrease between the two configurations “on a rigid soil” and “on the platform”.
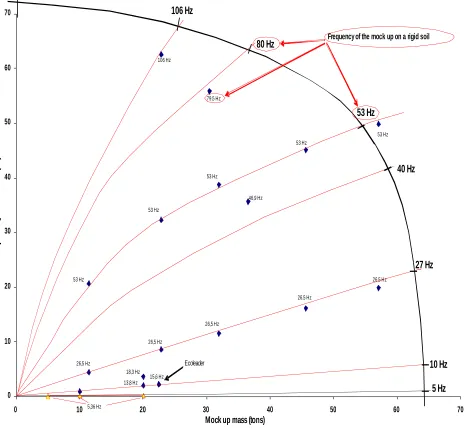
- Another for the mock-up vertical modes: with the modal mass of the mock-up, we can deduce the frequency decrease between these configurations “on a rigid soil” and “on the platform”.
frequency decrease is very correct. That means that the actuators are indeed rigid and that the frequency decrease is not due to them.
0 5 10 15 20 25 30 35
0 20 40 60 80 100 120 140 160 180
Momentum at the botom of the mock up (ton.m) = modal mass x height of the centre of mass
F r e q u e n c y d e c r e a s e ( % ) 3,73 Hz 5 Hz 33,7 Hz 21,4 Hz 2,56 Hz 2,64 Hz 11,1 Hz 6,8 Hz 7,3 Hz
Camus Ox et Oy
Ecoleader 11 Hz
SMART mode 1 on a rigid plate SMART mode 2 on a rigid plate
16 Hz 21 Hz 34 Hz 8 Hz 5 Hz 3 Hz 5,3 Hz 5,3 Hz 5,3 Hz 5,3 Hz 8,02 Hz 14,4 Hz 10,6 Hz 10,6 Hz 10,6 Hz 10,6 Hz 10,6 Hz 5,3 Hz 1,44 Hz
Frequency of the mock up on a rigid soil
Abacus for Flexion modes
SMART mode 1 without rigid plate
8,02 Hz
SMART mode 2 on a rigid plate 14,4 Hz
Abacus for vertical modes
0 10 20 30 40 50 60 700 10 20 30 40 50 60 70
Mock up mass (tons)
F r e q u e n c y d e c r e a s e ( % ) 18,3 Hz 106 Hz 79,5 Hz 46,9 Hz 13,8 Hz 5,36 Hz 53 Hz 26,5 Hz Ecoleader 26,5 Hz 26,5 Hz 26,5 Hz 26,5 Hz 15,6 Hz 53 Hz 53 Hz 53 Hz 53 Hz 5 Hz 10 Hz 27 Hz 40 Hz 53 Hz 80 Hz 106 Hz
Frequency of the mock up on a rigid soil
Figure 9 : Abacus for vertical modes.
These simple abacuses are a first approximation allowing a quick evaluation of the frequencies decrease for a mock-up fixed to the Azalée platform.
When a very high decrease is expected, it is now possible to perform a numerical analysis with the mock-up placed on the simplified model of the Azalée platform.
6
CONCLUSION
In shaking table studies, a main attention is paid to the design of the foundation and to the anchorage of the structure. All analyses are made considering a completely rigid shaking table: rigid actuators and rigid platform. However, since quite a long time, an interaction between the shaking table and the structure has been clearly observed for massive structures: a decrease of frequency between the structures “on the shaking table” and “on a rigid soil” has been calculated. This article presented the study of the validity domain of a rigid “Azalée” shaking table of the CEA Saclay laboratory (France).
This study demonstrates that, for this large shaking table, most of this interaction is due to the platform deformation during the tests. Two abacuses have been obtained using a simplified structure for flexion and vertical modes, without local deformations between the mock-up and the platform. Those two abacuses have been validated with three large experimental tests performed in the last 10 years at Saclay (CAMUS, ECOLEADER and SMART projects). Using those abacuses, it’s now easy to get an evaluation of the minimum decrease of frequency that will have a mock-up fixed on the platform. If this first evaluation shows an important interaction, a more precise study is needed: a simplified FE model of the platform is available and allows a definite evaluation of the interaction. A second evaluation takes into account the local deformations between the mock-up and the platform. For large mock-ups, these local deformations can induce about 50% of frequency decrease.
In previous Azalée shaking table tests, a major attention has been taken during the design of the foundation and anchorage of the structure. Some evaluations of the interaction were made, after test, using simplified models. This study will permit experimental and numerical engineers to better take care, before tests (during the design), of the boundary conditions between the platform of the shaking table “Azalée” and the mock-up. On the Azalée shaking table, more precise comparisons to numerical analyses of large shaking table tests will now be possible too.
REFERENCES
Bairrao, R. Shaking Table Testing. Chapter of the book “Modern Testing Techniques for Structural Systems”, pp. 165/196 (2008). Editors O.S.Bursi and D.J.Wagg. Publisher Springer Verlag (ISBN-978-3-211-09444-0).
Bairrao, R., Falcao, M.J., Carydis, P., Mouzakis, H., Karapitta, L. and Queval, J.C. Performance Benchmark of Three Major European Shaking Tables. 13th European Conference on Earthquake Engineering, paper 110, Geneva, Switzerland (September/2006)
Blondet, M. and Esparza, C. Analysis of Shaking Table-Structure Interaction Effects during Seismic Simulation Tests. Earthquake Engineering and Structural Dynamics, vol. 16, pp. 473/490 (1988).
Combescure, D. and Ragueneau, F. CAMUS2000 Benchmark. Experimental Results and Specifications to the Participants. (2002). Report CEA/SEMT/EMSI/RT/02-067/A.