University of Windsor University of Windsor
Scholarship at UWindsor
Scholarship at UWindsor
Electronic Theses and Dissertations Theses, Dissertations, and Major Papers
4-14-2017
Micro-mechanisms of Surface Defects Induced on Aluminum
Micro-mechanisms of Surface Defects Induced on Aluminum
Alloys during Plastic Deformation at Elevated Temperatures
Alloys during Plastic Deformation at Elevated Temperatures
Olufisayo Gali University of Windsor
Follow this and additional works at: https://scholar.uwindsor.ca/etd
Recommended Citation Recommended Citation
Gali, Olufisayo, "Micro-mechanisms of Surface Defects Induced on Aluminum Alloys during Plastic Deformation at Elevated Temperatures" (2017). Electronic Theses and Dissertations. 5936.
https://scholar.uwindsor.ca/etd/5936
This online database contains the full-text of PhD dissertations and Masters’ theses of University of Windsor students from 1954 forward. These documents are made available for personal study and research purposes only, in accordance with the Canadian Copyright Act and the Creative Commons license—CC BY-NC-ND (Attribution, Non-Commercial, No Derivative Works). Under this license, works must always be attributed to the copyright holder (original author), cannot be used for any commercial purposes, and may not be altered. Any other use would require the permission of the copyright holder. Students may inquire about withdrawing their dissertation and/or thesis from this database. For additional inquiries, please contact the repository administrator via email
Micro-mechanisms of Surface Defects Induced on Aluminum
Alloys during Plastic Deformation at Elevated Temperatures
By
Olufisayo A. Gali
A Dissertation
Submitted to the Faculty of Graduate Studies
through the Department of Mechanical, Automotive & Materials Engineering in Partial Fulfillment of the Requirements for
the Degree of Doctor of Philosophy at the University of Windsor
Windsor, Ontario, Canada
2017
Micro-mechanisms of Surface Defects Induced on Aluminum Alloys
during Plastic Deformation at Elevated Temperatures
By
Olufisayo A. Gali
APPROVED BY:
______________________________________________ G. M. Scamans, External Examiner
Brunel University London
___________________________________________ N. Biswas
Department of Civil & Environment Engineering
______________________________________ D. Green
Department of Mechanical, Automotive & Materials Engineering
______________________________________________ A. T. Alpas
Department of Mechanical, Automotive & Materials Engineering
______________________________________________ J. H. Hunter, Co-advisor
Novelis Global Research & Technology Center
______________________________________________ A. R. Riahi, Co-advisor
Department of Mechanical, Automotive & Materials Engineering
iii
DECLARATION OF CO-AUTHORSHIP / PREVIOUS PUBLICATION
I. Co-Authorship Declaration
I hereby declare that this thesis incorporates documentation of research performed
by the author under the supervision of Dr. A.R. Riahi and Dr. J.A. Hunter. The
design of the experiments and the collection of electron images in Chapter 1 were
performed jointly by Mr. Q. Zhao (University of Windsor) and the author. The
interpretation of the images and further analysis were carried out by the author
himself. Dr. M. Shafiei (Novelis Global Research & Technology Center) assisted
with the provisions of samples and an industrial perspective during discussions of
the results analyzed by the author.
I am aware of the University of Windsor Senate Policy on Authorship and I
certify that I have properly acknowledged the contribution of other researchers to
my thesis, and have obtained written permission from each of the co-author(s) to
include the above material(s) in my thesis.
I certify that, with the above qualification, this thesis, and the research to
which it refers, is the product of my own work.
II. Declaration of Previous Publication
This thesis includes material from nine original peer reviewed journal articles that
iv
Thesis Chapter Publication title/full citation Publication status*
Chapter 2 O. A. Gali, M. Shafiei, J.A. Hunter, Qi Zhao, A.R. Riahi, “The formation of micro-blisters on
Al–Mg alloy surfaces during hot rolling”, Tribology International 87 (2015) 65–71.
Published
Chapter 3 O. A. Gali, M. Shafiei, J.A. Hunter, A.R. Riahi, “A study of the development of micro-cracks in surface/near surface of aluminum–manganese alloys during hot rolling”, Materials Science &
Engineering A 627 (2015) 191–204.
Published
Chapter 4 O. A. Gali, M. Shafiei, J.A. Hunter, A.R. Riahi, “The influence of hot rolling on oxide
development within micro-cracks of aluminum–magnesium alloys”, Materials Science & Engineering A 618 (2014) 129–141.
Published
Chapter 5 O. A. Gali, M. Shafiei, J.A. Hunter, A.R. Riahi, “The characterization of near-surface defects evolved on aluminum–manganese alloys during
hot rolling”, Surf. Interface Anal. 48 (2015) 877-888.
Published
Chapter 6 O. A. Gali, M. Shafiei, J.A. Hunter, A.R. Riahi, “The development of near-surface microstructures during hot rolling of aluminum–magnesium alloys in relation to work roll topography”, Surf. Interface Anal. 48
(2015) 889-898.
Published
Chapter 7 O. A. Gali, M. Shafiei, J.A. Hunter, A.R. Riahi, “The influence of work roll roughness on the surface/ near-surface microstructure evolution
of hot rolled aluminum-magnesium alloys”, Journal of Materials Processing Technology
237 (2016) 331-341.
v
Chapter 8 O. A. Gali, M. Shafiei, J.A. Hunter, A.R. Riahi, “The tribological behavior of PVD coated work
roll surfaces during rolling of aluminum”, Surface & Coatings Technology 260 (2014)
230–238.
Published
Chapter 9 O. A. Gali, M. Shafiei, J.A. Hunter, A.R. Riahi, “The initiation of roll coating buildup during
thermomechanical processing of aluminum-magnesium alloys”, Surface & Coating
Technology 308 (2016) 328-336.
Published
Chapter 10 O. A. Gali, A.R. Riahi, A.T. Alpas, “The effect of surface conditions on the elevated temperature sliding contact deformation of AA5083 alloy”, Wear 330 (2015) 309–319.
Published
I certify that I have obtained a written permission from the copyright
owner(s) to include the above published material(s) in my thesis. I certify that the
above material describes work completed during my registration as graduate
student at the University of Windsor.
I declare that, to the best of my knowledge, my thesis does not infringe
upon anyone’s copyright nor violate any proprietary rights and that any ideas,
techniques, quotations, or any other material from the work of other people
included in my thesis, published or otherwise, are fully acknowledged in
accordance with the standard referencing practices. Furthermore, to the extent that
I have included copyrighted material that surpasses the bounds of fair dealing
within the meaning of the Canada Copyright Act, I certify that I have obtained a
written permission from the copyright owner(s) to include such material(s) in my
vi
I declare that this is a true copy of my thesis, including any final revisions,
as approved by my thesis committee and the Graduate Studies office, and that this
thesis has not been submitted for a higher degree to any other University or
vii ABSTRACT
Near-surface deformed layers developed on aluminum alloys significantly
influence the corrosion and tribological behavior as well as reduce the surface
quality of the rolled aluminum. The evolution of the near-surface microstructures
induced on magnesium containing aluminum alloys during thermomechanical
processing has been investigated with the aim generating an understanding of the
influence of individual forming parameters on its evolution and examine the
microstructure of the roll coating induced on the mating steel roll through material
transfer during rolling. The micro-mechanisms related to the various features of
near-surface microstructure developed during tribological conditions of the
simulated hot rolling process were identified.
Thermomechanical processing experiments were performed with the aid of
hot rolling (operating temperature: 550 to 460 °C, 4, 10 and 20 rolling pass
schedules) and hot forming (operating temperature: 350 to 545 °C, strain rate: 4 ×
10-2 s-1) tribo-simulators. The surface, near-surface features and material transfer
induced during the elevated temperature plastic deformation were examined and
characterized employing optical interferometry, SEM/EDS, FIB and TEM.
Near-surface features characterized on the rolled aluminum alloys
included; cracks, fractured intermetallic particles, aluminum nano-particles, oxide
decorated grain boundaries, rolled-in oxides, shingles and blisters. These features
were related to various individual rolling parameters which included, the work roll
roughness, which induced the formation of shingles, rolling marks and were
viii
depth of the near-surface damage. The enhanced stresses and strains experienced
during rolling were related to the formation and propagation of cracks, the
nanocrystalline structure of the near-surface layers and aluminum nano-particles.
The mechanism of the evolution of the near-surface microstructure were
determined to include grain boundary sliding which induced the cracks at the
surface and subsurface of the alloy, magnesium diffusion to free surfaces, crack
propagation from shear stresses and the shear strains inducing the nanocrystalline
grain structure, the formation of shingles by the shear deformation of
micro-wedges induced by the work roll grooves, and the deformation of this oxide
covered micro-wedges inducing the rolled-in oxides. Magnesium diffusion to free
surfaces was identified as inducing crack healing due to the formation of MgO
within cracks and was responsible for the oxide decorated grain boundaries.
An examination of the roll coating revealed a complex layered
microstructure that was induced through tribo-chemical and mechanical
entrapment mechanisms. The microstructure of the roll coating suggested that the
work roll material and the rolled aluminum alloy were essential in determining its
composition and structure.
Subsequent hot forming processes revealed the rich oxide-layer of the
near-surface microstructure was beneficial for reducing the coefficient of friction during
tribological contact with the steel die. Damage to the microstructure include cracks
induced from grain boundary sliding of near-surface grains and the formation of
ix
DEDICATION
To the giants, who were kind enough to lift me up The light bearers, who continued to light my way
The oceans of enlightenment, who let me drink from their wisdom I am humbled and truly grateful,
To my late grandparents Mr. & Mrs. F.O.C. Akinpelu, Your boundless love continues to sustain us
AND
To my nephews, who continue to bring meaning to all my endeavours, FINALLY
x
ACKNOWLEDGEMENTS
It is only right that I begin with acknowledging my constant guide through
my time at the University of Windsor, my supervisor Dr. A.R. Riahi. For over six
years, he has played the role of mentor, confidant, teacher and friend. He has been
a constant source of motivation, a well of knowledge, and my ever patient guide
through this journey. I am as ever honored to have had the pleasure to work beside
him. My heartfelt gratitude must also be extended to my industrial supervisor, Dr.
J.A. Hunter, who from the moment we met has been a source of inspiration and
in-depth knowledge. I am indebted to him for the contagious passion he has brought
to my research work, his guidance, invaluable insights, encouragement and for
constantly bringing to light the importance this work from a research and industrial
aspect.
My sincere gratitude to Dr. A.T. Alpas, who has not only had a front row
seat through my “evolution” as a researcher and tribologist, but has played a
crucial role in ensuring my development and growth. He has always been a
constant guiding light, and a standard of excellence I hope one day to attain. I
would like to sincerely thank my other committee members, Dr. D. Green and Dr.
N. Biswas for their precious suggestions and inspirational discussions. It has been
a refreshing experience to be a recipient of their wisdom, enthusiasm, patience,
astute observations and astounding expertise. I am especially grateful to Dr. G. M.
Scamans, who as one of the key researchers of aluminum alloys, lit the way into
the study of near-surface microstructures. I am grateful for the stimulating
xi
I would also like to gratefully acknowledge Dr. M. Shafiei, who through
the years has continued to provide his support and valuable suggestions. My
deep-felt gratitude to Dr. A. Edrisy, who ardently introduced and infected me with her
passion for materials research. Her continued support and friendship have been a
valued treasure I continue to strive to deserve.
I am eternally grateful to Dr. G. de Silveira for providing access to the
Canadian Centre of Electron Microscopy (CCEM) at McMaster University,
Hamilton, Canada and Dr. A. Korinek (CCEM) for his assistance and contribution
to discussions on TEM analyses. My deepest admiration and respect is extended to
Ms. S. Lackie, who through the years has continued to ensure we obtained high
quality SEM images, and continues to set the bar for high quality as well as above
and beyond the line of duty services. My profound appreciation is extended to the
technical support team; Mr. A. Jenner, who has continued to solve every problem
we throw at him, and making it all look so easy; Mr. P. Seguin, for always
generously giving of his time and wisdom; Ms. T. Pellegrino, Ms. A. “Amazing”
Haskell and Ms. S. “Superwoman” Marchand, my heroes who handle every issue
and task with the style and grace of royalty.
My time at the University of Windsor was made enjoyable, in no little part,
to the past and present researchers and colleagues I have come to call family. I am
forever indebted to them, individually, for their friendship, encouragement and
support. Their contributions to enabling my research, remains in no way unsung. I
am grateful for all the great memories that they have given me and for making the
xii
I gratefully acknowledge the Natural Science and Engineering Council of
Canada (NSERC) and Novelis Global Technology Centre for their financial
support. I also appreciatively recognize the University of Windsor, for providing
the In-Program Doctoral Scholarship.
Finally, and in no way least, my sincere love and respect is extended
towards my family, for their unconditional love and support. My father, who
continues to be the paradigm for strength and my moral guide, through the years
you have always held me above your shoulders, supporting me through all my
endeavors, I remain as always humbled by you. My mother, for just being the most
awesome person ever, always finding the good in me, having a listening ear and
knowing just what to say, every time. My brother and sister, for their wisdom,
support, love, encouragement and for keeping the triangle that is us, strong. My
xiii
TABLE OF CONTENTS
DECLARATION OF CO-AUTHORSHIP / PREVIOUS PUBLICATION ... iii
ABSTRACT ... vii
DEDICATION ... ix
ACKNOWLEDGEMENTS ...x
LIST OF TABLES ... xviii
LIST OF FIGURES ... xix
NOMENCLATURE ... xxxix
CHAPTER 1 INTRODUCTION ...1
1.1 GENERAL OVERVIEW ... 1
1.2 SCOPE OF RESEARCH ... 9
1.3 OBJECTIVES ... 14
1.4 LITERATURE REVIEW ... 17
1.4.1 Surface features and defects induced on aluminum alloys during elevated temperature forming ... 17
1.4.2 Surface oxide layers ... 22
1.4.3 Tribolayers ... 28
1.4.4 Near-surface deformed layers ... 29
1.4.5 Near-surface deformed layer influence on subsequent forming processes ... 39
1.4.6 Aluminum transfer in elevated temperature forming ... 47
1.5 SUMMARY OF LITERATURE REVIEW ... 55
BIBLIOGRAPHY ... 57
CHAPTER 2 THE FORMATION OF MICRO-BLISTERS ON AL-MG ALLOY SURFACES DURING HOT ROLLING ...74
2.1 INTRODUCTION ... 74
2.2 EXPERIMENTAL PROCEDURE ... 76
2.3 EXPERIMENTAL RESULTS ... 79
xiv
2.3.2 Surface Analysis of Al-Mg Work Piece ... 80
2.3.3 Subsurface Analysis of Micro-blisters ... 84
2.4 DISCUSSION ... 87
2.5 CONLUSIONS ... 91
BIBLIOGRAPHY ... 91
CHAPTER 3 A STUDY OF THE DEVELOPMENT OF MICRO-CRACKS IN SURFACE/NEAR SURFACE OF ALUMINUM-MANGANESE ALLOYS DURING HOT ROLLING ...95
3.1 INTRODUCTION ... 95
3.2 EXPERIMENTAL PROCEDURE ... 97
3.3 EXPERIMENTAL RESULTS ... 99
3.3.1 Surface Morphology Developed During Deformation: Surface Roughness ... 99
3.3.1.1 Surface Roughness ... 99
3.3.1.2 Transverse Cracks on Alloy Surface ... 104
3.3.2 Surface Morphology of Crack Evolution during Deformation ... 107
3.3.2.1 Subsurface Crack Propagation ... 107
3.3.2.2 TEM Characterization of Subsurface Cracks ... 114
3.4 DISCUSSION ... 121
3.4.1 Effect of Rolling Passes on Crack Evolution ... 121
3.4.2 Characterization of Transverse Cracks ... 122
3.4.3 Crack Healing ... 124
3.5 CONCLUSIONS ... 125
BIBLIOGRAPHY ... 126
CHAPTER 4 THE INFLUENCE OF HOT ROLLING ON OXIDE DEVELOPMENT WITHIN MICRO-CRACKS OF ALUMINUM-MAGNESIUM ALLOYS ...130
4.1 INTRODUCTION ... 130
4.2 EXPERIMENTAL PROCEDURE ... 132
4.3 EXPERIMENTAL RESULTS ... 133
4.3.1 Surface Morphology Developed During Deformation ... 133
4.3.2 Surface Morphology of Micro-cracks ... 138
xv
4.3.4 TEM Analysis of Near-Surface Oxides ... 151
4.4 DISCUSSION ... 153
4.5 CONCLUSIONS ... 157
BIBLIOGRAPHY ... 158
CHAPTER 5 THE CHARACTERIZATION OF NEAR-SURFACE DEFECTS EVOLVED ON ALUMINUM-MANGANESE ALLOYS DURING HOT ROLLING ...161
5.1 INTRODUCTION ... 161
5.2 EXPERIMENTAL PROCEDURE ... 163
5.3 EXPERIMENTAL RESULTS ... 164
5.3.1 Surface Analysis of the Hot Rolled Al-Mn Alloy ... 164
5.3.2 Near-Surface Microstructure of the Hot Rolled Al-Mn Alloy ... 169
5.3.3 TEM Characterization of Near-Surface Features... 172
5.4 DISCUSSION ... 183
5.5 CONCLUSIONS ... 186
BIBLIOGRAPHY ... 187
CHAPTER 6 THE DEVELOPMENT OF NEAR-SURFACE MICROSTRUCTURES DURING HOT ROLLING OF ALUMINUM-MAGNESIUM ALLOYS IN RELATION TO WORK ROLL TOPOGRAPHY ...190
6.1 INTRODUCTION ... 190
6.2 EXPERIMENTAL PROCEDURE ... 192
6.3 EXPERIMENTAL RESULTS ... 194
6.3.1 Surface Analysis of the Rolled Al-Mg Alloy ... 194
6.3.2 Subsurface Analysis of the Rolled Al-Mg Alloy ... 198
6.3.3 TEM Characterization of the Near-Surface Regions of the Rolled Al-Mg Alloy ... 201
6.4 DISCUSSION ... 210
6.5 CONCLUSIONS ... 214
BIBLIOGRAPHY ... 215
CHAPTER 7 THE INFLUENCE OF WORK ROLL ROUGHNESS ON THE SURFACE/NEAR-SURFACE MICROSTRUCTURE EVOLUTION OF HOT ROLLED ALUMINUM-MAGNESIUM ALLOYS ...219
7.1 INTRODUCTION ... 219
xvi
7.3 EXPERIMENTAL RESULTS ... 226
7.3.1 Surface Morphology of the Rolled Al-Mg Samples ... 226
7.3.2 Characterization of Surface Features on the Rolled Al-Mg samples... 228
7.3.3 Subsurface Analysis of the Rolled Al-Mg Samples ... 233
7.4 DISCUSSION ... 238
7.5 CONCLUSIONS ... 244
BIBLIOGRAPHY ... 245
CHAPTER 8 THE TRIBOLOGICAL BEHAVIOR OF PVD COATED WORK ROLL SURFACES DURING ROLLING OF ALUMINUM ...248
8.1 INTRODUCTION ... 248
8.2 EXPERIMENTAL PROCEDURE ... 252
8.3 EXPERIMENTAL RESULTS ... 254
8.3.1 Coefficient of friction (COF) of Coatings ... 254
8.3.2 Wear of Coated and Uncoated Rolls ... 257
8.3.3 Microstructural Analysis of Coatings ... 263
8.4 DISCUSSION ... 268
8.5 CONCLUSIONS ... 272
BIBLIOGRAPHY ... 273
CHAPTER 9 THE INITIATION OF ROLL COATING BUILDUP DURING THERMOMECHANICAL PROCESSING OF ALUMINUM-MAGNESIUM ALLOYS ...278
9.1 INTRODUCTION ... 278
9.2 EXPERIMENTAL PROCEDURE ... 282
9.3 EXPERIMENTAL RESULTS ... 283
9.3.1 Surface Analysis of Roll Coating ... 283
9.3.2 Subsurface Morphology of Roll Coating ... 287
9.3.3 Microstructural Characterization of the Roll Coating ... 290
9.4 DISCUSSION ... 295
9.5 CONCLUSIONS ... 300
xvii
CHAPTER 10 THE EFFECT OF SURFACE CONDITIONS ON THE ELEVATED TEMPERATURE SLIDING CONTACT DEFORMATION OF
AA5083 ALLOY ...305
10.1 INTRODUCTION ... 305
10.2 EXPERIMENTAL PROCEDURE ... 308
10.3 EXPERIMENTAL RESULTS ... 310
10.3.1 Surface Roughness of AA5083 Alloy Induced by Tensile Deformation ... 310
10.3.2 Coefficient of Friction (COF) of the As-Received and Polished AA5083 Strips... 311
10.3.3 Surface Damage Induced by Sliding Contact ... 313
10.3.3.1 Material Transfer to P20 Steel Pin ... 313
10.3.3.2 Sliding Damage on Wear Track of AA5083 ... 315
10.3.4 Damage Morphologies of AA5083 due to Tensile Deformation ... 317
10.3.4.1 Damage Features of As-Received AA5083 Surfaces ... 317
10.3.4.2 Damage Features of Polished AA5083 Surfaces ... 320
10.3.5 HRSEM Analyses of Fibres Formed within Cracks on As-Received AA5083 Surfaces ... 323
10.3.6 TEM Characterization of Fibres ... 326
10.4 DISCUSSION ... 329
10.4.1 Adhesion and Friction Mechanisms during High Temperature Sliding ... 329
10.4.2 Role of Oxide Fibres on the Tribological Behaviour ... 332
10.5 CONCLUSIONS ... 335
BIBLIOGRAPHY ... 337
CHAPTER 11 GENERAL SUMMARY AND CONCLUSIONS ...342
11.1 The Influence of Individual Rolling Parameters on the Surface and Near-Surface Microstructure Features ... 347
11.2 The Development and Influence of Roll Coatings ... 354
11.3 Micro-Mechanisms Responsible for the NSM Features... 358
11.4 General Conclusions ... 362
11.5 Suggestions for Future Work ... 364
BIBLIOGRAPHY ... 366
APPENDIX A ...372
xviii
LIST OF TABLES
3.1 Pass schedules in the hot rolling experiments………99
11.1 Summary Table of the individual rolling parameters and the related
near-surface microstructure features………354
11.2 Summary Table of the near-surface microstructure features and their related
xix
LIST OF FIGURES
1.1 Typical processing steps involved in the thermomechanical processing of
aluminum [59]…….………...7
1.2 Typical process route for an aluminum can body stock [34].……….7
1.3 Inlet zone of rolling region displaying on film of aluminum stock and roll
[40]……….…...8
1.4 The strip rolling process and a realistic toolpiece/workpiece interface
[57]………..………..8
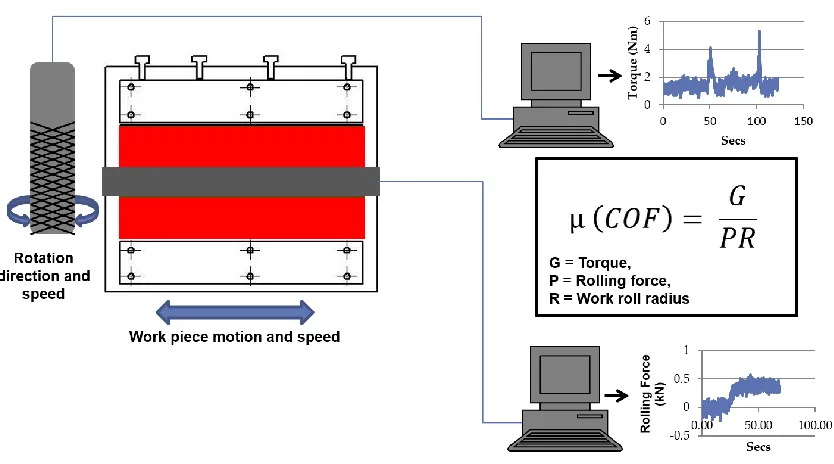
1.5 Schematic diagram of the rolling tribo-simulator displaying the motion
directions of the work roll and work piece including sample torque and rolling
force data obtained during a rolling pass
……….………16
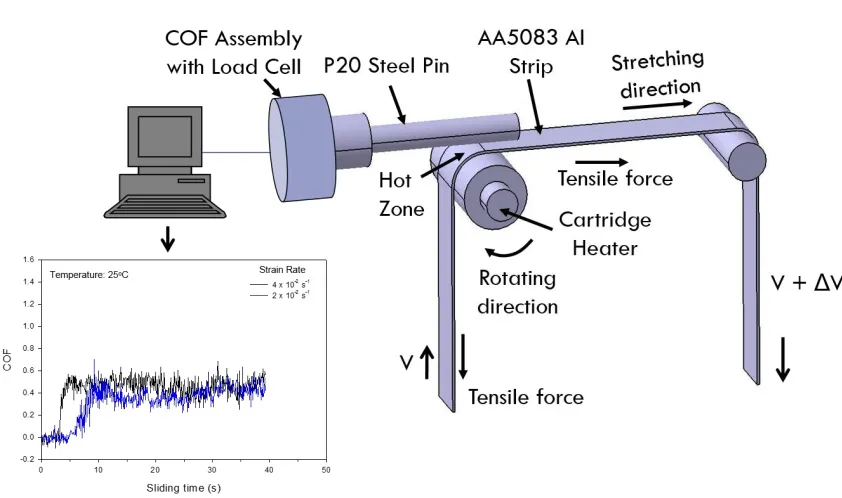
1.6 Schematic diagram of the forming tribo-simulator displaying the configuration
of the set-up and a sample COF data acquired during the forming
test………...………17
1.7 Secondary electron micrograph displaying the surface features of a rolled
aluminum alloy [99]………22
1.8 Schematic model of growth of oxide on Al-Mg alloys during heat treatment
[115]..……….27
1.9 Surface layer on hot rolled aluminum alloy
xx
1.10 Schematic illustration of near-surface microstructure on hot rolled product
[144]..……….37
1.11 Transmission electron micrograph of ultramicrotomed section of the
surface/surface region of an AA3005 aluminum alloy showing the
near-surface deformed layer with 5 hot rolling passes [68]………38
1.12 Schematic diagrams showing the microstructure of near-surface deformed
layer introduced by rolling: (a) type A and (b) type B [68]………39
1.13 Schematic diagrams showing the delamination process of the near-surface
layer (a) crack initiation (b) crack propagation (c) fracture [140]..………43
1.14 Examination of the Al-Mg plastically deformed at sample at 545 °C and
4×10⁻¹s-1 displaying (a) secondary electron image of oxide cracks which follow the
underlying Al-Mg grain boundaries and oxide fibres are stretched across the faces
of these cracks, (b) FIB cross section taken along the axis of tensile axis, showing
the surface offsets due to GBS of Al-Mg grains and the corresponding fibres
formed, and (c) TEM micrograph displaying the fibre sample formation at the
surface step formed by the sliding grains [86]………....44
1.15 Schematic representation of two types of surface damage features at two
temperatures: (a) cracks appeared on the oxide layer at 420 °C and (b) superplastic
oxide ligaments, triggered by surface offset due to GBS, observed at 545 °C [58]
xxi
1.16 Schematics showing (a) GBS of bulk Al-Mg grains lead to the formation of
steps at the surface and (b) surface step formed at the grain boundary due to
relative sliding between grain A and grain B of Al-Mg and the tribolayer above the
grains stretched over this step generating a fibrous structure [86].……….46
1.17 Surface morphology of the Al-Mg sample deformed under 4 x 10⁻² s-1 strain
rate showing cracks and fibres at (a) 150 °C, (b) 200 °C, (c) 250 °C, (d) 300 °C, (e)
350 °C, (f) 400 °C and (g) 450 °C
[127]……….………...47
1.18 Adhesive galling results on the tool steel and sheet metal contact
[153]………...…….54
1.19 Image showing material transferred (roll coating) from the stock surface to
the work roll after the two-pass rolling [34].………...…………55
2.1 Surface profilometry images displaying the surface topographies of (a) the
AISI 440C steel work roll surface with protruding carbides and (b) AISI 52100
steel work roll surface……….78
2.2 (a) SEM images of the AISI 440C steel work roll surface after 1 hot rolling
pass with material and (b) EDS maps of AISI 440C steel work roll displaying
composition of carbides and material transfer. Cyan represents chromium, red
represents carbon, blue represents magnesium, magenta represents aluminum and
green represents oxygen……….80
2.3 SEM images of the surface of Al-Mg alloy after 1 hot rolling pass showing (a)
xxii
rich piles on sample rolled with AISI 440C under high lubrication (c) magnesium
rich piles on sample rolled with AISI 52100 under low lubrication and (d)
magnesium rich piles on sample rolled with AISI 52100 under high lubrication.
………83
2.4 HR-SEM images of the blisters formed on Al-Mg alloy surface alloy after 1
hot rolling pass under low lubrication showing (a) surface texture of blister and
oxide-rich near surface layer (b) nano-scale bumps on the blister surface and (c)
damaged blister revealing debris inside the hollow shell………84
2.5 Cross section of blister displaying (a) surface features within the blister
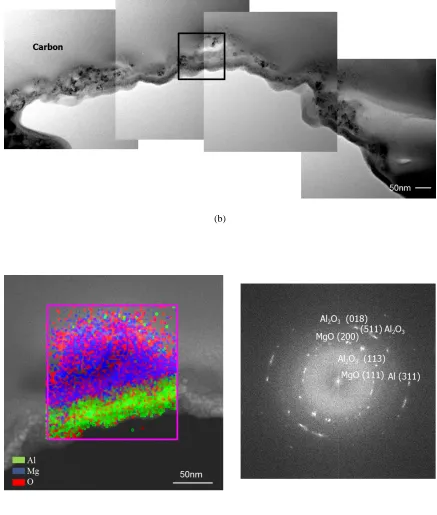
(b)transmission electron micrograph image of the blister, (c) EDS map overlay
showing elemental composition of blister shell from the region within the insert
box in (a) with elements Al (green), O (red) and Mg (blue) and (d) SAED pattern
of the region shown in (c)………...86
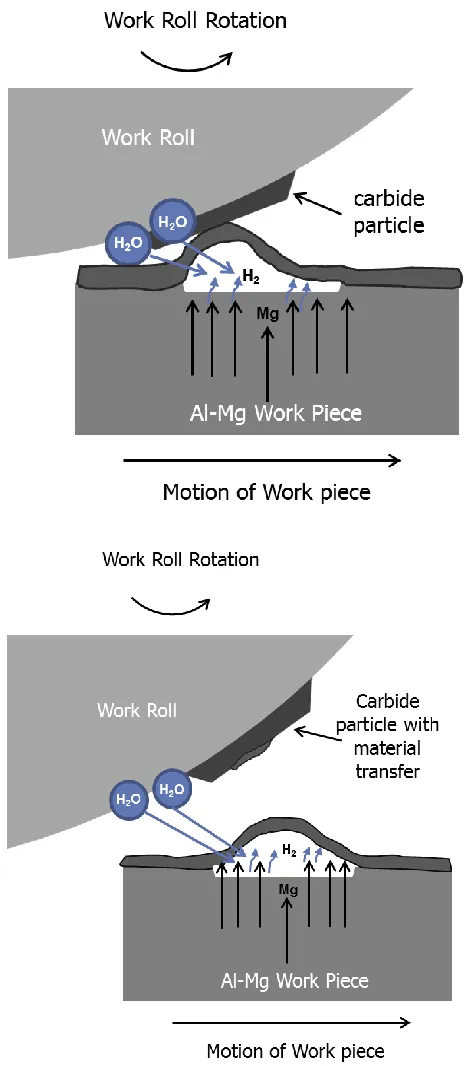
2.6 Schematic for the mechanism of micro-blister formation on Al-Mg alloys
during hot rolling………90
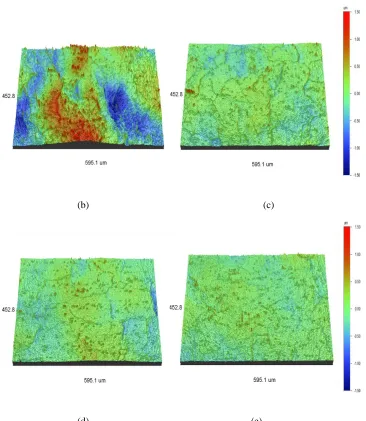
3.1 Surface profilometry images displaying the surface roughness (a) unrolled
polished surface (b) after 1 rolling pass, (c) 2 passes, (d) 3passes, and (e) 4passes.
………...……102
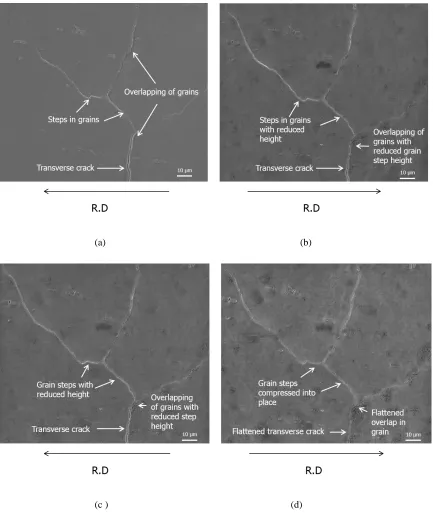
3.2 Scanning electron images of the Al-Mn surface taken from the same region
after deformation at (a) 1 pass, (b) 2 passes, (c) 3 passes, (d) 4 passes…………103
3.3 Scanning electron images of Al-Mn surface showing evolution of the same
xxiii
3.4 Scanning electron images of surface at high magnification showing evolution
of surface crack and appearance of nano-cracks at (a) 1 pass, (b) 2 passes, (c) 3
passes and (d) 4 passes………..……106
3.5 FIB cross section image after 4 passes showing (a) scanning electron image of
surface cracks propagating into the subsurface (b) ion image of micro-cracks
propagating mainly along grain boundaries………..107
3.6 Scanning electron image of the two micro-cracks monitored (a) Crack 1 (b)
Crack 2………..110
3.7 FIB cross sectional images and EDS analysis of propagation of Crack 1 after
(a) 1 pass (b) 2 passes (c) 3 passes and (d) 4 passes……….113
3.8 FIB cross sectional image and EDS analysis of propagation of Crack 2 after (a)
1 pass and (b) 4 passes……….114
3.9 TEM micrograph of the of cross section of Crack 1 after 4 passes showing
crack propagation along grain boundaries and (b) EDS map from the boxed region
in (a)………..117
3.10 EDS line scan of the cross section of Crack 1 after 4 passes (a) across crack
and (b) along the grain boundary which the crack propagates………..118
3.11 Cross section of Crack 1 at 4 passes displaying (a) EDS map overlay of the Al
(green), O ( red) and Mg ( blue) and (b) Bright field HRTEM image of region
xxiv
3.12 HRTEM images of Crack 1, mapping the individual layers observed along
with 2D-FFT patterns taken from these layers confirming the amorphous to
crystalline transition of the crack face. Crack region mapped is displayed in the
insert above the HRTEM images………..120
4.1 Surface profilometry images displaying the surface topographies of the Al-Mg
alloy after (a) 1 and (b) 4 rolling passes………135
4.2 Scanning electron images of the surface of Al-Mg alloy after 1 rolling pass
showing (a) grain structure and (b) micro-cracks and dark spots (c) wavy surface
appearance and overlap at grain boundary. R.D referrers to the rolling direction.
………..……… 136
4.3 Scanning electron images showing of surface of Al-Mg alloy after 4 rolling
passes showing (a) grain structure and cracks across grains (b) MgO rich grain
boundaries and closed cracks and (c) dark wavy network………137
4.4 Cross section images of the Al-Mg alloy subsurface after 1 rolling pass,
showing crack propagation (a) along grain boundaries and (b) across grain
boundaries……….139
4.5 Cross section images of the Al-Mg alloy subsurface after 4 rolling passes
showing (a) crack propagating along grain boundary (b) MgO filled darken grain
boundary and (c) MgO covered intermetallic particles……….140
4.6 (a) Scanning transmission electron micrograph showing the structure of a
transverse crack at the subsurface after 1 rolling pass (b) energy dispersive
xxv
4.7 (a) Transmission electron micrographs showing the structure of a crack at the
subsurface on the alloy after 1 rolling pass (b) high resolution transmission
electron micrograph from the boxed region in (a) of the MgO platelets and (c)
select area electron diffraction image from the HRTEM………..145
4.8 (a) Scanning electron micrograph of the surface of the sample deformed with 4
rolling passes depicting where Focus ion milling cross section was made (b)
scanning transmission electron micrographs of subsurface showing the three
damaged areas labelled, of region within the box from the SEM image and (c)
Cack 1 (region within the inserted box in (b)) at higher magnification…………147
4.9 Energy dispersive spectrometry analyses taken from Crack 1 on the sample
with 4 rolling passes showing (a) elemental map of individual elements contained
in the crack1, and (b) EDS color mix, from the region within the box insert, with
aluminum represented by green, magnesium by red and carbon by blue……….148
4.10 Transmission electron micrograph of cross section of the subsurface after 4
rolling passes (previously displayed in Figure 8)……….……….149
4.11 (a) Transmission electron micrographs from Crack 1 showing its structure and
(b) matrix and crack face from the same crack at the subsurface region on the alloy
after 4 rolling passes………..150
4.12 (a) High resolution transmission electron micrographs and (b) selective area
electron diffraction analysis of area shown in (a) revealing the MgO nanocrystal
xxvi
4.13 Transmission electron micrographs of third damaged area (labelled 3) on 4
rolling pass deformed sample (b) region within the box insert showing the high
porosity of MgO………151
4.14 Scanning transmission electron cross sectional micrographs with elemental
linescan of near surface in crack region showing the surface oxide structure of
Al-Mg alloy after (a) 1 rolling pass (green represents aluminum, red indicates
magnesium and blue indicates oxygen) and (b) 4 rolling passes (green represents
carbon, red indicates magnesium, cyan indicates aluminum and purple indicates
oxygen)………..152
4.15 High resolution transmission electron micrographs showing the surface oxide
structure of Al-Mg alloy after (a) 1 rolling pass and (b) 4 rolling passes……….153
4.16 Scanning electron images of Al-Mg alloy surfaces after (a) 1 rolling pass and
heating cycle (b) 2 rolling passes………..157
5.1 Surface profile images displaying the surface topography of the Al-Mn alloy
after (a) 1pass and (b) 10passes………...166
5.2 Scanning electron images of the Al-Mn surface after deformation at (a) 1 pass
and (b) 10 passes………...167
5.3 Scanning electron images of the Al-Mn surface showing evolution of surface
crack after hot rolling for (a) 1 pass and (b) 10 passes……….……….167
5.4 Scanning electron image of the Al-Mn surface after 10 passes showing
xxvii
5.5 (a) Scanning electron images of the Al-Mn surface after 10 passes displaying
transverse micro-crack and (b) EDS map taken from the area in (a) displaying
magnesium-rich grain boundaries and cracks………...168
5.6 Scanning electron image of transverse micro-cracks after hot rolling (a) 1 pass
and (b) 10 passes………...170
5.7 FIB cross-sectional images of micro-crack propagation after (a) 1 pass and (b)
10 passes………..…………..171
5.8 FIB Cross-sectional image of near-surface damage after 10 passes displaying
transverse micro-crack propagation and MgO filled micro-crack………171
5.9 FIB cross-sectional images of the near-surface region after 10 passes showing
(a) transverse micro-crack with crevices on crack faces and (b) embedded
intermetallic particle surrounded by porous MgO………172
5.10 STEM micrographs of micro-cracks at near-surface of Al-Mn alloy after (a) 1
pass and (b) 10 pass……….………..175
5.11 TEM micrograph of micro-cracks displaying the nanocrystalline MgO layer
lining crack faces after (a) 1 pass and (b) 10 passes…….………177
5.12 Cross section of cracks displaying EDS map overlays and the accompanying
area they were taken from after (a) 1 pass and (b) 10 passes………178
5.13 STEM images of transverse micro-crack formed after 10 passes displaying
distinct oxide grains on the roughened crack face as well as nanocrystalline grains
xxviii
5.14 HRTEM images of the oxide-rich crack face accompanied with 2D-FTT
patterns after (a) 1 pass and (b) 10 passes……….180
5.15 Cross sectional (a) TEM image and (b) EDS line scan of Al-Mn near-surface
layer after 1 pass displaying the porous nanocrystalline magnesium-rich oxide
layer………...181
5.16 Cross sectional (a) TEM image and (b) EDS map of Al-Mn near-surface layer
after 10 passes displaying the porous nanocrystalline magnesium-rich oxide layer.
………...182
5.17 (a) TEM micrograph of the near-surface damage and (b) EDS map from the
same area displaying nano-particles embedded in the oxide layer of Al-Mn alloy
after 10 passes……….………..182
6.1 Surface topography images displaying the morphologies of the (a) smooth and
(b) rough work rolls………...194
6.2 Scanning electron images of Al-Mg alloy surfaces after a 10 pass hot rolling
schedule with (a) smooth work roll and (b) rough work roll………196
6.3 Scanning electron images of Al-Mg alloy surfaces displaying transverse cracks
after a 10 pass hot rolling schedule with (a) smooth work roll and (b) rough work
roll……….196
6.4 EDS maps of Al-Mg alloy surfaces after a 10 pass hot rolling schedule with (a)
xxix
6.5 Scanning electron image of the smooth rolled Al-Mg sample displaying
intermetallic particles embedded into the surface after a 10 pass hot rolling
schedule……….197
6.6 Cross-sectional secondary electron images displaying micro-cracks and
Al-nano-particles within the Al-Mg alloy subsurface after a 10 pass hot rolling
schedule with (a) smooth work roll and (b) rough work roll………200
6.7 Cross-sectional secondary electron images displaying the porous Mg-rich
oxide layer of the Al-Mg samples after a 10 pass hot rolling schedule with (a)
smooth work roll and (b) rough work roll……….……200
6.8 Cross-sectional secondary electron images of the Al-Mg alloy subsurface after
a 10 pass hot rolling schedule with the (a) smooth work roll and (b) rough work
roll, showing the areas used for TEM analysis……….201
6.9 Cross-sectional TEM images displaying the near-surface features of the Al-Mg
alloy subsurface after a 10 pass hot rolling schedule with (a) smooth work roll and
(b) rough work roll………205
6.10 Cross-sectional STEM images exposing the near-surface ultrafine grains and
roughened surfaces within (a) smooth rolled and (b) rough rolled Al-Mg samples
after a 10 pass hot rolling schedule. (c) and (d) corresponding EDS maps of areas
xxx
6.11 EDS analyses displaying the aluminum nano-particles embedded in porous
oxide of the Al-Mg alloy near-surface regions after a 10 pass hot rolling schedule
with the (a) smooth work roll and (b) rough work roll……….…………206
6.12 HRTEM micrographs revealing the nanocrystalline structure of the
magnesium-rich oxide of (a) smooth rolled and (b) rough rolled samples after a 10
pass schedule. Corresponding SAED patterns identifying MgO planes for (c)
smooth rolled and (d) rough rolled Al-Mg samples………..207
6.13 Cross-sectional TEM micrograph of the rough rolled Al-Mg alloy’s
near-surface region after a 10 pass hot rolling schedule displaying (a) implanted work
roll debris concealed by shingles and (b) EDS maps of area shown in (a)……...209
7.1 Schematic illustration of the rolling tribo-simulator set-up with arrows showing
the direction of motion………..225
7.2 Surface topographies of work rolls with an Ra of (a) 1.1 µm, and (b) 0.10 µm,
displaying discontinuous grooves……….…225
7.3 Optical micrograph of the polished unrolled Al-Mg alloy………..226
7.4 Surface profilometry images of the Al-Mg samples rolled with the 1.1 µm Ra
work roll displaying surface topographies after (a) 1 pass and (b) 10 passes…...227
7.5 Surface profilometry images of the Al-Mg samples rolled with the 0.1 µm Ra
xxxi
7.6 Scanning electron images of Al-Mg alloy surfaces after 1 hot rolling pass with
the (a) 1.1 µm Ra and (b) 0.1 µm Ra work rolls displaying shingles, grooves, ridges
and grain boundary overlaps……….230
7.7 Scanning electron images of Al-Mg alloy surfaces displaying transverse
micro-cracks and MgO islands after 1 hot rolling pass with the (a) 1.1 µm Ra and (b) 0.1
µm Ra work rolls………...230
7.8 Scanning electron images of Al-Mg alloy surfaces after a 10 pass hot rolling
schedule with the (a) 1.1 µm Ra and (b) 0.1 µm Ra work rolls displaying shingles,
grooves, ridges and grain boundaries………231
7.9 Scanning electron images of Al-Mg alloy surfaces displaying transverse
micro-cracks after a 10 pass hot rolling schedule with the (a) 1.1 µm Ra and (b) 0.1 µm Ra
work rolls………...231
7.10 Scanning electron images of Al-Mg alloy surfaces after a 10 pass hot rolling
schedule with the (a) 1.1 µm Ra and (b) 0.1 µm Ra work rolls displaying MgO-rich
cracks……….…232
7.11 EDS maps of Al-Mg alloy surfaces after a 10 pass hot rolling schedule with
the (a) 1.1 µm Ra and (b) 0.1 µm Ra work………232
7.12 Cross-sectional secondary electron images displaying the porous Mg-rich
oxide layer covering the ridges of the Al-Mg samples subsurface after a 10 pass
hot rolling schedule with the (a) ) 1.1 µm Ra and (b) 0.1 µm Ra work rolls…….235
7.13 Higher magnification cross-sectional secondary electron images (from regions
xxxii
distribution around the ridges on the Al-Mg samples after a 10 pass hot rolling
schedule with (a) 1.1 µm Ra and (b) 0.1 µm Ra work rolls………...236
7.14 Cross-sectional secondary electron images displaying transverse micro-cracks
within the Al-Mg alloy subsurface after a 10 pass hot rolling schedule with (a) 1.1
µm Ra and (b) 0.1 µm Ra work rolls………..237
7.15 Cross-sectional secondary electron images of the Al-Mg alloy’s near-surface
region rolled with the 1.1 µm Ra work roll after a 10 pass hot rolling schedule
displaying (a) the oxide distribution around a shingle and (b) higher magnification
image of the area highlighted in (a), displaying the microstructure of the head of
the shingle……….238
7.16 Work roll surface roughness vs. average depth of near-surface damage plot of
Al-Mg alloy for a 10 pass hot rolling schedule. Grey markers represent data
extracted from [16]………...………….………244
8.1 Average COF values for coatings during (a) dry cold rolling and (b) lubricated
hot rolling of AA1100 at 450°C………256
8.2 Spread on AA1100 for uncoated and coated rolls after hot rolling at 450°C.
………..……….257
8.3 SEM images displaying wear damage and aluminum transfer to (a) uncoated,
(b) TiAlN, (c) TiN, (d) TiCN, (e) CrN, (f) Cr, and (g) DLC coated rolls after hot
rolling AA1100 blocks at 450°C. The rolling direction for all images is from left to
xxxiii
8.4 EDS maps displaying aluminum transfer to (a) uncoated, (b) TiAlN, (c) TiN,
(d) TiCN, (e) CrN, (f) Cr, and (g) DLC rolls after hot rolling AA1100 blocks at
450°C. Blue represents aluminum, cyan represents oxygen and magenta represents
the main element………...262
8.5 Surface area fraction of uncoated and coated rolls covered with aluminum
transfer after hot rolling AA1100 blocks at 450°C………...263
8.6 Cross-sectional SEM images displaying aluminum transfer to (a) TiN (b) TiCN
(c) TiAlN (d) DLC (e) Cr (f) CrN coated rolls after hot rolling AA1100 block at
450°C………...266
8.7 (a) Scanning transmission electron micrograph and (b) EDS map of aluminum
transfer to the CrN coated roll after hot rolling of the AA1100 block at 450°C.
………...267
8.8 (a) Scanning transmission electron micrograph and (b) transmission electron
micrograph of aluminum adhered to the CrN coated rolls after hot rolling AA1100
block at 450°C………..267
8.9 EDS line scan of aluminum and chromium across the interface between the
adhered aluminum and CrN coating………..268
8.10 Plot displaying the area fraction covered in aluminum transfer vs COF for
each coated roll after hot rolling AA1100 blocks at 450°C………..272
9.1 SEM images of the roll coating initiated on the surface of the AISI 440C steel
work roll displaying (a) roll coating distribution (b) dark expanse surrounding the
xxxiv
thicker regions of the roll coating after 20 hot rolling passes against the Al-Mg
sample………285
9.2 SEM images displaying (a) the imprinted grain boundaries on the surface of
the AISI 440C steel work roll and (b) the grain boundaries on the Al-Mg alloy
after 20 hot rolling
passes……….286
9.3 EDS maps displaying (a) aluminum (b) magnesium, (c) carbon, (d) oxygen, (e)
chromium and (f) iron observed on the work roll after the 20 hot rolling pass
schedule against Al-Mg Alloy………...287
9.4 Cross-sectional secondary electron images displaying the roll coating (a)
loosely adhered to the work roll surface (b) fully adhered to the work roll surface
and (c) within the cavity created by a fractured carbide particle after 20 hot rolling
passes against an Al-Mg sample………...289
9.5 STEM micrographs displaying (a) the complex structure of the roll coating and
(b) fracture debris from the steel work roll embedded in the roll coating after 20
hot rolling passes against an Al-Mg alloy……….292
9.6 EDS line scans displaying the elemental composition of the roll coating formed
after 20 hot rolling passes against an Al-Mg alloy………293
9.7 EDS maps displaying elemental composition distribution of the roll coating
developed on the steel work roll after 20 passes against Al-Mg alloy…………..294
9.8 HRTEM micrographs displaying (a) the amorphous structure of the roll coating
and (b) the amorphous nanoparticles embedded in the roll coating after 20 hot
xxxv
9.9 Cross-sectional secondary electron images displaying (a) aluminium debris
embedded in polymerized carbon lying at edge of the roll coating (b) carbon-rich
layer of the roll coating sandwiched between wear debris after 20 hot rolling
passes against an Al-Mg alloy………...300
10.1 Cross-sectional FIB/SEM micrograph of tribolayer on AA5083 strip after
deformation at 545 °C at a strain rate of 4 x 10⁻² s-1 and a strain of 0.1…………310
10.2 Surface roughness vs. temperature plot for the AA5083 alloy with as-received
and polished surface conditions after deformation at 4 x 10⁻² s-1………..311
10.3 Average COF vs. temperature plot for AA5083 alloy with as-received and
polished surface conditions measured during tensile deformation at different
temperatures………..313
10.4 Secondary electron images of material transfer to P20 steel pin from the
as-received (with tribolayer) AA5083 aluminum alloy at (a) 350 oC (b) 450 oC (c) 545
oC………...………315
10.5 Secondary electron images of material transfer to P20 steel pin from the
polished AA5083 aluminum alloy at (a) 350 oC (b) 450 oC (c) 545 oC illustrating
the initial contact area (Ao)…………...……….315
10.6 Sliding track width vs. temperature plot displaying the change in the width of
the sliding induced wear track on the AA5083 strip with as-received and polished
xxxvi
10.7 Secondary electron images of the as-received AA5083 aluminum alloy strip
surface after deformation at (a) 350 oC (b) 450 oC (c) 545 oC. The direction of
applied tensile stress is horizontal to these images………...………319
10.8 Secondary electron images of AA5083 aluminum alloy fibres observed within
cracks in strip tribolayer after deformation at (a) 350 oC (b 450 oC and (c) 545 oC
displaying fibre bundles and individual fibres at high temperatures……….320
10.9 Secondary electron images of AA5083 aluminum alloy fibres observed within
cracks in AA5083 tribolayer after deformation at (a) 350 oC (b) 450 oC (c) 545 oC
showing changes in fibre surface morphologies from a smooth appearance to a
nodular surface morphology as the temperature increased………...…320
10.10 Secondary electron image of polished AA5083 aluminum alloy strip surface
after deformation at (a) 350 oC (b) 450 oC. (c) 545 oC………..322
10.11 Secondary electron image of fibres observed on polished AA5083 aluminum
alloy after deformation at (a) 350 oC (b) 450 oC (c) 545 oC………..323
10.12 AA5083 aluminum alloy deformed at (a) 350 oC (b) 450 oC (c) 545 oC
showing structure of oxide fibres at grain boundaries at higher magnification.
………...…323
10.13 High resolution secondary electron image of AA5083 aluminum alloy fibres
observed within cracks on strip covered with tribolayer after deformation at 350 oC
showing (a) fibre morphology with uniform elongation and some ruptured fibres,
xxxvii
deformed fibres with aspect ratios exceeding 11, also ruptured fibres can also be
seen………...……….325
10.14 High resolution secondary electron image of AA5083 aluminum alloy fibres
observed within cracks on a strip covered with tribolayer after deformation at 545
oC showing (a) fibres with ‘coarse’ morphology of surface protrusions (nodes), (b)
nodes on fibres that extended to large aspect ratios. The ‘brittle’ fracture may
indicate that the fibres that were deformed superplastically at this temperature were
fractured during or after cooling to room temperature………..325
10.15 High resolution secondary electron image at a 45 ° tilt of AA5083 aluminum
alloy fibres observed within cracks on strip covered with tribolayer after
deformation at 350 oC showing fibres occurring within porous tribolayer…...…326
10.16 TEM analysis of fibres formed at 545 oC illustrating (a) TEM image of fibre
lying on aluminum nano-grain (b) EDS map displaying the shell structure of the
fibre with blue indicating oxygen, red indicating magnesium and green indicating
aluminum (c) EDS linescan displaying element distribution across the fibre with
blue indicating oxygen, red indicating magnesium and green indicating aluminum
(d) HRTEM image showing MgO, MgAl2O4 and Al2O3 and (e) SAED of area
within box in (d)………...……….329
10.17 Secondary electron images of (a) oxide fibres located within the sliding track
induced on as-received AA5083 aluminum alloy at 545 °C and also shows the
xxxviii
magnification of boxed area in (a) which shows sliding debris lying on the oxide
fibres……….………335
11.1 Scanning electron images showing MgO islands and magnesium distribution
at grain boundaries on surface or (a) Al-Mn, and (b) Al-Mg alloys after a 4 pass
rolling schedule……….352
11.2 Schematic of the evolution of the near-surface deformed layer of an Al-Mn
alloy during hot rolling schedule after (a) 1 pass, (b) 4 passes, and (c) 10 passes.
………..………353
11.3 Cross-sectional secondary electron images of the (a) Al-Mn and (b) Al-Mg
alloys displaying the formation of aluminum debris from crack propagation at the
xxxix
NOMENCLATURE
µ COF
Ao Contact Area
G Torque
P Rolling force
R Radius of the work roll
Tm Melting Temperature
ACOM-TEM Automated crystallographic orientation mapping -
transmission electron microscope
ASL Altered Surface Layers
BSE Backscattered Electron
CGBS Cooperative Grain Boundary Sliding
COF Coefficient of Friction
DLC Diamond-like-carbon
EELS Electron Energy Loss Spectroscopy
EDS Energy Dispersive X-Ray Spectroscopy
EPMA Electron Probe Micro-Analyzer
ESEM Environmental Scanning Electron Microscope
FEM Field Emission Microscopy
FCC Face Centre Cubic
FFC Filiform Corrosion
xl
GBS Grain Boundary Sliding
HR-SEM High Resolution Scanning Electron Microscopy
HRTEM High Resolution Transmission Electron Microscopy
MML Mechanically Mixed Layers
NH-DLC Non-Hydrogenated Diamond-Like-Carbon
NSM Near-Surface Microstructure
PVD Physical Vapour Deposition
RD Rolling Direction
SAED Selected Area Electron Diffraction
SEM Scanning Electron Microscopy
SPD Severe Plastic Deformation
STEM Scanning Transmission Electron Microscopy
TEM Transmission Electron Microscopy
TR Total Reflectance
VSI Vertical Scanning Interferometry
1 CHAPTER 1
INTRODUCTION
1.1 GENERAL OVERVIEW
Aluminum alloys have continued to find wide-spread commercial application in
numerous industries as the wide range of available aluminum alloys and their vastly
varied mechanical properties allow these alloys to fulfil the lightweight and strength
requirements of manufacturers [1–5]. For example, aluminum alloys of the 1000 (Al),
3000 (Al-Mn), and 5000 (Al-Mg) series are widely used in the packaging industry, 6000
(Al-Mg-Si) series in construction, 5000 and 6000 series in the automotive, 2000 (Al-Cu)
and 7000 (Al-Zn) series in aerospace, and the 5000 series in marine industries [1–6]. In
fact, aluminum alloys are considered the most heavily used non-ferrous metals in the
world, substituting for steel sheets in the automotive and aerospace industries [7–9].
Aluminum alloys also offer excellent corrosion resistance, weldability, recycling
potential, high strength, high ductility, and good formability [9–11]. Due to their low
density, high strength to weight ratios, and low thermal expansion, aluminum alloys are
employed in areas where weight reduction is of critical concern [4,5,11,12]. The
increased interest of the automotive industry in aluminum alloys, not just as body parts
but extending their application to the engine block, has led to the increase in the demand
for high quality aluminum sheets [13].
The properties of aluminum alloys are not just influenced by their alloying
elements, but for wrought alloys the thermomechanical processing route is also of great
2
metallurgical properties and allow for the production of simple to complex product
shapes [8,14,15]. These processes take advantage of the lower flow stress, work
hardening, and springback, as well as the increased ductility, toughness, and formability
experienced by aluminum alloys at elevated temperatures [16–19]. Elevated temperature
forming processes, which include rolling, forming, stamping and extrusion, can be
classified into hot working, which are forming operations above 0.6 Tm, where Tm is the
melting temperature; and warm working, forming operations between 0.3 – 0.5 Tm
[8,20]. During forming processes, the forming tools are used to apply compressive
stresses on the aluminum blanks to produce sheets or the final product parts. These
processes, therefore critically influence the surface appearance of aluminum sheet
products [8]. The quality of processed aluminum surface is a crucial requirement for the
customers, and consequently for the aluminum industry as well [14,21]. In the aluminum
processing industry it is believed that the surface quality of the aluminum sheets are
determined during the initial processing step namely hot rolling [22].
The thermomechanical processing of aluminum begins with rolling, which is used
for the production of aluminum sheets, plates, bars, and strips, which are used in
subsequent forming processes for the fabrication of parts (Fig. 1.1) [8,10,23]. The rolling
stages of aluminum after casting include homogenization, hot rolling, and subsequent
cold rolling, which is preceded by annealing as shown in the rolling processing route
depicted in Figure 1.2 [24,25]. The hot rolling process is performed in stages: (i)
breakdown rolling, which occurs on the as-cast ingot and reduces it to slab thickness, and
(ii) tandem mill rolling, which reduces the slab to the final thickness [26]. During the heat
3
contact, the composition of the aluminum surface is constantly being altered [11,22]. This
is the result of the diffusion of alloying elements, and reactions between the alloy surface
with the surrounding atmosphere, including the absorption of components from the metal
working fluids and contaminants [11,22]. Oxide layers and scales are formed on the
aluminum surface during the various heat treatments. The thickness of these oxide layers
vary with the heat treatment time and temperatures [27,28]. The thickness of the oxide
layers is reduced during the rolling process and are noteworthy because they can induce
surface defects and roughening of the aluminum surface [27,28]. However, the thin
ubiquitous Al2O3 oxide film, which forms on aluminum alloys, even at room
temperatures, has been described as being a protective layer that improves the corrosion
resistance of the bulk alloy [3]. The roll surface is also known to be covered with oxide
layers, which influence the performance of the roll [28,29]. The fracture and deformation
of the oxide layer is known to be induced by the high contact pressures experienced
during the rolling contact of the oxide covered surfaces of the roll and aluminum stock
[27,30,31]. The rolling contact pressures are not constant, occurring for only a limited
time that depends on the forming operation, in rolling it is 0.01 seconds, but continues to
increase during the rolling process for that short time [20,27,32]. Damage and fracture to
the oxide layers on the aluminum alloy, which occur as cracks, is influenced by the oxide
layer thickness [27]. These spaces between the cracks in the oxide layer lead to the
exposure and extrusion of fresh metal of the aluminum bulk [10,27].
As the heated aluminum stock is much softer than the steel roll, the intimate
conformity of the roll and stock surfaces that occurs during hot rolling results in the
4
of aluminum transfer to the surface of forming tools is believed to be detrimental to the
forming process, but in the case of aluminum rolling, it is believed to improve the biting
characteristics required to draw the aluminum stock into the roll bite [8,27,30]. However,
the effectiveness of the roll coating is influenced by its thickness as excessive aluminum
transfer is still undesired and is removed from the work roll with nylon bristle brushes
[30]. The thickness of the roll coating is influenced by lubrication. Typically lubrication
is applied in all forming processes to control material transfer by limiting direct contact
between the tool and the workpiece, control the temperature of the tools, and minimize
friction and wear in the roll bite [10,28,30,35,36]. Lubrication for elevated temperature
forming process vary from solid lubricants, like graphite and boron nitride (BN) used in
hot forming, to emulsions used in rolling [37,38]. When used in elevated temperatures
rolling operations, emulsions offer lubrication and act as coolants, fire retardants, and
corrosion inhibitors [39–42].
Rolling lubricants are oil-in-water emulsions composed of mineral oil, water,
oiliness agents, and emulsifier [10,22,41,42]. The working mechanism involved in these
oil-in-water emulsion lubricants have been described as exceedingly complex [38]. For
instance, during hot rolling, only oil is introduced into the roll bite, while water, which is
used for cooling, evaporates to form steam pockets. Thus, the performance of the
lubricant is dependent on both the oil composition and the properties of the emulsion
[30,40,41]. Any changes to the base oil, additive type or content would alter emulsion
properties, like surface wetting, lubrication, and emulsification [36,43]. The oil drawn
into the roll bite coats and is then absorbed on both the roll and aluminum stock surfaces
5
dispersed oil droplets and the contacting surfaces [10,13,27,39,40]. The spread of the oil
on the roll and the aluminum stock in the inlet zone seen in Figure 1.3 is called
“plate-out” [40]. The oil drawn into the roll bite between the roll and stock surfaces is under
pressure, which is controlled by the plasticity of the aluminum stock. The stock begins to
deform once the pressure in the oil exceeds the yield pressure of the aluminum alloy
[10,40,44,45]. The thickness of the oil film and surface roughness (roughness height and
distribution) determine the lubrication regime of the forming process [13,28,38,45,46].
Three lubrication regimes have been identified: boundary lubrication, mixed lubrication
and hydrodynamic lubrication regime [45]. Rolling occurs in the mixed lubrication
regime, close to the boundary regime, where there is some asperity contact between the
tool and the stock surface for the production of bright rolled surfaces [27,45,47]. The
mixed lubrication regime offers a compromise of reasonable friction levels and good
surface finish as friction is too high within the boundary lubrication regime [27,47].
The surface roughness of both roll and stock surfaces influence the lubricant
capture and delivery within the contact zone [48]. Examination of the used rolling
lubricants have revealed that they contain metal oxide and debris from the aluminum
stock [27,28]. This is due to the chemical interaction between aluminum surface with the
lubricant and its additives to form complex soaps during rolling [2,27,30,33]. As a result
of its distinct influence in the aluminum rolling process and its reaction with aluminum
surface, the rolling lubricant is considered to have a critical influence on the surface
quality of the rolled aluminum surface [10,22,36,41,49]. Damage to the work roll is also
observed during rolling due to adhesion, abrasion, oxidation, and thermomechanical
6
[28,30,31,50,51]. The lubricant is also employed to protect the work roll from this
damage [39]. Rolls are centrifugally cast and possess a microstructure that includes a
tempered martensitic matrix along with a network of hard primary carbides that influence
the wear resistance of the roll and the lubricant distribution [51]. Because of the intimate
conformity of the roll with the hot aluminum stock, any damage to the roll surface profile
is continually printed on the continuous virgin aluminum surfaces produced during the
rolling process [21,30].
The main parameters that influence rolling are summarized as the roll diameter,
the deformation resistance of the rolled metal, and the friction between the rolls, which is
required to draw in the rolled metal [23,32,52]. Friction and roll pressure are two of the
compressive forces involved in rolling [23]. Rolling load is also known as the separating
force as it equals the force exerted on the rolls by the metal trying to force the rolls apart.
The rolling load is related to the diameter of the rolls, which induces greater deformation
when it is increased and influence the material transfer [23,53,54]. The contact length is
described as the portion of the roll and rolled metal in contact at any time during rolling,
while the angle of contact, also known as the roll bite, is the angle between the entrance
plane and centre of the rolls, which is also related to the diameter of the rolls [23,53]. The
aspect ratio is the relationship between the projected length of contact and the mean
thickness of the rolled metal and influences friction during rolling. The forward slip is the
relationship between the speed of the roll and stock during rolling. It is related to the
friction during rolling and is often used in its calculation [23,53–56].
The aluminum rolling process can be thus be described as a complex tribological
7
covering the contacting surfaces (Fig. 1.4) [21,57]. The tribological conditions at the
interface of the roll, or any forming tool and the aluminum alloy, are vital for the success
of the forming operation [28,30]. This is especially true at elevated temperatures, where
aluminum alloys can display superplastic behaviour at low strain rates but where surface
quality can be reduced due to wear and enhanced plastic deformation [15,17,19,21]. The
understanding and control of the tribological conditions and interactions between the
aluminum alloy, lubricant, and forming tool are required to take full advantage of
aluminum alloys and their elevated temperature forming processes [4,58].
Figure 1.1 Typical processing steps involved in the thermomechanical processing of aluminum alloys [59]
8
Figure 1.3 Inlet zone of rolling region displaying on film of aluminum stock and roll [40]
![Figure 1.4 The strip rolling process and a realistic toolpiece/workpiece interface [57]](https://thumb-us.123doks.com/thumbv2/123dok_us/1371723.1169899/49.612.142.479.69.287/figure-strip-rolling-process-realistic-toolpiece-workpiece-interface.webp)
![Figure 1.12 Schematic diagrams showing the microstructure of near-surface deformed layer introduced by rolling: (a) type A and (b) type B [68]](https://thumb-us.123doks.com/thumbv2/123dok_us/1371723.1169899/80.612.118.578.71.292/figure-schematic-diagrams-showing-microstructure-surface-deformed-introduced.webp)