A STUDY ON PERFORMANCE ASSESSMENT OF MUTUALFUND WITH RELIANCE MUTUAL FUND
SCHEMES IN INDIA
Hajee. CMA. Dr. M. Sheik Mohamed, Professor & Principal (Rtd.,) Jamal Mohamed College, Tiruchirappalli
Mr. M. Kaja Muhaideen, PhD – Research Scholar & Assist Professor, Department of Business Administration, Jamal Mohamed College, Tiruchirappalli
ABSTRACT
In this paper the researcher tried to evaluate the performance of Reliance open-ended equity
schemes with growth option. The period of the study spans from 1st April 2008 to 31st March 2017.To
evaluate the performance of the selected mutual fund schemes, monthly returns are compared with
Benchmark BSE National 100 and SENSEX returns.
Keywords: Equity Schemes; Performance Assessment, Reliance Mutual Fund and Other Mutual Fund Schemes, BSE 100.
INTRODUCTION:
REVIEW OF LITEARTURE:
Despite the existing of a mutual fund industry for over four and half decades in India, there have been only a few studies, which examined the performance of Indian mutual fund using standard methodology a brief review of this studies is now presented below:
Kumar Vikas [2010] evaluated the performance of 20 mutual funds schemes managed by five mutual
funds using monthly NAV for period between 1st Jan 2000 to 31 st Dec 2009 for 10 year i.e. 120 months. The rate of return was compared with the BSE National 100 index over the period. The performance was evaluated in the term of rate of return, total risk (i.e. S.D.), systematic risk (i.e. Beta), coefficient of determination and risk adjusted performance suggested by Sharpe (1966), Treynor (1965) and Jensen (1968). The outcome shows that out of 20 schemes selected equity schemes shows better return as compared to debt and balanced schemes.
Singh and Singh [2005] have highlighted the fact that mutual funds have not attained equal status as
their counterparts in USA, UK and other developed countries. It has emphasized on the gradual but slow growth of mutual funds in India giving an exclusive attention to the UTI as it was through to be the pioneers in this field. The private, money market funds, offshore mutual funds has been critically analyzed.
G. Sethu [2001] used weekly NAV data for 18 open-ended growth schemes in India for the period April
1995-July 1999. His study used three alternatives indices for equity market viz. NSE Nifty, BSE Sensitive Index and S&P CNX 500. The 91-day treasury auction rate was used as the risk free rate. He concluded that the fund portfolios are not adequately diversified; the excess returns after adjusting for systematic risk is zero and the portfolios do not show any market timing.
Gupta[2000]study was conducted with the primary objective to evaluate the performance of selected
mutual funds schemes and to apply test for analyzing timing abilities of the mutual funds managers during the period April 1, 1994 to march 31, 1999 it also examines the growth and development of the mutual fund industry in India during the period 1987 to September 1999. However, No conclusive evidence was available which could warrant the study to accept its performance as superior.
Mishra [1999] evaluated performance over a period, April 1992 to December 1996. The sample size was
SIGNIFICANCE OF THE STUDY:
The need for evaluating the performance of mutual fund schemes in India is to see whether the mutual fund schemes are outperforming or underperforming than the benchmark and to see the competency of schemes to make out a strong case for investment. The present paper investigates the performance of open-ended, growth-oriented equity schemes. Open-ended mutual fund schemes are those which don’t have a fixed maturity, not listed in the stock exchange and these schemes offer new unit for sale and ready to buy any time. The success of any scheme depends upon the competence of the management and its soundness. Evaluating historical performance of mutual funds is important both for investors as well as portfolio managers. It enables an investor to access as to how much return has been generated by the portfolio manager and what risk level has been assumed in generating such returns. The various constituents of the society have been deprived of the detailed knowledge about the mutual fund’s operations, management, regulations, growth and performance, relations with capital market and risk and return involved. This study is expected to fill this gap. The present research work is supposed to be useful especially to present and potential investors, managers of mutual funds, agents of mutual funds, academicians, present and future research scholars and also government and regulated bodies. This study will guide the investors in planning and effecting their investments in mutual funds. It will also act as a guide for beginning investors.
OBJECTIVES OF THE STUDY
1. To Evaluate the Performance of sample schemes.
2. To compare schemes return and risk with benchmark i.e. BSE 100. To compare schemes return and risk with benchmark i.e. SENSEX.
RESEARCH METHODOLOGY:
Benchmark Index- For this study, broad-100 shared base BSE National Index and SENSEX has been used
as a proxy for market index. Hence it would cover the majority percentage of different scheme portfolios and therefore is expected to provide better performance benchmark.
Risk Free Rate- Risk free rate of return refers to that minimum return on investment that has no risk of
losing the investment over which it is earned. For the present study, it has been taken as Public Provident Fund (PPF) on the average rate from 2006 to 2015 marked as 8.0111% per annum or 0.006676 per month.
Monthly Net Asset Value (NAV) has declared by the relevant mutual funds from the 1st April. 2008 to 31st March 2017 has been used for the purpose.
Data- Study examines six open-ended equity schemes with growth option being launched by Reliance
Mutual Funds. These schemes have been selected on the basis of regular data availability during the period of 1st April 2008 to 31st March 2017. Monthly Net Asset Value (NAV) data has been used and the period.
ANALYSIS AND INTERPRETATION:
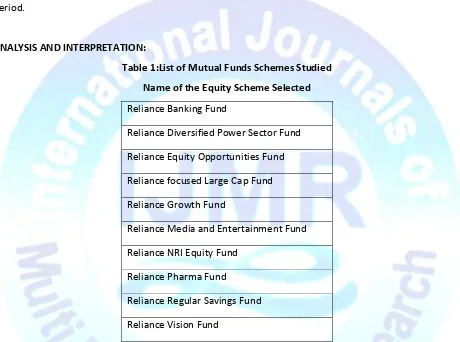
Table 1:List of Mutual Funds Schemes Studied
Name of the Equity Scheme Selected
Reliance Banking Fund
Reliance Diversified Power Sector Fund Reliance Equity Opportunities Fund Reliance focused Large Cap Fund Reliance Growth Fund
Reliance Media and Entertainment Fund Reliance NRI Equity Fund
Reliance Pharma Fund
Reliance Regular Savings Fund Reliance Vision Fund
Different scheme launch in different dates therefore, for the purpose performance assessment the period covers 1st April, 2008 to 31st March, 2017.
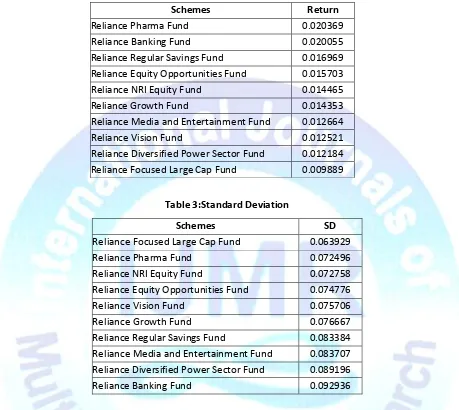
Table 2 shows the average return earned by the various schemes. For calculation of average return
Table 2:Average Monthly Return Earned By the Schemes
Schemes Return
Reliance Pharma Fund 0.020369
Reliance Banking Fund 0.020055
Reliance Regular Savings Fund 0.016969 Reliance Equity Opportunities Fund 0.015703
Reliance NRI Equity Fund 0.014465
Reliance Growth Fund 0.014353
Reliance Media and Entertainment Fund 0.012664
Reliance Vision Fund 0.012521
Reliance Diversified Power Sector Fund 0.012184 Reliance Focused Large Cap Fund 0.009889
Table 3:Standard Deviation
Schemes SD
Reliance Focused Large Cap Fund 0.063929
Reliance Pharma Fund 0.072496
Reliance NRI Equity Fund 0.072758
Reliance Equity Opportunities Fund 0.074776
Reliance Vision Fund 0.075706
Reliance Growth Fund 0.076667
Reliance Regular Savings Fund 0.083384 Reliance Media and Entertainment Fund 0.083707 Reliance Diversified Power Sector Fund 0.089196
Reliance Banking Fund 0.092936
Table 3 shows the standard deviation of selected schemes. It is the most common expression to
RISK - RETURN CLASSIFICATION OF SAMPLE SCHEMES:
In order to undertake further analysis, sample schemes have been classified into the following four categories on the basis of their return and risk characteristics:
1. Low Return and Low Risk: This category consists of schemes whose average returns are lessthan
the average market return and their standard deviations are also lower than that of the market.
2. High Return and Low Risk: This category comprises those schemes whose returns are morethat
the market but their standard deviations are lower than that of the market.
3. High Return and High Risk: This category includes all those schemes whose returns as wellas
standard deviations are higher than that of the market.
4. Low return and High Risk: The final category includes all those schemes whose returns
havebeen found to be lower than that of the market but their standards deviations are higher than that of the market.
5. Categorizations of Schemes: Table 4 presents the risk return grid of Mutual Funds schemes
fromBSE100. After classification of the sample schemes in to risk return category 1 scheme fall in category 1st i.e. Low Return Low Risk. Further 3 schemes fall in 2nd category i.e. High return and low risk. These 5 schemes fulfill one basic objective of Mutual Fund i.e. High Return and Low Risk compared to the capital market. Only 6 schemes fall in 3rd category i.e. High Return and High Risk and no schemes falls in 4th category i.e. Low Return and High Risk. After classification of the sample schemes in to risk return category 1 scheme fall in category 1st i.e. Low Return Low Risk. Further no schemes fall in 2nd category i.e. High return and low risk. Rest all schemes fall in 3rd category i.e. High Return and High Risk and no schemes falls in 4th category i.e. Low Return and High Risk.
Table 4:Average Ranking Of Selected Mutual Funds Schemes According To Different Measures
Schemes Average rank
Reliance Pharma Fund 1
Reliance Banking Fund 2
Reliance Regular Savings Fund 3
Reliance Equity Opportunities Fund 4
Reliance NRI Equity Fund 5
Reliance Growth Fund 6
Reliance Media and Entertainment Fund 7
Reliance Vision Fund 8
Reliance Diversified Power Sector Fund 9
CONCLUSION:
Out of the total schemes studied, all schemes showed an average return higher than in comparison to the market return i.e. BSE 100 and SENSEX except one i.e. Reliance Focused Large Cap Fund. Mutual funds are supposed to protect small investors against vagaries of stock market and the fund managers of these schemes have done well to protect them, based on both benchmarks Reliance Pharma Fund, Reliance NRI Equity Fund, Reliance Focused Large Cap Fund and Reliance Equity Opportunities Fund in BSE 100 and Reliance Focused Large Cap Fund in Sensex has performed better than the other schemes in comparison of risk and return which Indicates that investors who invested in these schemes to form well diversified portfolio did receive adequate return per unit of total risk & systematic risk undertaking.
LIMITATIONS OF THE STUDY:
For the purpose of performance assessment, those schemes have been selected which are in operation since last 9 years i.e. 1st April 2008 to 31st March 2017. Only open ended equity schemes have been considered for this purpose. The schemes having only growth options are being taken into consideration. The series schemes and the plan schemes were not taken as a part of sample as it lacks uniformity. Performance assessment of all schemes was not possible due to unavailability of data.
SCOPE FOR FURTHER RESEARCH:
REFERENCES:
Gupta, Amitabh. Mutual Funds in India - A study of Investment Management, Anmol Publication Pvt. Ltd. New Delhi. 2002.
Gupta, O.P. and Sehagal S. (2000), “Investment Performance of Mutual Funds: The Indian Experience”, In Indian Capital Markets: Trends and Dimensions edited by UMA Shashikant and Arumugam, Tata McGraw Hill, New Delhi.
India.
Jayadev M. (1996)’ “Mutual Fund Performance; an Analysis of Monthly Returns”, Finance India, Vol. X, No.1, (March), Page No.73-84
Jayadev M. (1998), “Performance Evaluation of Portfolio Managers: An Empirical Evidence on Indian Mutual Funds”, Applied Finance Vol.5, No.2, July.
Kumar, Vikas, Mutual Funds in India: Growth and Performance. ERT Publication, Pvt.Ltd. Varanasi, 2012.
Mishra B, (2001), “A study of Mutual Funds in India”, UN published Research paper under the aegis of Faculty of Management Studies, University of Delhi.
Rao K.V. and Venkateshwarlu, K. (1998), “ Market Timing Abilities of Fund Managers-A case Study of Unit Trust of India”, A paper presented at the Second Capital Market Conference Organised by UTI Institute Capital Market, Mumbai.
Sadhak H, (1997) “Mutual Fund Investment and Market Practices in India”, Sage Publication
Sethu, G. (2001),”The Mutual Fund Puzzle” in Indian Capital Markets: Modern perspective and Empirical Evidence, Allied Publishers Mumbai.
Singh, H.K. and Singh, Meera, ‘Mutual funds and Indian capital market, performance and profitability’.
WEBSITES:
www.amfi.com
www.bseindia.com
www.investopedia.com
www.moneycontrol.com
www.reliance mf.com