Scholarship@Western
Scholarship@Western
Electronic Thesis and Dissertation Repository
8-20-2018 1:00 PM
Third- and Fourth-Graders’ Perspectives on Social Exclusion: A
Third- and Fourth-Graders’ Perspectives on Social Exclusion: A
Group Concept Mapping Study
Group Concept Mapping Study
Tsz-Wing Zita Lau
The University of Western Ontario Supervisor
Nowicki, Elizabeth A.
The University of Western Ontario Graduate Program in Education
A thesis submitted in partial fulfillment of the requirements for the degree in Master of Arts © Tsz-Wing Zita Lau 2018
Follow this and additional works at: https://ir.lib.uwo.ca/etd Part of the Educational Psychology Commons
Recommended Citation Recommended Citation
Lau, Tsz-Wing Zita, "Third- and Fourth-Graders’ Perspectives on Social Exclusion: A Group Concept Mapping Study" (2018). Electronic Thesis and Dissertation Repository. 5539.
https://ir.lib.uwo.ca/etd/5539
This Dissertation/Thesis is brought to you for free and open access by Scholarship@Western. It has been accepted for inclusion in Electronic Thesis and Dissertation Repository by an authorized administrator of
i
The focus of the present study was to examine third- and fourth-graders’ thoughts on social exclusion of peers with learning difficulties; participants’ responses were expected to corroborate Aboud’s (1988, 2008) social-cognitive developmental theory of prejudice. Moreover, Trochim’s (1989) Group Concept Mapping method was applied to engage the children in the data collection and analysis processes. The second goal of this study was to observe the participants’ capabilities in completing the research tasks. Findings revealed four themes in children’s responses: (a) differences between children, (b) challenges experienced by children with learning difficulties, (c) others’ negative attitudes, and (d) traits leading to disapproval from others. The partial corroboration of Aboud’s theory suggested that third- and fourth-graders are developing cognitive flexibility to become less prejudiced. Hence, this may be an ideal period to introduce educational interventions about learning difficulties and social exclusion. Furthermore, the participants were capable of providing meaningful responses but would benefit from individual and step-by-step guidance during the research tasks.
Keywords
ii
Acknowledgments
I would like to thank my supervisor, Dr. Elizabeth Nowicki, for her words of confidence before my data collection, the selfless time she spent on revising my thesis, and her continued guidance throughout my master’s studies.
I would also like to thank my committee member, Dr. Jason Brown, for his important input and insights into this thesis.
Special thanks to Lynn Dare, who offered invaluable help during the initial stage of my statistical analysis.
iii
Table of Contents
Abstract ... i
Acknowledgments ... ii
Table of Contents ... iii
List of Tables ... vi
List of Figures ... vii
List of Appendices ... viii
Chapter 1 ... 1
1 Introduction ... 1
1.1 Terminology ... 2
1.2 Peer Acceptance and Consequences of Social Exclusion in Classrooms ... 2
1.3 Why Are Students with Learning Difficulties Socially Excluded? ... 4
1.4 Age-Related Changes in Prejudice ... 5
1.4.1 Social-Cognitive Developmental Theory ... 5
1.5 Group Concept Mapping ... 7
1.5.1 Application of Group Concept Mapping with Elementary School-Aged Children ... 8
1.5.2 Cognitive Abilities of School-Age Children ... 9
1.6 Purpose of the Present Study ... 11
Chapter 2 ... 13
2 Method ... 13
2.1 Participants ... 13
2.2 Procedure ... 14
2.2.1 Preparation (The Interview Phase) ... 14
iv
2.2.3 Sorting of Statements (The Sorting Phase) ... 18
Chapter 3 ... 19
3 Results ... 19
3.1 Group Concept Mapping Analysis ... 19
3.1.1 Multidimensional Scaling ... 19
3.1.2 Hierarchical Cluster Analysis ... 21
3.2 Researcher’s Observations and Participants’ Feedback ... 26
3.2.1 Understanding of Learning Difficulties ... 27
3.2.2 Understanding of the Focal Interview Question ... 28
3.2.3 Understanding of Sorting Instructions ... 28
3.2.4 A Difficult Statement to Sort ... 29
3.2.5 Feedback on Difficulty Level of Sorting Task ... 29
3.3 Summary ... 29
Chapter 4 ... 31
4 Discussion ... 31
4.1 Participants’ Thoughts on Social Exclusion ... 31
4.1.1 Cluster 1: Differences Between Children ... 32
4.1.2 Cluster 2: Challenges Experienced by Children with Learning Difficulties ... 32
4.1.3 Cluster 3: Others’ Negative Attitudes ... 33
4.1.4 Cluster 4: Traits Leading to Disapproval from Others ... 33
4.1.5 Application of Aboud’s Theory ... 34
4.2 Participants’ Competence in Group Concept Mapping ... 34
4.2.1 Competencies ... 35
4.2.2 The Need for Additional Guidance ... 35
v
4.3 Implications ... 37
4.4 Limitations and Future Directions ... 39
4.5 Conclusion ... 40
References ... 41
Appendices ... 51
vi
List of Tables
vii
List of Figures
Figure 1: Multidimensional Scaling Point Map of the 33 Generated Statements ... 20
viii
List of Appendices
Appendix A: Letter of Information for Parents ... 51
Appendix B: Letter of Information for Students ... 52
Appendix C: Consent Form ... 53
Appendix D: Verbal Consent Script ... 54
Appendix E: Interview Questions ... 55
Appendix F: Sorting Instructions ... 56
Appendix G: Sorting Instructions – Picture Demonstration ... 57
Chapter 1
1
Introduction
Under the influence of the Charter of Rights and Freedoms, the initiation for equality and inclusive education in Canada dates back as early as the 1980s (Peters, 2004; Porter, 2008). Internationally, inclusive schools became an increasingly supported reality since receiving endorsement at the Salamanca World Conference on Special Needs Education in 1994. According to the Salamanca Statement and Framework for Action, inclusive education refers to educational settings where all children, regardless of their abilities or differences, learn together (United Nations Educational, Scientific and Cultural
Organization [UNESCO], 1994). A fundamental principle of inclusive education is to ensure all students have access to quality education, which includes the academic and social aspects of schooling. Quality education enables children to thrive as active learners and fosters their sense of citizenship to build a just society (UNESCO, 2017).
Unfortunately, even decades after the implementation of inclusive education, children with disabilities – meaning children with long-term physical, mental, intellectual, and/or sensory impairments – continue to struggle with acceptance in regular classrooms (United Nations, 2006; United Nations Children's Fund [UNICEF], 2013). Research showed that children with disabilities are less accepted by their peers compared to students without disabilities (Chamberlain, Kasari, & Rotheram-Fuller, 2007; Edwards, 2013; Estell et al., 2008; Pijl, Frostad, & Flem, 2008; Schwab, Huber, & Gebhardt, 2016; Symes & Humphrey, 2010; Wendelborg & Kvello, 2010; Yu, Zhang, & Yan, 2005) and may thus experience the negative consequences of social exclusion (Bossaert, Colpin, Pijl, & Petry, 2012; Pijl & Frostad, 2010; Schwab, 2015; Schwab, Gebhardt, & Gasteiger-Klicpera, 2013), despite the inclusive education system of today. This
discrepancy in social acceptance leads to the following question: Why do some children with disabilities experience social exclusion in school?
underexplored in the literature. In particular, participants’ responses were expected to corroborate Aboud’s (1988, 2008) social-cognitive developmental theory of prejudice. The Group Concept Mapping (Trochim, 1989; Kane & Trochim, 2007) methodology was applied, where the investigator acts as a facilitator to engage the participants in the data collection and analysis processes. Since Group Concept Mapping has rarely been used in studies with elementary school-aged children (Nowicki & Brown, 2013), this study also served as an extension of Nowicki, Brown, and Stepien’s (2014) study to observe the participants’ experience and capabilities in accomplishing the research tasks.
1.1
Terminology
The usage and definition of learning difficulties and learning disabilities vary nationally and internationally. In Canada, the terminology differs across provincial or territorial ministries of education – learning difficulties can also be referred to as learning disabilities, learning differences, learning disorders or at risk (Learning Disabilities Association of Canada, 2005). In the present study, learning difficulties was used because it is a broader term that can represent all students who experience difficulties with their learning (Hardie & Tilly, 2012; National Disability Coordination Officer Program, 2013), and reflects the everyday language that children use and understand (Nowicki et al., 2014). The original terminologies from the peer-reviewed studies are used in the following literature review to retain the authors’ meaning.
1.2
Peer Acceptance and Consequences of Social
Exclusion in Classrooms
elementary school-aged children (i.e., Bruininks, 1978; Garrett & Crump, 1980; Gresham & Reschly, 1986; Stone & La Greca, 1990; see Ochoa & Olivarez, 1995, for
meta-analysis), and even with children who had been in kindergarten for just eight weeks (Vaughn, Hogan, Kouzekanani, & Shapiro, 1990).
With the maturation of inclusive education implementation, and the high interest in investigating and overcoming social exclusion of children with learning difficulties, it might be expected that peer acceptance would become more prevalent in recent years. Yet researchers continued to present similar results as Bryan (1974, 1976) across different age groups in various countries (i.e., Estell et al., 2008; Ferreira, Aguiar, Correia, Fialho, & Pimentel, 2017; Wendelborg & Kvello, 2010; Yu et al., 2005). Other studies found that children with disabilities were less popular and have fewer friends than their peers without disabilities (Avramidis, 2010; Ferreira et al., 2017). Specifically, Pijl, Frostad, and Flem (2008) surveyed about 500 fourth-graders in inclusive education settings and revealed that almost 50% of the students with special needs have only one or no friends. These findings are concerning as they suggest that students with learning difficulties are potentially facing more challenges socially than their peers without learning difficulties in inclusive classrooms.
Therefore, students with learning difficulties – who are exposed to higher levels of social exclusion than their peers without learning difficulties – may also be at a higher risk of experiencing compromised long-term educational and personal development.
To ensure the major goal of inclusive education – that all children receive an equitable education experience (UNESCO, 2017) – is achieved, it is important to examine why students with learning difficulties continue to be socially excluded in classrooms.
1.3
Why Are Students with Learning Difficulties Social
ly
Excluded?
One theory that explains social exclusion is Tajfel’s (1978) Social Identity Theory. According to this theory, people form cognitive groupings based on distinguishing features; they subsequently magnify positive qualities of their in-group and amplify negative qualities of the out-group. These behaviours may serve to bolster an individual’s self-identity and group identification but, at the same time, also exaggerate perceived differences between groups and the categorization of people (Islam, 2014). The
consequent results are societal phenomena such as negative evaluations of the out-group (Holtz, 1989; Rosenbaum & Holtz, 1985) and stereotypes (Allport, 1979). The prejudicial attitudes and stereotypical beliefs that individuals hold against the out-group can
perpetuate their justification for social exclusion (Killen & Rutland, 2011).
Nowicki (2012) explored the correlations of age, group norms, group identification, and intergroup evaluations by applying Social Identity Theory (Tajfel, 1978) in a study focusing on children with and without learning difficulties. One of her findings was that children who identified strongly with their in-group (students without learning
difficulties) were inclined to believe that an out-group member (a student with learning difficulties) would be rejected by the in-group. This demonstrated that when children are identified as having learning difficulties, they are recognized by their peers as “outsiders” – which leads to the peer rejection and social exclusion of children with learning
1.4
Age
-
Related Changes in Prejudice
The low peer acceptance for children with learning difficulties is evident across ages – but when do children start developing prejudicial beliefs about others that consequently lead to social exclusion? In a study that examined the in-group and out-group attitudes of children between ages four and seven years, Aboud (2003) found that in-group
favouritism began to develop quickly and strongly at five years of age. It implies that children as young as preschool age can classify peers who are “different” from them, exaggerating dissimilarities between the in-group and the out-group. This leads to social discrimination as suggested by Social Identity Theory (Tajfel, 1978). In alignment with the findings of Vaughn et al.’s (1990) study, peer rejection of children with learning disabilities was recorded in kindergarten. Therefore, the ability to hold stereotypes and exclude peers in the out-group can happen at a very young age.
However, children’s cognitive abilities are under rapid development so their knowledge, attitude, and evaluation change as a function of age. Nowicki (2005) found that age was positively correlated with knowledge about disabilities as well as several components of an attitude scale, including cognitive (knowledge about an attitude object, i.e., people with disabilities), affective (emotions elicited by the attitude object), and behavioural (intention to act towards an attitude object). This means as children age and mature cognitively, they may gain a better understanding of the ontology of disabilities and shift to possess more positive attitudes and intentions towards their peers with disabilities. Likewise, in studies examining children’s racial prejudice, Aboud (1988, 2008; Aboud & Amato, 2001; Doyle & Aboud, 1995) suggested that children become cognitively capable of thinking about multiple dimensions of a person (people are not all good or all bad, but could be some good and some bad), moderating and reducing biases through increased positive evaluations of out-group and negative evaluations of in-group, and become less prejudiced after seven years of age.
1.4.1
Social-Cognitive Developmental Theory
overlapping sequences. The first sequence, the self-group-individual focus, discusses how children’s focus of attention and information processing is mediated by age. Under four years of age, children are egocentric and have an emphasis on self, meaning they perceive others on the basis of how that person relates to themselves. Their judgments are not strongly influenced by others; in fact, they assume that others have the same perception or experience the same emotions as they do in a given situation. By the age of five years, children have broadened their focus of attention to include groups, perceiving people in terms of groups or categories to which they belong (Aboud, 2003). They initially
exaggerate the contrasts between in-group and out-groups to clarify their comprehension of the groups, which heighten their prejudicial attitudes and prevent them from
understanding the out-groups. They later begin to make in-group comparisons and become aware of similarities between their in-group and the out-groups – this cognitive flexibility reduces their prejudice and prepares them for the shift to a focus on
individuals. When children are in the third stage of information processing, they focus on individual attributes and minimize group category information when making judgments. This is observed in some children at the age of seven years, but more prominently in children after eight years of age (Doyle & Aboud, 1995; Katz, Sohn, & Zalk, 1975). Moreover, children who have an individual focus are expected to show less prejudice as they become capable of role-taking and reconcile different perspectives.
Aboud, 1988, p.121) in people. Children are also able to simultaneously consider inconsistent information at this stage. This includes accepting ideas that are inconsistent with their self-concept, such a statement that is negative but true about themselves (Verkuyten & De Wolf, 2007; Swann, Griffin, Predmore, & Gaines, 1987), and using multiple attributes to classify people, including information that contradicts their stereotypical values (Aboud, 2003; Bigler & Liben, 1993). This cognitive development serves to reduce prejudice in children by neutralizing their initially bipolar and intense preferences and continues to develop for at least three to four years. Aboud (2008) further clarifies that children have functioning affective, perceptual, and cognitive processes at all ages. This sequence attends to a developmental shift in the processes that dominate children’s judgment, which may be able to explain their changes in prejudice as a function of age.
In addition, Aboud (2008) mentions that the two sequences are expected to run parallel to each other, but one sequence may develop faster than the other depending on the
individuals. For instance, participants’ ideas in the current study are expected to exhibit an individual focus with cognitive processes; yet it is also possible for their responses to focus on individual attributes while still displaying perceptual processes. Therefore, the third- and fourth-graders’ responses may present concepts from the earlier stages of the two sequences, namely self or group focus, and affective or perceptual processes.
1.5
Group Concept Mapping
of the concept map. Finally, the researcher draws educational implication from the results in the sixth step.
This method is founded on a collaborative approach, which allows multiple participants to represent their perspectives on any topic collectively, in an organized fashion with the researchers’ facilitation (Kane & Trochim, 2007; Trochim & McLinden, 2017). It not only asks participants to contribute their original insights on the topic through interviews but also engages them in the sorting stage of the collected ideas. This approach thus provides the participants with autonomy during the research process.
1.5.1
Application of Group Concept Mapping with Elementary
School-Aged Children
Previous Group Concept Mapping studies were conducted mostly with adults and high school students (i.e., Burgos, Al-Adeimi, & Brown, 2017; Dare & Nowicki, 2015; Trochim, 1993). The youngest group of children who participated in a Group Concept Mapping study included 49 fifth- and sixth-graders attending inclusive classrooms
(Nowicki et al., 2014). Students were asked, “Why are kids who have learning difficulties sometimes left out of things at school?” and to later participate in sorting statements from their interview responses.
competent and reliable participants for the Group Concept Mapping study, although the results cannot be generalized to other age groups. Specifically, Nowicki et al. (2014) suggested that younger children may have different ideas about social exclusion of peers with learning disabilities. They also raised concerns about younger students’ ability to contribute a sufficient number of ideas during the interview stage and their competence to complete the sorting task. Another limitation was that the participants demonstrated a general understanding of learning disabilities but it was unclear how the phrase “children who find learning difficult” was defined – whether students were aware of differences among categories of learning disabilities, or if children also considered peers with poor social skills as “children with learning difficulties.” The application of Group Concept Mapping with elementary school-aged children thus requires further examination.
1.5.2
Cognitive Abilities of School-Age Children
The participants in this study were children in Grades 3 and 4, meaning they constituted the youngest sample of all the Group Concept Mapping projects in the literature;
therefore it is important to explore their competence in completing the research tasks. Specifically, Group Concept Mapping relies heavily on the participants’ capabilities to engage in conversational interviews and to perform the sorting task, which are dependent on several aspects of the children’s cognitive abilities.
Previous research indicated that children have the cognitive and linguistics skills to be interviewed by six years of age (Docherty & Sandelowski, 1999; Gibson, 2012), such that they can provide consistent answers to “why, when, or how” questions (Steward, Bussey, Goodman, & Saywitz, 1993), and typically possess a vocabulary size of 9000 to 14,000 words that expands to the comprehension of 40,000 words by 10 years of age (Anglin, 1993; Carey, 1978). Some scholars also suggested that children’s comprehension of complex words is more advanced than their ability to produce the vocabularies (Anglin, 1993; Benedict, 1979; Clark & Hecht, 1982). From six years of age to adolescence, individuals also display increasing competence in focusing their attention, the back-and-forth flow of conversations, generating clear verbal messages, detecting and clarifying ambiguities, logical inferences, reliable storage and retrieval of information, and
Willoughby, 2013; Vasta, Haith, & Miller, 1999). In general, children are capable
interviewees by the age of six years; but the younger the children, the smaller vocabulary size they have, the shorter the sentences they comprehend and use, and the more they depend on familiar contextual cues to recall and share relevant experiences during interviews (Anglin, 1993; Steward et al., 1993).
In addition to the mentioned language and cognitive abilities, the Group Concept Mapping sorting tasks further involve children’s working memory to remember the sorting instructions, and to temporarily retain and process sentences. An individual’s information-processing capacities are always limited – only an absolute amount of information can fit in one’s working memory (Vasta et al., 1999). Children's
developmental improvement in completing cognitively-demanding tasks is more likely to be the result of increased familiarity with memory strategies, which allows the
appropriate application of efficient techniques to overcome information-processing limitations (Coyle & Bjorklund, 1997; Siegler, 1991; Vasta et al., 1999). In particular, Bjorklund and colleagues (Bjorklund, Coyle, & Gaultney, 1992; Schwenck, Bjorklund, & Schneider, 2007) showed that children in Grade 3 may still experience utilization
deficiency: they have the capacity to produce the memory strategy, but not additional resources for storage and retrieval of the list items. Therefore, the younger the children, the fewer and less effectively the cognitive and memory strategies are used, and the more they may struggle with executing instructions of a complex task.
Finally, children’s organization techniques are needed to conceptually categorize the statements in Group Concept Mapping. In studies examining the developmental shift in organizing a list of pictured objects, most children in third- and fourth-grades (aged 9 to 10 years) opted to group items according to conceptual categories (i.e., animals,
age comparisons typically demonstrated that children’s performance in categorization remains unstable until 11 to 12 years of age (Flavell, 1970; Moely, 1977). To sum it up, children from the age of nine years are likely to be competent in grouping items based on conceptual attributes, but they may generate more categories and their performance may be inconsistent compared to older children.
Overall, children in Grades 3 and 4 may have the cognitive abilities to complete the tasks in Group Concept Mapping research, given their skills to engage in conversational interviews and to sort items conceptually (i.e., Docherty & Sandelowski, 1999; Gibson, 2012; Melkman et al., 1981). However, the participants in this study may underperform in comparison with the Grades 5 to 6 students who participated in Nowicki et al.’s (2014) study. In particular, participants may generate fewer unique statements, create more thematic clusters, and struggle more with the instructions (i.e., Anglin, 1993; Bjorklund et al., 1992; Moely, 1977; Steward et al., 1993).
1.6
Purpose
of the Present Study
The social exclusion of children with learning difficulties and its consequences continue to be issues of concern in inclusive education (Ainscow, 2005; UNICEF, 2013).
Considering the substantial role that classmates have in making schools welcoming places, children may be able to uncover unique insights and strategies that allow them to better embrace their peers into inclusive classrooms (Nowicki & Brown, 2013).
The first aim of the present study was to investigate third- and fourth-graders’
Chapter 2
2
Method
2.1
Participants
Participants attended Grades 3 and 4 at an elementary school in a medium-sized central Canadian city. The school board employed a full-inclusion policy, where all children were educated with their same-aged peers regardless of the presence or absence of learning difficulties. The interview sample included six males and seven females with an average age of 9.40 years (SD = 0.49); four students were in Grade 3 and nine students were in Grade 4. All 13 interviewees, and an additional student who was absent on the interview day, participated in the sorting phase. However, the sort data of two
participants were later excluded in the statistical analyses since they did not group the statements conceptually, as detailed in the results section. Thus, the final sorting sample consisted of 12 children, four males and eight females, with an average age of 9.66 years (SD = 0.45). Three of the students were in Grade 3 and nine students were in Grade 4.
Participants were classified into their ethnic origins as defined by Statistics Canada (2017). In the interview sample (13 participants), seven were of European origin (e.g., Dutch, French, Portuguese, Scottish, Welsh), four of Asian origin (e.g., Vietnamese, Filipino, Syrian), one of African descent (e.g. Sudanese) and one of North American Aboriginal origin (e.g., Métis). In the sorting sample (12 participants), the number of students of each ethnic origin remained unchanged, except for the exclusion of the student of African ancestry. All children were first language speakers of or fluent in English. The sample size was within the optimal number of participants (10 to 20 participants) for Group Concept Mapping studies (Trochim, 1989).
2.2
Procedure
After the research was reviewed and approved by the Research Ethics Board at Western University and the school board’s ethics committee, a mass email was sent to elementary school principals to inform them about the study. The researcher sent follow-up emails and made calls to seven elementary schools during the two months after the initial email. A principal from one of the schools expressed interest in participating; the researcher arranged in-person meetings with the principal and classroom teachers to further explain the study and answer questions. The dates and times for data collection were
subsequently coordinated through email exchanges. The classroom teachers sent home a Letter of Information for parents, a Letter of Information for students, and a consent form with all students (see Appendices A, B, and C). Interested students brought back their signed consent forms to the teacher, which were then relayed to the researcher.
All data collection took place in a quiet and comfortable space provided by the school (i.e., independent study room, library corner, empty classroom), which allowed one-on-one interviews and undistracted sorting of statements.
2.2.1
Preparation (The Interview Phase)
As the student entered the study area, the researcher greeted him/her and encouraged the participant to make him/herself comfortable. The researcher sat at a 90-degree angle to the interviewee, confirmed that he/she had signed the consent form, and ensured that the participant had no further questions with regards to the protocol. Permission for audio recordings was obtained from eight participants; for the five participants who did not agree to have his/her voice recorded, the researcher wrote down their responses. Please seeAppendices D and E for the verbal consent script and interview questions.
To build a trusting and safe atmosphere for the interviewee, the researcher commenced with a casual conversation (i.e., “What do you like to do during your spare time?”) and acquired basic demographic information (i.e., age, gender, ethnic background).
some kids find learning new things difficult?”; “Can you give me some examples of the kinds of things that kids who have learning difficulties would find difficult at school?”; and “Do you know any kids who have learning difficulties?”
The interviewer then asked the focal question, “Why are kids who have learning difficulties sometimes left out of things at school?” and prompts (i.e., “Can you tell me more?”; “Can you think of any other examples?”) were used to encourage elaborated answers if necessary. All 13 students who participated in the interview phase completed the individual interviews. The eight-recorded interviews ranged from 6 minutes and 30 seconds to 10 minutes and 23 seconds in length, with an average length of 8 minutes and 3 seconds.
At the end of the interview, the researcher asked the participant whether he/she had any questions about what was discussed. The researcher then explained the following steps, namely the generation of statements and the sorting of statements, to the participant. Each participant was provided with a small incentive (e.g., a pen imprinted with the University logo) and a certificate to acknowledge his/her contribution. All of the students indicated they had no further questions and agreed to participate in the sorting task.
2.2.2
Generation of Statements
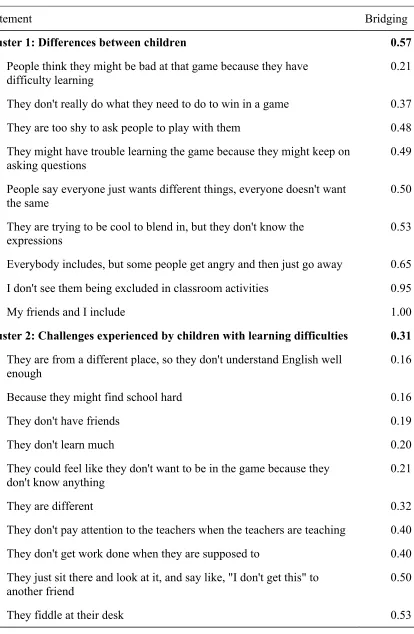
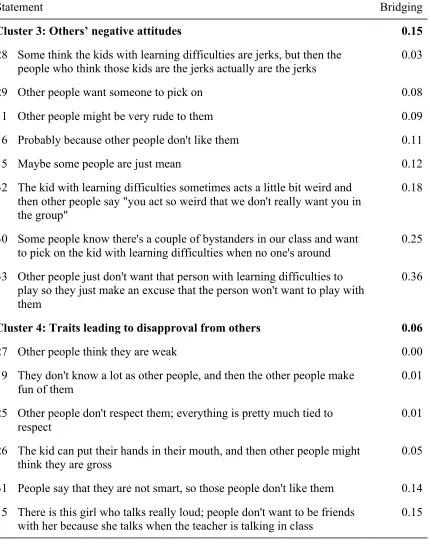
The researcher made transcripts from the individual interviews and entered extracted statements into a spreadsheet. In total, there were 42 statements. The co-investigator then reviewed the statements for clarity. Both researchers coded the statements for redundancy independently, and discrepancies were discussed until both researchers agreed upon a list of unique statements. Nowicki et al.’s (2014) study generated 49 statements with 36 participants in Grades 5 and 6; this study was expected to generate fewer statements due to the younger age of participants (Anglin, 1993; Steward et al., 1993). The final list consisted of 33 unique statements (78.6% of total number of statements), which was a sufficient amount of statements for the sorting task (see Table 1 for a list of the
Table 1: Statement in Each Cluster and Their Corresponding Bridging Values
Statement Bridging
Cluster 1: Differences between children 0.57
20 People think they might be bad at that game because they have difficulty learning
0.21
9 They don't really do what they need to do to win in a game 0.37 3 They are too shy to ask people to play with them 0.48 21 They might have trouble learning the game because they might keep on
asking questions
0.49
24 People say everyone just wants different things, everyone doesn't want the same
0.50
13 They are trying to be cool to blend in, but they don't know the expressions
0.53
23 Everybody includes, but some people get angry and then just go away 0.65 1 I don't see them being excluded in classroom activities 0.95
22 My friends and I include 1.00
Cluster 2: Challenges experienced by children with learning difficulties 0.31
10 They are from a different place, so they don't understand English well enough
0.16
12 Because they might find school hard 0.16
2 They don't have friends 0.19
8 They don't learn much 0.20
14 They could feel like they don't want to be in the game because they don't know anything
0.21
7 They are different 0.32
17 They don't pay attention to the teachers when the teachers are teaching 0.40 4 They don't get work done when they are supposed to 0.40 6 They just sit there and look at it, and say like, "I don't get this" to
another friend
0.50
Table 1 (continued)
Statement Bridging
Cluster 3: Others’ negative attitudes 0.15
28 Some think the kids with learning difficulties are jerks, but then the people who think those kids are the jerks actually are the jerks
0.03
29 Other people want someone to pick on 0.08 11 Other people might be very rude to them 0.09 16 Probably because other people don't like them 0.11 5 Maybe some people are just mean 0.12 32 The kid with learning difficulties sometimes acts a little bit weird and
then other people say "you act so weird that we don't really want you in the group"
0.18
30 Some people know there's a couple of bystanders in our class and want to pick on the kid with learning difficulties when no one's around
0.25
33 Other people just don't want that person with learning difficulties to play so they just make an excuse that the person won't want to play with them
0.36
Cluster 4: Traits leading to disapproval from others 0.06
27 Other people think they are weak 0.00 19 They don't know a lot as other people, and then the other people make
fun of them
0.01
25 Other people don't respect them; everything is pretty much tied to respect
0.01
26 The kid can put their hands in their mouth, and then other people might think they are gross
0.05
31 People say that they are not smart, so those people don't like them 0.14 15 There is this girl who talks really loud; people don't want to be friends
with her because she talks when the teacher is talking in class
2.2.3
Sorting of Statements (The Sorting Phase)
Similar to the interview phase, the researcher welcomed participants who entered the study area and confirmed that their consent forms were received. Students were seated at the table facing away from other participants to ensure the task was completed
individually. Each student received a package of statements, an instruction sheet (see Appendix F), a pencil, an eraser, some paper clips, and post-it notes (as a note-taking tool if needed). The researcher explained the task and instructed the participants to group the statements “in a way that makes sense” with a picture example (see Appendix G). Then, the researcher reminded them that they could withdraw from the study any time and confirmed that they had no questions prior to starting the task. During the sorting task, the researcher remained present in the area to answer any questions that arose, or to assist individuals who had difficulty understanding the statements. Each participant labeled the sorted piles and put all the material into a sealed envelope when done.
After the participant had completed the sorting task, the researcher asked for his/her feedback on the sorting task and offered the sorting tools (pencils, erasers, post-it notes) as a thank-you gift. The researcher also collected demographic information from the student who did not participate in the interview phase and gave her a completion
certificate. All of the 12 participants included in the sorting sample completed the sorting task. The amount of time required for participants to complete the sorting task ranged from 5 to 45 minutes (M = 20.83; SD = 11.65): four students took 10 minutes or less, five students took around 20 minutes, and three students took 30 minutes or more. The
Chapter 3
3
Results
Findings of this study were analyzed both qualitatively and quantitatively. The first part of this section is the Group Concept Mapping statistical analysis derived from The Concept System® Global MAX™ (2018) program. It is comprised of multidimensional scaling to represent the relationality of statements and hierarchical cluster analysis to identify thematic clusters (Anderberg, 1973; MacCallum, 1988). The second part presents notes and feedback that the researcher had collected during the interview and sorting phases; these provide insights to the participants’ competencies in completing the Group Concept Mapping tasks.
3.1
Group Concept Mapping Analysis
3.1.1
Multidimensional Scaling
First, the researcher inputted the sort data from the participants into the program (The Concept System® Global MAX™, 2018) to create an individual sorting matrix for each participant. Each matrix contained as many rows and columns as there were statements; for example, a 33 x 33 table with rows and columns numbered 1 through 33 in this study. The cells indicated whether the participant had sorted a pair of statements together: “1” for when the statements were grouped together, “0” for when they were not. The program then summed each cell across individual sorting matrices to produce a combined group similarity matrix. In this matrix, a high value meant many participants grouped the pair of statements together and implied that the statements shared conceptual similarities (Kane & Trochim, 2007).
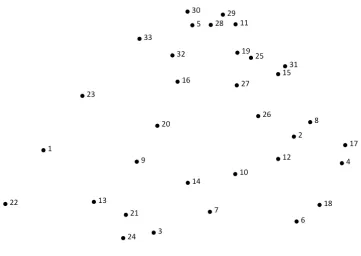
Figure 1: Multidimensional Scaling Point Map of the 33 Generated Statements
diagram, meaning they were more likely to have been grouped together by the
participants. Meanwhile, statement 17 (“they don't pay attention to the teachers when the teachers are teaching”) and statement 22 (“my friends and I include”) were on the
opposite ends of the map; this indicated that these two statements were less likely to be sorted into the same category.
The stress value (between 0 and 1) was used to determine whether the point map was a good representation of the combined group similarity matrix. A stress value closer to 0 is ideal because it would imply a smaller discrepancy between the map and the matrix. A meta-analysis showed that Group Concept Mapping projects for adults had a stress value ranging between 0.205 and 0.365, with an average of 0.285 (Trochim, 1993); Nowicki et al.’s (2014) Group Concept Mapping study with Grade 5 and 6 students yielded a stress value of 0.332. This study had a stress value of 0.226, meaning the map was a very good representation of the data.
3.1.2
Hierarchical Cluster Analysis
Next, hierarchical cluster analysis was applied to the data, grouping individual statements on the point map into clusters of statements that shared a similar concept. This clustering technique commenced by considering each statement as its own cluster, then combined clusters at each stage of the analysis until all the statements formed a large cluster. Consequently, a map with as many clusters there were as statements could be produced, meaning this study could generate 33 possible solutions. To select the number of clusters in the final solution, the investigators examined the conceptual meaning of the cluster themes and the statistical bridging values in different solutions (Kane & Trochim, 2007; Nowicki et al., 2014).
bridging value of 0.03 and would be considered an anchor statement. In contrast, a statement with a bridging value closer to 1 is a “bridging” statement, which is less consistently sorted into the same cluster by participants. This could imply that the statement is difficult to sort and perhaps lacks overarching links with other statements. An example of a bridging statement in the present study would be statement 22 (“my friends and I include”), which had a bridging value of 1.00. When the bridging values of all the statements in a cluster are averaged, they produce an index of how cohesive that cluster is (see Table 1, bolded numbers). A solution where all of its clusters have an average bridging value closer to 0 means all of the clusters are fairly cohesive, indicating that it is a good representation of the data.
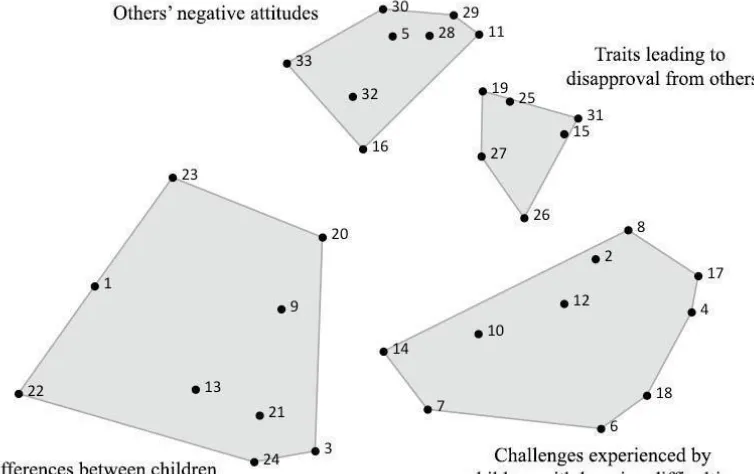
Nowicki et al. (2014) also investigated the social exclusion of children with learning difficulties in Grades 5 and 6. They examined solutions with three to six clusters, and selected a four-cluster map as the final solution. In comparison, the participants in the current study were younger and were expected to create more clusters (Moely, 1977); the investigator thus examined solutions with three to eight clusters. After inspecting the conceptual fit of the cluster themes and lists of bridging values in each generated solution, the researchers agreed that the four-cluster map was the most fitting solution (see Figure 2). Particularly, Nowicki et al.’s (2014) study had average bridging values between 0.20 and 0.65. In this study, each cluster contained 6 to 10 statements with an average bridging value between 0.06 and 0.57, which was a very good representation of the data (see Table 1).
Figure 2: Cluster Map with Four Clusters
3.1.2.1
Cluster 1: Differences Between Children
This cluster contained 9 of the 33 statements, with the highest average bridging value of all four clusters (M bridging value = 0.57; SD = 0.256). Two of the statements (statement 1, “I don't see them being excluded in classroom activities”; and statement 22, “my friends and I include”) in this cluster had high bridging values (≥ 0.95). Moreover, these two statements appeared to represent a theme independent of the other statements in this cluster: the social inclusion of peers with learning difficulties.
The seven remaining statements reflected the theme that children with and without learning difficulties are simply different, making it difficult for the two social groups to socialize with one another. In particular, two of the statements explained that children with learning difficulties cannot acquire their way into a social group because they are short of certain skills (“they are too shy to ask people to play with them”; and “they are trying to be cool to blend in, but they don't know the expressions”), whereas three other statements referred to children believing that their peers with learning difficulties have limited knowledge of common rules to keep up in a game (“people think they might be bad at that game because they have difficulty learning”; “they don't really do what they need to do to win in a game”; and “they might have trouble learning the game because they might keep on asking questions”). Statement 23 (“everybody includes, but some people get angry and then just go away”) showed children’s attempt to socialize but without much success; this is because, as statement 24 (“people say everyone just wants different things, everyone doesn't want the same”) explained, that children with and without learning difficulties are dissimilar and have different expectations of social interactions. These results suggest that social exclusion happens as a result of differences between children with and without learning difficulties.
3.1.2.2
Cluster 2: Challenges Experienced by Children with
Learning Difficulties
cluster pertained to specific behaviours of children with learning difficulties that prevent them from learning effectively in class (“they don't pay attention to the teachers when the teachers are teaching”; “they don't get work done when they are supposed to”; “they just sit there and look at it, and say like, ‘I don't get this’ to another friend”; and “they fiddle at their desk”) or described the difficulties they face with learning in general (“because they might find school hard”; and “they don't learn much”). Statement 10 addressed the problem of a language barrier (“they are from a different place, so they don't understand English well enough”) and statement 14 (“they could feel like they don't want to be in the game because they don't know anything”) described the lack of confidence in children with learning difficulties. Both of these statements also represented children with learning difficulties as being less knowledgeable than their peers without learning difficulties about certain skills. Finally, the two remaining statements (“they don't have friends”; and “they are different”) highlighted traits in students with learning difficulties that children without learning difficulties could perceive as barriers for interactions. Overall, this cluster focused on qualities in children with learning difficulties that their peers view as barriers to inclusion, with the majority of the statements addressing the academic challenges faced by children with learning difficulties.
3.1.2.3
Cluster 3: Others’ Negative Attitudes
really want you in the group’ ”; and “other people just don't want that person with learning difficulties to play so they just make an excuse that the person won't want to play with them”) were concrete examples of excluding children with learning difficulties from group activities. Therefore, this cluster focused on negative qualities in children without learning difficulties that results in social exclusion.
3.1.2.4
Cluster 4: Traits Leading to Disapproval from Others
This smallest cluster with six statements also had the lowest average bridging value (M bridging value = 0.06, SD = 0.068), meaning that the statements in this cluster were most consistently grouped together by the participants. Statements in this cluster were more objective descriptions of traits in peers with learning difficulties that lead to others’ disapproval. For instance, statements 19 and 31 (“they don't know a lot as other people, and then the other people make fun of them”; and “people say that they are not smart, so those people don't like them”) shared the idea that children believe their peers with learning difficulties are less knowledgeable, so they show a lack of courtesy towards these peers. Statements 15 and 26 (“there is this girl who talks really loud; people don't want to be friends with her because she talks when the teacher is talking in class”; and “the kid can put their hands in their mouth, and then other people might think they are gross”) referred to specific behaviours of children with learning difficulties that lead others to dislike them. Finally, statement 27 (“other people think they are weak”) was a description of how children see peers with learning difficulties as weak, and statement 25 (“other people don't respect them; everything is pretty much tied to respect”) explained that children with learning difficulties struggle with being respected by their peers.
3.2
Researcher’s Observations and Participants’
Feedback
researcher observed the participants’ performance of the task with respect to the given instructions and comprehension of the extracted statements. The researcher also asked the participants for feedback about their experience upon completion of the sorting task.
3.2.1
Understanding of
Learning Difficulties
The participants’ interpretations of learning difficulties were deduced from their
responses to four of the interview questions: Do you sometimes find learning new things difficult? Can you tell me why you think some kids find learning new things difficult? Can you give me some examples of the kinds of things that kids who have learning difficulties would find difficult at school? Do you know any kids who have learning difficulties?
Out of the 13 interviewees, 10 of the participants provided a school subject-based response (e.g., 10 mentioned mathematics, three science, two French, two gym, two language/writing, one social studies, and one visual arts). Furthermore, four of the students identified unfamiliarity with the English language as a learning difficulty. Four children gave an example of a friend or a relative who required learning assistance (i.e., hearing aids, writing on computer), but with limited knowledge of why or how the assistance was provided.
During the interview, the researcher found that five of the interviewees did not clearly demonstrate an understanding of learning difficulties. That is, they answered most of the questions and probes with “no” or “I don’t know.” Therefore, the researcher followed up with the question “Can you tell me what a ‘learning difficulty’ means to you?” If the participant was unable to provide any definition of their own, the researcher gave the following explanation of learning difficulties prior to asking the focal interview question: “Having a learning difficulty could mean that those kids’ brains work a little differently from others, so the way they learn might be different from other children. But in class, the teacher teaches everyone the same way, so it makes it harder for those kids to learn things sometimes.” The researcher asked the focal interview question after the
3.2.2
Understanding of the Focal Interview Question
In response to the focal interview question, “Why are kids who have learning difficulties sometimes left out of things at school?”, six of the participants immediately replied “I don’t know” or “I’m not sure.” In an attempt to encourage more extensive responses from these participants, the researcher repeated and rephrased the question with pauses: “Let’s say there is this kid with learning difficulties – and this kid is not included in a game or a classroom activity – why do you think that happens?” All of the children were then able to provide answers that reflected their opinions.
3.2.3
Understanding of Sorting Instructions
Although instructions were provided with specificities in verbal and written forms, various issues arose with the sorting of the statements and the labeling of the piles. For instance, two participants sorted the statements in unanticipated ways: one child grouped the statements by the length of the sentence (e.g., one line, more than one line) and another child categorized them by his level of understanding of the statements (e.g., easy, medium, difficult). Consequently, the data from these students were excluded from the data set, although their feedback on the sorting task was used because it contributed to understanding the participants’ competence in Group Concept Mapping.
3.2.4
A Difficult Statement to Sort
In particular, statement 1 (“I don’t see them being excluded in classroom activities”) was sorted into piles that had labels with contradictory meanings. All three of the Grade 3 students grouped this statement under the labels with a negative connotation (i.e., rude or mean), whereas five of the nine Grade 4 participants (55.6%) categorized the same statement under the labels with a positive or neutral connotation (i.e., good, okay, or nice).
3.2.5
Feedback on Difficulty Level of Sorting Task
Upon completion of the sorting task, the researcher asked the participants two questions to determine their experience of the task – “How did you find the task?” and “Would you be willing to do this again?” In response to the first question: four students said the task was easy or okay; four participants commented that the task was hard; another two children thought that reading the statements was easy, but deciding on how to group the statements was difficult; one student replied that some statements were easy to sort and some were hard to sort; and another child said “it was okay once you got into the task.” Moreover, nine out of the 12 participants responded that they were willing to repeat the task. The two participants who were removed from the sorting sample thought the task was hard and would not be willing to repeat the task.
3.3
Summary
The four-cluster solution was the most fitting representation of the participants’ sort data and revealed four themes in children’s responses to why they think social exclusion of their peers with learning difficulties occur at school: (a) differences between children, (b) challenges experienced by children with learning difficulties, (c) others’ negative
attitudes, and (d) traits leading to disapproval from others. The first two clusters demonstrated broader concepts whereas the latter two displayed more focused themes (see Figure 2).
Chapter 4
4
Discussion
The goals of the current study were to (a) explore third- and fourth-graders’ thoughts on social exclusion of their peers with learning difficulties in school and (b) examine competencies of third- and fourth-graders in completing Group Concept Mapping research tasks. Group Concept Mapping analysis revealed four thematic clusters to the focal interview question; cluster content will be discussed below.
4.1
Participants’ Thoughts on Social Exclusion
Nowicki et al. (2014) concluded that for students in Grades 5 and 6, social exclusion of children with learning disabilities appeared to be driven by perceived differences. The present study demonstrated similar findings: the third- and fourth-graders thought children with learning difficulties displayed characteristics or behaviours that were different from students without learning difficulties, especially during social situations (cluster 1 and cluster 4) and in learning environments (cluster 2). These differences might lead to negative reactions from children without learning difficulties, namely negative attitudes (cluster 3) and disapproval (cluster 4).
Another underlying theme in the participants’ responses was a focus on responsibility. Cluster 2 had an emphasis on the characteristics or behaviours of children with learning difficulties that held them accountable for being socially excluded by others. In
4.1.1
Cluster 1: Differences Between Children
The first cluster reflected the broadest concept of all four clusters, mainly about the differences between children with and without learning difficulties. These differences were generally related to how children with and without learning difficulties had
dissimilar expectations in social circumstances, such as how to be included or participate in a game, which could in turn become barriers for students to embrace their peers with learning difficulties into the larger social group. Statements in this cluster also suggested that some students practice inclusion of their peers with learning difficulties, yet it does not always result in a positive outcome. This could also contribute to why some children become reluctant in further attempts of social inclusion.
This cluster demonstrated that the participants were driven by both perceptual and cognitive information when making evaluations (Aboud, 1988, 2008). Some of the statements were concrete examples of individual’s observable behaviours, demonstrating a perceptual way of information processing. Yet abstract ideas (such as “shy” and “cool”) were also used by the participants to describe others’ internal characteristics, which reflected children’s cognitive processes of thinking (Caramelli, Setti, & Maurizzi, 2004).
4.1.2
Cluster 2: Challenges Experienced by Children with Learning
Difficulties
The second cluster contained the most statements and also portrayed a broad concept, namely the challenges experienced by children with learning difficulties. Most of the statements referred to learning-related challenges explicitly, including direct references of inattentive or distracted behaviours in classrooms. The remaining statements described characteristics that could interfere with children's social and academic abilities. For example, the presence of a language barrier could prevent a child from engaging with their peers during playtime and from understanding learning instructions in class. Overall, this cluster appeared to shed a negative light on children with learning difficulties, portraying them to be responsible for being socially excluded by others.
different language), lack of social connection (i.e., not having friends), and learning barriers (i.e., not knowing things, finding school difficult). This showed that the children were not bounded to stereotypical values but able to perceive the many characteristics of their peers, which resembled the ability to consider inconsistent information when classifying people (Aboud, 2003; Bigler & Liben, 1993).
4.1.3
Cluster 3: Others’ Negative Attitudes
The third cluster displayed a more narrow theme than the previous two clusters; all of the statements reported the unfriendly behaviours or thoughts that some children without learning difficulties held towards their peers with learning difficulties. The participants also chose words or phrases such as “jerks,” “rude,” “mean,” and “want someone to pick on” to describe these children who showed negative attitudes. This seemed to reflect that the participants considered the negative, internal characteristics of these children without learning difficulties to be the cause of social exclusion.
This cluster particularly displayed the participants’ ability to role-take. Many of the ideas were described as the thoughts and behaviours of others, showing how the interviewees made a speculation regarding why some students victimize peers with learning
difficulties. The participants also demonstrated a group focus in their information processing through this cluster, where they categorized students who performed
unacceptable behaviours as a group of “mean children.” Moreover, “mean children” was a subdivision of “children without learning difficulties,” which allowed the participants to make comparison between themselves and other in-group members.
4.1.4
Cluster 4: Traits Leading to Disapproval from Others
The fourth cluster in this analysis revealed a focused theme: traits and behaviours of children with learning difficulties that could lead to the disapproval from students without learning difficulties. This included traits such as “weak,” “not knowing a lot,” “not
smart,” and behaviours including “putting their hands in their mouth” and “talking really loud,” which were generally frowned upon by others. Statement 25 particularly
This cluster also included statements that reflected children’s ability to role-take, where the participants put themselves in others’ shoes to imagine what other students thought about children with learning difficulties, and why other students do not like their peers who are perceived as different. In contrast to the third cluster, however, some statements in this cluster reflected an individual focus of attention. When describing specific
examples of children with learning difficulties who showed different behaviours, the interviewees focused on one child and did not generalize their disapproval to other peers with learning difficulties.
4.1.5
Application of Aboud’s Theory
As predicted by Aboud’s (1988, 2008) social-cognitive developmental theory of
prejudice, the third- and fourth graders’ responses displayed characteristics of individual attributes, role-taking to understand others’ perspectives, abstract and internal qualities in people, and consideration of inconsistent information. However, ideas that reflected the earlier stage of the two sequences (e.g., group focus and perceptual processes) were also apparent. Overall, the participants were likely transitioning from the later stage of group focus (where they made in-group comparisons) to an individual focus (such that they did not generalize the behaviour of an individual to all out-group members). They also attended to both perceptual and cognitive processes to produce judgments. Therefore, the findings partially corroborated Aboud’s (1988, 2008) theory.
4.2
Participants’ Competence in Group Concept
Mapping
Group Concept Mapping method has rarely been applied in studies with elementary school-aged children (Nowicki et al., 2014). Given that third- and fourth-graders
4.2.1
Competencies
The stress value and average bridging values of all four clusters suggested that the final cluster solution was a very good representation of the data, which was a particularly strong support for the participants’ competencies. In fact, the values in the present study were lower than those obtained in Nowicki et al.’s (2014) study with Grades 5 and 6 students; the stress value was also lower than the average for Group Concept Mapping studies with adults (Trochim, 1993). Moreover, all of the participants were able to finish the interview task. Although six of the 14 participants (42.9%) commented that the sorting task was difficult, 12 children (85.7%) were able to provide meaningful sort data and completed the task.
In comparison with the participants from Nowicki et al.’s (2014) study, the students in the current study were younger in age and produced fewer unique statements. This could be due to their smaller vocabulary size, which limited their abilities to express diverse ideas during the interview (Anglin, 1993; Steward et al., 1993). Nevertheless, the students generated sufficient amount of statements for the sorting task. The participants were also expected to generate more clusters, as younger children tend to divide lists into a greater number of categories (Moely, 1977). However, the researchers chose the same number of thematic clusters as those in Nowicki et al. (2014)’s study to represent the participants’ categorical ideas. These outcomes demonstrated that the children in the current study were competent and reliable participants.
4.2.2
The Need for Additional Guidance
Compared to the Grades 5 to 6 students in Nowicki et al.’s (2014) study, the participants in the current study struggled with certain task instructions, but were often able to
understand the meaning of the question and answer competently. This might be an indication that the initial focal interview question was too demanding for the children to process due to its length and lack of familiar cues to help recall relevant experiences (Steward et al., 1993).
The participants also showed some difficulties with following the sorting instructions. Some students did not adhere to the instructions to avoid creating a miscellaneous pile, or forgot to label the piles after sorting. This could be due to utilization deficiency
(Bjorklund et al., 1992; Schwenck et al., 2007), where the participants were able to execute the initial step of the task (e.g., categorize the statements), but did not have additional cognitive resources to attend to the exceptions or later steps in the instruction (e.g., if the statement does not fit into a group, put it in its own pile; give each pile a label after sorting the statements).
Other components with which the participants had particular difficulties were related to vocabulary size. All of the Grade 3 students sorted the statement “I don’t see them being excluded in classroom activities” into labels with a negative connotation (i.e., “mean”), which suggested that they might have confused the word “excluded” with another term (e.g., “included”) and interpreted the statement with an opposite meaning. The researcher also found many of the sorting labels to be oversimplified and ambiguous. The children were often able to clarify the meaning of their labels in a short conversation with the researcher, but were inefficient in choosing vocabularies or phrases that were descriptive of the piles’ themes. As Anglin (1993) suggested, children's vocabulary size increases as they age and their comprehension vocabularies are larger than their production
vocabularies. Therefore, it was possible that the participants were not yet proficient at presenting their complete thoughts, or were ineffective at recalling words to convey their ideas.
4.2.3
Definition of
Learning Difficulties
provide a clear definition of the term for five of the participants as they were unable to devise a definition of their own. It appeared that the third- and fourth-graders had varying levels of understanding for the terminology. However, all of the interviewees were able to provide an answer to the focal interview question once the definition of learning difficulties was established. This suggested that the third- and fourth-graders were perhaps aware of specific peers being perceived as different and socially excluded by others, but lacked explicit knowledge and productive vocabularies to explain these events.
4.3
Implications
The findings of this study suggested that the third- and fourth-graders evaluate others using a combination of internal qualities and observable behaviours, based on both
individual and group attributes. The participants expressed that students would ostracize a peer who shows dissimilar characteristics or behaviours compared to themselves,
differentiating that child with learning difficulties from their in-group. However, they do not generalize their dislike or disrespect for one individual with learning difficulties to all out-group members. Children were also competent in morally judging the wrongfulness of a social behaviour and capable of identifying the misconduct of an in-group member. In fact, all of the children came to the conclusion that social exclusion of peers with learning difficulties is “mean” and inappropriate; they disapprove of students who behave negatively towards their peers with learning difficulties. Yet the issue of social exclusion was recognized as the responsibility of others – that of a child with learning difficulties who is perceived as different, or of a child without learning difficulties who is mean and wants to pick on someone. It was not associated with themselves or acknowledged as their own responsibility.
disabilities. The findings of the present study partially corroborated components of Aboud’s (1988, 2008) social-cognitive development theory. The theory predicts that children in around Grades 3 to 4 are beginning to develop their cognitive flexibility – an ability that helps to reduce their prejudicial attitudes. Specifically, the children
demonstrated a strong ability to role-take, which may help induce children’s moral judgments and could be the key to changing prejudicial attitudes (Killen & Rutland, 2011; Selman, 1971). This might mean that third- and fourth-graders are cognitively competent to learn and understand the ontologies of learning difficulties, and ready to become an active player in interjecting the wrongful act of social exclusion, but require more education.
Therefore, educators, parents, and psychologists should consider implementing inclusion-promoting interventions in Grades 3 to 4 classrooms. This can foster accurate knowledge, such as allowing children to understand that those with learning difficulties struggle academically or socially because their brains function differently, not because they are not trying hard enough. It may also help with reducing negative attitudes towards those with learning difficulties and decreasing the hostile actions of some children. Finally, the interventions can equip children with the tools to help their peers with learning
difficulties, including how to aid their peers in learning and stop social exclusion from happening in their surroundings. Interventions should specifically focus on perceived differences and responsibilities, which appeared to be the core concerns to children in Grades 3 to 4. In addition to recognizing individual differences as diversity and opportunities for enriched learning, students should also be encouraged to value similarities across individuals and equity to all (Nowicki et al., 2014; UNESCO, 2017).
This study also showed that the third- and fourth-graders provided meaningful responses and were able to deal with the demands of the Group Concept Mapping tasks. They were competent at completing the interview and produced a sufficient number of ideas for the sorting phase, but not all of the participants were able to accomplish the sorting task without additional help. Future studies using Group Concept Mapping with Grades 3 to 4 children should use more individual and step-by-step guidance. Specifically, the