_____________________________________________________________________________________________________ *Corresponding author: E-mail: [email protected];
www.sciencedomain.org
Levels of 43 Trace Elements in Hyperplastic Human
Prostate
V. Zaichick
1*and S. Zaichick
21
Department of Radionuclide Diagnostics, Medical Radiological Research Centre, Obninsk, Russia.
2
Department of Medicine, University of Illinois, College of Medicine at Chicago, Chicago, USA.
Authors’ contributions
This work was carried out in collaboration between both authors. Both authors read and approved the final manuscript.
Article Information
DOI: 10.9734/BJMMR/2016/25275 Editor(s): (1)Franciszek Burdan, Experimental Teratology Unit, Human Anatomy Department, Medical University of Lublin, Poland and Radiology Department, St. John’s Cancer Center, Poland. Reviewers: (1) George A. Asare, University of Ghana, Ghana. (2)Patrick Temi Adegun, Ekiti State University, Nigeria. Complete Peer review History:http://sciencedomain.org/review-history/14156
Received 25th February 2016 Accepted 6th April 2016 Published 14th April 2016
ABSTRACT
Aims: The aim of this exploratory study was to clarify the differences between the prostatic levels
of trace elements in patients with benign prostatic hyperplasia (BPH) and healthy male inhabitants.
Methodology: We prospectively evaluated the prostatic levels of 43 trace elements in 32 patients
with BPH and 32 healthy males. Measurements were performed using instrumental neutron activation analysis with high resolution spectrometry of long-lived radionuclides combined with
inductively coupled plasma mass spectrometry.
Results: In the hyperplastic prostates a significant increase in the mean level of Bi, Cr, Hg, Sb,
and Se and a significant decrease in the mean level of Ce, Cs, Dy, Er, Gd, Ho, La, Mo, Nd, Pb, Pr, Sm, Sn, Tb, Tm, U, and Y was observed. It was not found any differences in the mean prostatic level of Ag, Al, Au, B, Be, Br, Cd, Co, Fe, Li, Mn, Nb, Ni, Rb, Sc, Th, Ti, Tl, Yb, Zn, and Zr between BPH-patients and healthy males.
Conclusion: Present study finding of trace element contents and correlation between pairs of
trace element mass fractions indicates that there is a great disturbance of prostatic trace element metabolism in BPH gland. Obtained data did not confirm a critical role of Cd and Pb accumulation
in the pathogenesis of BPH. A potential age-related Zn, Fe, and Se deficiency in the prostate has
effect of the Zn, Fe, and Se supplementations on BPH prevention and treatment. Additional studies of other chemical elements in BPH are planned.
Keywords: Prostate; benign prostatic hyperplasia; prostatic trace element contents, trace element supplementations.
1. INTRODUCTION
Benign prostatic hyperplasia (BPH) represents the most common age-related urologic disease. Prostatic parenchyma contains two basic components: A glandular component composed of secretory ducts and acini, and a stromal component composed primarily of collagen and smooth muscle. BPH is histologically defined as an unregulated proliferation of glandular epithelium, connective tissue, and smooth muscle [1]. The prevalence of histological BPH is found in approximately 50-60% of males age 40-50, in over 70% at 60 years old and in greater than 90% of men over 70 [2]. To date, there is no precise knowledge of the cellular and biochemical processes underlying the etiology and pathogenesis of BPH [3]. There are a few hypotheses on the subject but the most common concept is based on the differentiating and growth-promoting actions of androgens [4].
In previous studies it was shown that the levels of zinc and some other trace elements in prostate are the androgen-dependent parameters and play an important role in prostate functions [5-10]. Moreover, it is well known that zinc and many other trace elements play important roles in cell proliferation, differentiation, and transformation and are essential for the regulation of DNA synthesis, mitosis and apoptosis [11]. Due to lifestyle, eating and dietary habits, and physiological effects of aging, the elderly male population is normally predisposed to conditions of trace elements deficiency [12], which can increase this population’s susceptibility to BPH [13]. According to the proponents of dietary supplemental trace element usage, in the absence of such supplements, cellular trace element uptake will be depressed and trace element levels in prostate will be reduced [13,14].
On the other hand, in previous studies it was found a significant tendency for an increase in level of bismuth, cadmium, chromium, mercury, thorium, uranium, and some other potentially harmful trace elements in intact nonhyperplastic prostate from age 21 years to the sixth decade
[15-17]. Moreover, it has been showed the association of cadmium, chromium, lead, and some other trace metals to BPH development and progression [18].
The trace element contents in the hyperplastic prostate have been studied, producing contradictory results [19-31]. The majority of these data are based on measurements of processed prostate samples and in many studies prostate samples are ashed before analysis. In other cases, prostate samples are treated with solvents (distilled water, ethanol etc) and then are dried at a high temperature for many hours. There is evidence that certain quantities of trace elements are lost as a result of such treatment [32-34]. Moreover, only a few of these studies employed quality control using certified reference materials for determination of the trace element mass fractions. Thus, the questions about the differences between trace element contents in intact normal and hyperplastic prostate remained open.
2. MATERIALS AND METHODS
All patients studied (n=32) were hospitalized and operated in the Urological Department of the Medical Radiological Research Centre. In all cases the diagnosis of BPH has been confirmed by clinical and histological results obtained during studies of biopsy and resected materials. Before biopsy or resection a blood transfusion in the hospitalized patients was not used. None of the patients were taking a trace element supplement known to affect prostate chemical element contents. The age of patients with BPH ranged from 56 to 78 years, the mean being 65±6 years (M±SD). Using a titanium scalpel resected materials were divided into two portions to permit morphological study of prostatic parenchyma and to estimate their trace element contents.
Intact prostates were removed at necropsy from 32 men (mean age 60±11 years, range 44–87) who had died suddenly (control group). The majority of deaths were due to trauma. The available clinical data were reviewed for each subject. None of the subjects had a history of an intersex condition, endocrine disorder, neoplasm or other chronic disease that could affect the normal development of the prostate. None of the subjects were receiving medications known to affect prostate morphology or chemical element content. All prostate glands were collected within 2 days of death and divided (with an anterior-posterior cross-section) into two portions using a titanium scalpel. One tissue portion was reviewed by an anatomical pathologist while the other was used for the trace element content determination. A histological examination was used to control the age norm conformity as well as to confirm the absence of any microadenomatosis and/or latent cancer.
After the samples intended for trace element analysis were weighed, they were freeze-dried and homogenized. The pounded samples weighing about 50 mg and 100 mg were used for trace element measurement by INAA-LLR and ICP-MS, respectively. Information detailing with the INAA-LLR and ICP-MS methods and other details of the analysis was presented in our previous publication [15,17].
For quality control, ten subsamples of the certified reference materials IAEA H-4 Animal muscle from the International Atomic Energy
Agency (IAEA), and also five sub-samples
INCT-SBF-4 Soya Bean Flour, INCT-TL-1 Tea Leaves
and INCT-MPH-2 Mixed Polish Herbs from the Institute of Nuclear Chemistry and Technology (INCT, Warsaw, Poland) were analyzed simultaneously with the investigated prostate samples. All samples of CRM were treated in the same way as the prostate samples. Detailed results of this quality assurance program were presented in earlier publications [15,17].
A dedicated computer program for INAA mode optimization was used [35]. Mean values of trace element mass fractions were taken into account
in final calculation for elements measured by both INAA-LLR and ICP-MS methods. Using Microsoft Office Excel software the arithmetic mean, standard deviation, and standard error of mean was calculated for chemical element mass fractions. The reliability of difference in the results between nonhyperplastic and hyperplastic prostate glands was evaluated by the parametric Student’s t-test and values of p<0.05 were considered to be statistically significant. For the estimation of the Pearson correlation coefficient between different pairs of the chemical element mass fractions in the normal and hyperplastic prostate the Microsoft Office Excel software was also used.
3. RESULTS
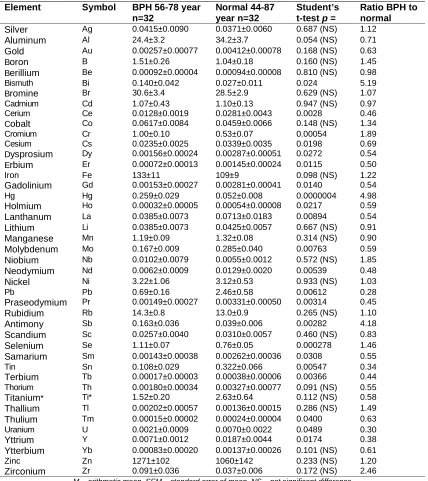
Arithmetic mean (M) and standard error of mean (SEM) for determined trace element mass fractions in hyperplastic (group of patients with BPH) and nonhyperplastic (age-matched control group) prostate are presented in Table 1. Table 1 also depicts the ratios of means and the reliability of difference between mean values of trace element mass fractions in BPH and normal prostate.
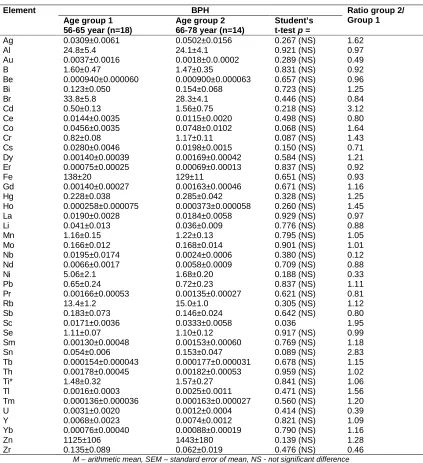
To estimate the effect of age on the trace element mass fractions in BPH gland two age groups were examined: The first comprised persons with ages ranging from 56 to 65 years (mean age 62±3 years, n=18) and the second comprised those with ages ranging from 66 to 87
years (mean age 70±5 years, n=14). The means, the ratios of means and the reliability of difference between mean values of trace element mass fractions and ratios in two age groups are presented in Table 3.
Table 1. Comparison of mean values (M±±±±SEM) of the trace element mass fraction (mg/kg, dry mass basis) in BPH and normal prostate
Element Symbol BPH 56-78 year n=32
Normal 44-87 year n=32
Student’s t-test p =
Ratio BPH to normal
Silver Ag 0.0415±0.0090 0.0371±0.0060 0.687 (NS) 1.12
Aluminum Al 24.4±3.2 34.2±3.7 0.054 (NS) 0.71
Gold Au 0.00257±0.00077 0.00412±0.00078 0.168 (NS) 0.63
Boron B 1.51±0.26 1.04±0.18 0.160 (NS) 1.45
Berillium Be 0.00092±0.00004 0.00094±0.00008 0.810 (NS) 0.98
Bismuth Bi 0.140±0.042 0.027±0.011 0.024 5.19
Bromine Br 30.6±3.4 28.5±2.9 0.629 (NS) 1.07
Cadmium Cd 1.07±0.43 1.10±0.13 0.947 (NS) 0.97
Cerium Ce 0.0128±0.0019 0.0281±0.0043 0.0028 0.46
Cobalt Co 0.0617±0.0084 0.0459±0.0066 0.148 (NS) 1.34
Cromium Cr 1.00±0.10 0.53±0.07 0.00054 1.89
Cesium Cs 0.0235±0.0025 0.0339±0.0035 0.0198 0.69
Dysprosium Dy 0.00156±0.00024 0.00287±0.00051 0.0272 0.54 Erbium Er 0.00072±0.00013 0.00145±0.00024 0.0115 0.50
Iron Fe 133±11 109±9 0.098 (NS) 1.22
Gadolinium Gd 0.00153±0.00027 0.00281±0.00041 0.0140 0.54
Hg Hg 0.259±0.029 0.052±0.008 0.0000004 4.98
Holmium Ho 0.00032±0.00005 0.00054±0.00008 0.0217 0.59 Lanthanum La 0.0385±0.0073 0.0713±0.0183 0.00894 0.54 Lithium Li 0.0385±0.0073 0.0425±0.0057 0.667 (NS) 0.91
Manganese Mn 1.19±0.09 1.32±0.08 0.314 (NS) 0.90
Molybdenum Mo 0.167±0.009 0.285±0.040 0.00763 0.59 Niobium Nb 0.0102±0.0079 0.0055±0.0012 0.572 (NS) 1.85 Neodymium Nd 0.0062±0.0009 0.0129±0.0020 0.00539 0.48
Nickel Ni 3.22±1.06 3.12±0.53 0.933 (NS) 1.03
Pb Pb 0.69±0.16 2.46±0.58 0.00612 0.28
Praseodymium Pr 0.00149±0.00027 0.00331±0.00050 0.00314 0.45
Rubidium Rb 14.3±0.8 13.0±0.9 0.265 (NS) 1.10
Antimony Sb 0.163±0.036 0.039±0.006 0.00282 4.18
Scandium Sc 0.0257±0.0040 0.0310±0.0057 0.460 (NS) 0.83
Selenium Se 1.11±0.07 0.76±0.05 0.000278 1.46
Samarium Sm 0.00143±0.00038 0.00262±0.00036 0.0308 0.55
Tin Sn 0.108±0.029 0.322±0.066 0.00547 0.34
Terbium Tb 0.00017±0.00003 0.00038±0.00006 0.00366 0.44
Thorium Th 0.00180±0.00034 0.00327±0.00077 0.091 (NS) 0.55
Titanium* Ti* 1.52±0.20 2.63±0.64 0.112 (NS) 0.58 Thallium Tl 0.00202±0.00057 0.00136±0.00015 0.286 (NS) 1.49 Thulium Tm 0.00015±0.00002 0.00024±0.00004 0.0400 0.63
Uranium U 0.0021±0.0009 0.0070±0.0022 0.0489 0.30
Yttrium Y 0.0071±0.0012 0.0187±0.0044 0.0174 0.38 Ytterbium Yb 0.00083±0.00020 0.00137±0.00026 0.101 (NS) 0.61
Zinc Zn 1271±102 1060±142 0.233 (NS) 1.20
Zirconium Zr 0.091±0.036 0.037±0.006 0.172 (NS) 2.46
Table 2. Median, minimum and maximum value of means of trace element mass fractions (mg/kg, on dry mass basis) in BPH gland according to data from the literature in comparison
with this works’ results
Element Published data reference This work
Median of means, (na)
Minimum of means M or M±SD, (nb)
Maximum of means M or M±SD, (nb)
M±SD n=32
Ag - - - 0.042±0.042
Al - - - 24±10
Au - - - 0.0026±0.0025
B - - - 1.51±0.79
Be - - - 0.00092±0.00014
Bi - - - 0.140±0.139
Br 23.3 (2) 18±9 (27)19 21.5±13 (9)20 30.6±17.2
Cd 1.3 (12) 0.395±0.200 (7)21 1641 ±960 (60) 22 1.07±1.42
Ce - - - 0.0128±0.0063
Co 19 (1) 19.0±1.5 (1)23 19.0±1.5 (1)23 0.062±0.038
Cr 99 (2) 6.5±0.5 (2)23 191±17 (27)19 1.00±0.44
Cs - - - 0.0235±0.0081
Dy - - - 0.00156±0.00080
Er - - - 0.00072±0.00042
Fe 197 (10) 5.9±0.4 (8)24 1345±95 (27)19 133±63
Gd - - - 0.00153±0.00088
Hg - - - 0.259±0.136
Ho - - - 0.00032±0.00016
La - - - 0.0187±0.0096
Li - - - 0.039±0.024
Mn 9 (7) 6.5 (-)25 23±13 (27)19 1.19±0.31
Mo - - - 0.167±0.029
Nb - - - 0.010±0.026
Nd - - - 0.0062±0.0029
Ni 22.5 (3) 1.35±1.00 (27)21 48.5±9.0 (27)19 3.22±3.51
Pb 125 (1) 125±35 (25)26 125±35 (25)26 0.69±0.53
Pr - - - 0.00149±0.00090
Rb 15.0 (2) 14.9±1.0 (43)27 15±5 (10)28 14.3±4.3
Sb - - - 0.163±0.167
Sc - - - 0.026±0.016
Se 0.98 (10) 0.76±0.37 (10)29 11.5±6.0 (27)19 1.11±0.33
Sm - - - 0.0014±0.0013
Sn - - - 0.108±0.097
Tb - - - 0.00017±0.00008
Th - - - 0.0018±0.0011
Ti 141 (1) 141±16 (27)19 141±16 (27)19 1.52±0.66*
Tl - - - 0.0020±0.0018
Tm - - - 0.00015±0.00007
U - - - 0.0021±0.0031
Y - - - 0.0071±0.0038
Yb - - - 0.00083±0.00066
Zn 725 (39) 55±25 (23)30 3800±65 (10)31 1271±623
Zr - - - 0.091±0.115
M – arithmetic mean, SD – standard deviation, na – No. of references contribution to this value,
nb – No. of samples, “–“ no data available,
Table 3. Differences between mean values (M±±±±SEM) of the trace element mass fraction (mg/kg, dry mass basis) in hyperplastic prostate glands of two age groups
Element BPH Ratio group 2/
Group 1 Age group 1
56-65 year (n=18)
Age group 2 66-78 year (n=14)
Student’s t-test p =
Ag 0.0309±0.0061 0.0502±0.0156 0.267 (NS) 1.62
Al 24.8±5.4 24.1±4.1 0.921 (NS) 0.97
Au 0.0037±0.0016 0.0018±0.0.0002 0.289 (NS) 0.49
B 1.60±0.47 1.47±0.35 0.831 (NS) 0.92
Be 0.000940±0.000060 0.000900±0.000063 0.657 (NS) 0.96
Bi 0.123±0.050 0.154±0.068 0.723 (NS) 1.25
Br 33.8±5.8 28.3±4.1 0.446 (NS) 0.84
Cd 0.50±0.13 1.56±0.75 0.218 (NS) 3.12
Ce 0.0144±0.0035 0.0115±0.0020 0.498 (NS) 0.80
Co 0.0456±0.0035 0.0748±0.0102 0.068 (NS) 1.64
Cr 0.82±0.08 1.17±0.11 0.087 (NS) 1.43
Cs 0.0280±0.0046 0.0198±0.0015 0.150 (NS) 0.71
Dy 0.00140±0.00039 0.00169±0.00042 0.584 (NS) 1.21
Er 0.00075±0.00025 0.00069±0.00013 0.837 (NS) 0.92
Fe 138±20 129±11 0.651 (NS) 0.93
Gd 0.00140±0.00027 0.00163±0.00046 0.671 (NS) 1.16
Hg 0.228±0.038 0.285±0.042 0.328 (NS) 1.25
Ho 0.000258±0.000075 0.000373±0.000058 0.260 (NS) 1.45
La 0.0190±0.0028 0.0184±0.0058 0.929 (NS) 0.97
Li 0.041±0.013 0.036±0.009 0.776 (NS) 0.88
Mn 1.16±0.15 1.22±0.13 0.795 (NS) 1.05
Mo 0.166±0.012 0.168±0.014 0.901 (NS) 1.01
Nb 0.0195±0.0174 0.0024±0.0006 0.380 (NS) 0.12
Nd 0.0066±0.0017 0.0058±0.0009 0.709 (NS) 0.88
Ni 5.06±2.1 1.68±0.20 0.188 (NS) 0.33
Pb 0.65±0.24 0.72±0.23 0.837 (NS) 1.11
Pr 0.00166±0.00053 0.00135±0.00027 0.621 (NS) 0.81
Rb 13.4±1.2 15.0±1.0 0.305 (NS) 1.12
Sb 0.183±0.073 0.146±0.024 0.642 (NS) 0.80
Sc 0.0171±0.0036 0.0333±0.0058 0.036 1.95
Se 1.11±0.07 1.10±0.12 0.917 (NS) 0.99
Sm 0.00130±0.00048 0.00153±0.00060 0.769 (NS) 1.18
Sn 0.054±0.006 0.153±0.047 0.089 (NS) 2.83
Tb 0.000154±0.000043 0.000177±0.000031 0.678 (NS) 1.15
Th 0.00178±0.00045 0.00182±0.00053 0.959 (NS) 1.02
Ti* 1.48±0.32 1.57±0.27 0.841 (NS) 1.06
Tl 0.0016±0.0003 0.0025±0.0011 0.471 (NS) 1.56
Tm 0.000136±0.000036 0.000163±0.000027 0.560 (NS) 1.20
U 0.0031±0.0020 0.0012±0.0004 0.414 (NS) 0.39
Y 0.0068±0.0023 0.0074±0.0012 0.821 (NS) 1.09
Yb 0.00076±0.00040 0.00088±0.00019 0.790 (NS) 1.16
Zn 1125±106 1443±180 0.139 (NS) 1.28
Zr 0.135±0.089 0.062±0.019 0.476 (NS) 0.46
M – arithmetic mean, SEM – standard error of mean, NS - not significant difference
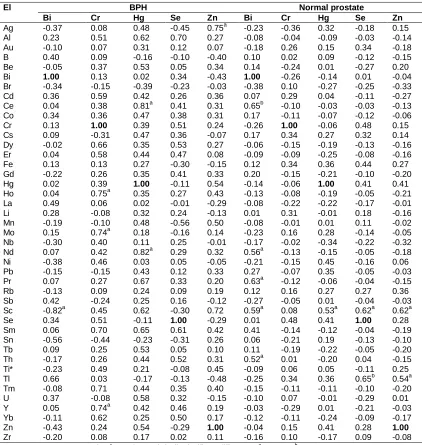
Table 4 depicts the data of inter-correlation calculations (values of r – coefficient of correlation) including pairs of selected Bi, Cr, Hg, Se, and Zn with all other trace elements identified in BPH and normal prostate glands.
4. DISCUSSION
The INAA-LLR and ICP-MS allowed determine the mean mass fractions of 10 (Ag, Co, Cr, Fe, Hg, Rb, Sb, Sc, Se, and Zn) and 41 (Ag, Al, Au,
B, Be, Bi, Br, Cd, Ce, Co, Cr, Cs, Dy, Er, Gd, Hg, Ho, La, Li, Mn, Mo, Nb, Nd, Ni, Pb, Pr, Rb, Sb, Se, Sm, Sn, Tb, Th, Ti, Tl, Tm, U, Y, Yb, Zn and Zr) trace elements, respectively, in the samples of BPH and normal prostate glands. Thus, the use two analytical methods allowed estimate the mass fractions of 43 trace elements. Moreover, good agreement was found between the mean
values of the Ag, Co, Cr, Hg, Rb, Sb, Se, and Zn
Table 4. Intercorrelations of selected pairs of the trace element mass fractions in BPH and normal prostate glands of adults (r – coefficient of correlation)
El BPH Normal prostate
Bi Cr Hg Se Zn Bi Cr Hg Se Zn
Ag -0.37 0.08 0.48 -0.45 0.75a -0.23 -0.36 0.32 -0.18 0.15
Al 0.23 0.51 0.62 0.70 0.27 -0.08 -0.04 -0.09 -0.03 -0.14
Au -0.10 0.07 0.31 0.12 0.07 -0.18 0.26 0.15 0.34 -0.18
B 0.40 0.09 -0.16 -0.10 -0.40 0.10 0.02 0.09 -0.12 -0.15
Be -0.05 0.37 0.53 0.05 0.34 0.14 -0.24 0.01 -0.27 0.20
Bi 1.00 0.13 0.02 0.34 -0.43 1.00 -0.26 -0.14 0.01 -0.04
Br -0.34 -0.15 -0.39 -0.23 -0.03 -0.38 0.10 -0.27 -0.25 -0.33
Cd 0.36 0.59 0.42 0.26 0.36 0.07 0.29 0.04 -0.11 -0.27
Ce 0.04 0.38 0.81a 0.41 0.31 0.65b -0.10 -0.03 -0.03 -0.13
Co 0.34 0.36 0.47 0.38 0.31 0.17 -0.11 -0.07 -0.12 -0.06
Cr 0.13 1.00 0.39 0.51 0.24 -0.26 1.00 -0.06 0.48 0.15
Cs 0.09 -0.31 0.47 0.36 -0.07 0.17 0.34 0.27 0.32 0.14
Dy -0.02 0.66 0.35 0.53 0.27 -0.06 -0.15 -0.19 -0.13 -0.16
Er 0.04 0.58 0.44 0.47 0.08 -0.09 -0.09 -0.25 -0.08 -0.16
Fe 0.13 0.13 0.27 -0.30 -0.15 0.12 0.34 0.36 0.44 0.27
Gd -0.22 0.26 0.35 0.41 0.33 0.20 -0.15 -0.21 -0.10 -0.20
Hg 0.02 0.39 1.00 -0.11 0.54 -0.14 -0.06 1.00 0.41 0.41
Ho 0.04 0.75a 0.35 0.27 0.43 -0.13 -0.08 -0.19 -0.05 -0.21
La 0.49 0.06 0.02 -0.01 -0.29 -0.08 -0.22 -0.22 -0.17 -0.01
Li 0.28 -0.08 0.32 0.24 -0.13 0.01 0.31 -0.01 0.18 -0.16
Mn -0.19 -0.10 0.48 -0.56 0.50 -0.08 -0.01 0.01 0.11 -0.02
Mo 0.15 0.74a 0.18 -0.16 0.14 -0.23 0.16 0.28 -0.14 -0.05
Nb -0.30 0.40 0.11 0.25 -0.01 -0.17 -0.02 -0.34 -0.22 -0.32
Nd 0.07 0.42 0.82a 0.29 0.32 0.56a -0.13 -0.15 -0.05 -0.18
Ni -0.38 0.46 0.03 0.05 -0.05 -0.21 -0.15 0.45 -0.16 0.06
Pb -0.15 -0.15 0.43 0.12 0.33 0.27 -0.07 0.35 -0.05 -0.03
Pr 0.07 0.27 0.67 0.33 0.20 0.63a -0.12 -0.06 -0.04 -0.15
Rb -0.13 0.09 0.24 0.09 0.19 0.12 0.16 0.27 0.27 0.36
Sb 0.42 -0.24 0.25 0.16 -0.12 -0.27 -0.05 0.01 -0.04 -0.03
Sc -0.82a 0.45 0.62 -0.30 0.72 0.59a 0.08 0.53a 0.62a 0.62a
Se 0.34 0.51 -0.11 1.00 -0.29 0.01 0.48 0.41 1.00 0.28
Sm 0.06 0.70 0.65 0.61 0.42 0.41 -0.14 -0.12 -0.04 -0.19
Sn -0.56 -0.44 -0.23 -0.31 0.26 0.06 -0.21 0.19 -0.13 -0.10
Tb 0.09 0.25 0.53 0.05 0.10 0.11 -0.19 -0.22 -0.05 -0.20
Th -0.17 0.26 0.44 0.52 0.31 0.52a 0.01 -0.20 0.04 -0.15
Ti* -0.23 0.49 0.21 -0.08 0.45 -0.09 0.06 0.05 -0.11 0.25
Tl 0.66 0.03 -0.17 -0.13 -0.48 -0.25 0.34 0.36 0.65b 0.54a
Tm -0.08 0.71 0.44 0.35 0.40 -0.15 -0.11 -0.11 -0.10 -0.20
U 0.37 -0.08 0.58 0.32 -0.15 -0.10 0.07 -0.01 -0.29 0.01
Y 0.05 0.74a 0.42 0.46 0.19 -0.03 -0.29 0.01 -0.21 -0.03
Yb -0.11 0.62 0.25 0.50 0.17 -0.12 -0.11 -0.24 -0.09 -0.17
Zn -0.43 0.24 0.54 -0.29 1.00 -0.04 0.15 0.41 0.28 1.00
Zr -0.20 0.08 0.17 0.02 0.11 -0.16 0.10 -0.17 0.09 -0.08
El - elements, Statistically significant difference: a - p≤0.01, b - p≤0.001
prostate samples (for ICP-MS techniques) and correctness of all results obtained by the two methods. The fact that the results for the CRM obtained in the present work were in good agreement with the certified values and within the corresponding 95% confidence intervals [15,17] suggests an acceptable accuracy of the measurements performed on the prostate samples.
In the hyperplastic prostates an increase in mass fraction of Ag, B, Bi, Co, Cr, Fe, Hg, Nb, Rb, Sb,
Bi, Co, Cr, Fe, Nb, Sb, and Tl mass fractions has respect to a hyperplastic transformation. Trace element Se is a well known and important non-enzymatic antioxidant that reduces the activity of number of physiologically generated oxygen radicals. High levels of such trace elements as Co, Cr, Hg, Fe and Zn and an imbalance with other transition metals (for example, low level of Mn) indicate indirectly an increased oxidative stress in BPH tissue. Thus, it might be supposed that the accession of oxidative stress in BPH gland was accompanied by the elevated level of Se.
In the hyperplastic prostates a significant decrease in mass fraction of Ce, Cs, Dy, Er, Gd, Ho, La, Mo, Nd, Pb, Pr, Sm, Sn, Tb, Tm, U, and Y in comparison with the normal prostates was also found (Table 1). The biochemical reason behind the low levels of these element mass fractions in BPH gland requires further study for a more complete understanding. No statistically significant differences between the mean values of all other trace element mass fractions determined in this study (Ag, Al, Au, B, Be, Br, Cd, Co, Fe, Li, Mn, Nb, Ni, Rb, Sc, Th, Ti, Tl, Yb, Zn, and Zr) for BPH and normal prostates were shown (Table 1).
The obtained mean values for Cd, Fe, Ni, Rb, Se, and Zn mass fractions in BPH gland, as shown in Table 2, agree well with median of means cited by other researches. Mean value for Br mass fraction is somewhat higher than the maximum mean value of previously reported data. The means of this work for Co, Cr, Mn, Pb, and Ti mass fractions are from one to two orders of magnitude lower, than previously reported minimal results. No published data referring to Ag, Al, Au, B, Be, Bi, Ce, Cs, Dy, Er, Gd, Hg, Ho, La, Li, Mo, Nb, Nd, Pr, Sb, Sc, Sm, Sn, Tb, Th, Tl, Tm, U, Y, Yb, and Zr mass fractions in BPH gland were found.
In previous publications [15-17,43-47] it was shown that in the histologically normal prostates of males in the sixth to ninth decades, the magnitude of mass fractions of all trace elements were maintained at near constant levels. No age-related differences in mass fraction of trace elements in the hyperplastic prostate glands of men aged from 56 to 78 years were found in this study (Table 3). The only exclusion was the mass fraction of Sc. The mean mass fraction of Sc in the prostate glands of males aged 66-78 years was almost 2 times higher (p≤0.036) than
in the prostate glands of males aged 56-65 years.
In control group of males a statistically significant (p≤0.01) direct correlation was found, for example, between the prostatic Zn and Sc (r = 0.62), and Zn and Tl (r = 0.54), between the prostatic Se and Sc (r = 0.62), and Se and Tl (r = 0.65), between the prostatic Bi and Ce (r = 0.65), Bi and Nd (r = 0.56), Bi and Pr (r = 0.63), Bi and Sc (r = 0.59), and Bi and Th (r = 0.52), and between the prostatic Hg and Sc (r = 0.53) (Table 3). In hyperplastic prostates some correlations between trace elements found in the control group are no longer evident, for example, correlations for some pairs with Se, but other correlations (direct Zn-Al, Hg-Ce, Hg-Nd, Cr-Ho, Cr-Mo, Cr-Y, and reverse Bi-Sc) are arisen (Table 3). Thus, accepting the levels and relationships of trace element mass fractions in prostate glands of males in the control group as a norm, it can be concluded that with a hyperplastic transformation the levels and relationships of chemical elements in prostate significantly changed. No published data referring to correlations between trace elements
mass fractions in BPH gland were found.
nonhyperplastic glands. Thus, “the potential role Zn, Fe, and Se deficiency” in the prostate [13] has not been confirmed as being involved in the etiology of BPH.
To clarify the role of chemical elements in prostate hyperplasia, the prostatic levels of 43 trace element mass fractions and the interrelationships of these trace element mass fractions were studied in the present work. However, there are many other chemical elements involved in normal metabolism and pathophysiology of the prostate gland. Thus, further studies are needed to extend the list of chemical elements measured using an up-to-date analytical technology. An estimation of the significance of prostatic chemical element levels as the BPH markers is also planed in the future investigations.
5. CONCLUSION
This work revealed that there is a significant tendency for an increase in Bi, Cr, Hg, Sb, and Se mass fraction in hyperplastic prostates. Present study finding of trace element contents and correlation between pairs of trace element mass fractions indicates that there is a great disturbance of prostatic chemical element relationships in BPH gland. Because the biochemical changes preceded the morphological transformations, it can be concluded that not only a high level of some trace elements but also a great disturbance in the relationships of trace elements in prostatic parenchyma is a pathogenetic factor of BPH.
Obtained data did not confirm a critical role of Cd and Pb accumulation in the pathogenesis of BPH. The potential age-related Zn, Fe, and Se deficiency in the prostate has not been found as being involved in the etiology of BPH. This work data cast doubts on a beneficial effect of the Zn, Fe, and Se supplementations on BPH prevention and treatment. Additional studies of other major, minor and trace elements in BPH gland are planned.
CONSENT
Both authors declare that written informed consent was obtained from the patient for publication of this paper.
ETHICAL APPROVAL
All studies were approved by the Ethical Committee of the Medical Radiological Research
Center, Obninsk. Ethics clearance is in the journals number 12 (10.12.2010).
ACKNOWLEDGEMENTS
The authors are grateful to Dr. Tatyana Sviridova, Medical Radiological Research Center, Obninsk, and Prof. A.A. Zhavoronkov, Institute of Human Morphology, Russian Academy of Medical Sciences, Moscow, for supplying prostate samples. The authors are also grateful to Dr. Karandaschev V., Dr. Nosenko S., and Moskvina I., Institute of Microelectronics Technology and High Purity Materials, Chernogolovka, Russia, for their help in ICP-MS analysis.
COMPETING INTERESTS
Authors have declared that no competing interests exist.
REFERENCES
1. Robert G, Descazeaud A, Nicolaïew N, Terry S, Sirab N, Vacherot F, et al. Inflammation in benign prostatic hyperplasia: A 282 patients' immunohistochemical analysis. Prostate. 2009;69:1774-80.
2. Roehrborn C, McConnell J. Etiology, pathophysiology, epidemiology and natural history of benign prostatic hyperplasia. In: Walsh P, Retik A, Vaughan E, Wein A, editors. Campbell’s Urology. 8th ed. Philadelphia: Saunders; 2002.
3. Corona G, Vignozzi L, Rastrelli G, Lotti F, Cipriani S, Maggi M. Benign prostatic hyperplasia: A new metabolic disease of the aging male and its correlation with sexual dysfunctions. Int J Endocrinol. 2014;329456.
Accessed 13 February 2014.
Available:http://dx.doi.org/10.1155/2014/32 9456
4. Patel ND, Parsons JK. Epidemiology and etiology of benign prostatic hyperplasia and bladder outlet obstruction. Indian J Urol. 2014;30:170-6.
5. Zaichick S, Zaichick V. Relations of morphometric parameters to zinc content in paediatric and nonhyperplastic young adult prostate glands. Andrology. 2013;1:139-46.
prostate glands investigated by neutron activation analysis. Appl Radiat Isot. 2013;82:145-51.
7. Zaichick V, Zaichick S. INAA application in the assessment of Ag, Co, Cr, Fe, Hg, Rb, Sb, Sc, Se, and Zn mass fraction in pediatric and young adult prostate glands. J Radioanal Nucl Chem. 2013;298:1559-66.
8. Zaichick V, Zaichick S. NAA-SLR and ICP-AES application in the assessment of mass fraction of 19 chemical elements in pediatric and young adult prostate glands. Biol Trace Elem Res. 2013;156:357-66. 9. Zaichick V, Zaichick S. Use of neutron
activation analysis and inductively coupled plasma mass spectrometry for the determination of trace elements in pediatric and young adult prostate. American Journal of Analytical Chemistry. 2013; 4:696-706.
10. Zaichick V, Zaichick S. Androgen-dependent chemical elements of prostate gland. Androl Gynecol: Curr Res. 2014;2(2).
Accessed 3 April 2014.
Available:http://dx.doi.org/10.4172/2327-4360.1000121
11. Shanker AK. Mode of action and toxicity of trace elements. In: Prasad MNV, editor. Trace Elements: Nutritional benefits, environmental contamination, and health implications. John W iley & Sons, Inc; 2008.
12. Ekmekcioglu C. The role of trace elements for the health of elderly individuals. Nahrung. 2001;45:309-16.
13. Sapota A, Daragó A, Taczalski J, Kilanowicz A. Disturbed homeostasis of zinc and other essential elements in the prostate gland dependent on the character of pathological lesions. BioMetals. 2009;22:1041-9.
14. Costello LC, Franklin RB. The clinical relevance of the metabolism of prostate cancer; zinc and tumor suppression: Connecting the dots. Mol Cancer. 2006;5:17-30.
15. Zaichick V, Zaichick S. INAA application in the assessment of chemical element mass fractions in adult and geriatric prostate glands. Appl Radiat Isot. 2014;90:62-73. 16. Zaichick V, Zaichick S. Determination of
trace elements in adults and geriatric prostate combining neutron activation with inductively coupled plasma atomic
emission spectrometry. Open Journal of Biochemistry. 2014;1(2):16-33.
17. Zaichick V, Zaichick S. Use of INAA and ICP-MS for the assessment of trace element mass fractions in adult and geriatric prostate. J Radioanal Nucl Chem. 2014;301:383-97.
18. Pandya C, Gupta S, Pillai P, Bhandarkar A, Khan A, Bhan A, et al. Association of cadmium and lead with antioxidant status and incidence of benign prostatic hyperplasia in patients of Western India. Biol Trace Elem Res. 2013;152:316-26. 19. Guntupalli JNR, Padala S, Gummuluri
AVRM, Muktineni RK, Byreddy SR, Sreerama L, et al. Trace elemental analysis of normal, benign, hypertrophic and cancerous tissues of the prostate gland using the particle-induced X-ray emission technique. Eur J Cancer Prev. 2007;16:108-15.
20. Leitão RG, Palumbo AJ, Correia RC, Souza PAVR, Canellas CGL, Anjos MJ, et al. Elemental concentration analysis in benign prostatic hyperplasia tissue cultures by SR-TXRF. Activity Report. Brazilian Synchrotron Light Laboratory; 2009. Available:http://lnls.cnpem.br/ar2009/PDF/ 1566.pdf
21. Yaman M, Atici D, Bakirdere S, Akdeniz I. Comparison of trace metal concentrations in malignant and benign human prostate. J Med Chem. 2005;48:630-34.
22. Ogunlewe JO, Osegbe DN. Zinc and cadmium concentrations in indigenous blacks with normal, hypertrophic, and malignant prostate. Cancer. 1989;63:1388-92.
23. Kwiatek WM, Banas A, Gajda M, Gałka M, Pawlicki B, Falkenberg G, et al. Cancerous tissues analyzed by SRIXE. Journal of Alloys and Compounds. 2005;401:173-7. 24. Sangen H. The influence of the trace
metals upon the aconitase activity in human prostate glands. Jap J Urol. 1967;58:1146-59.
25. Kwiatek WM, Banas A, Banas K, Podgorczyk M, Dyduch G, Falkenberg G, et al. Distinguishing prostate cancer from hyperplasia. Acta Physica Polonica. 2006;109:377-81.
27. Zaichick S, Zaichick V. EDXRF determination of trace element contents in benign prostatic hypertrophic tissue. In: fundamental interactions and neutrons, neutron spectroscopy, nuclear structure, ultracold neutrons, related topics. Dubna (Russia): Joint Institute for Nuclear Research; 2014.
28. Zaichick S, Zaichick V. Method and portable facility for energy-dispersive X-ray fluorescent analysis of zinc content in needle-biopsy specimens of prostate. X-Ray Spectrom. 2010;39:83-9.
29. Feustel A, Wennrich R, Dittrich H. Zinc, cadmium and selenium concentrations in separated epithelium and stroma from prostatic tissues of different histology. Urol Res. 1987;15:161-3.
30. Kiziler AR, Aydemir B, Guzel S, Alici B, Ataus S, Tuna MB, et al. May the level and ratio changes of trace elements be utilized in identification of disease progression and grade in prostatic cancer? Trace Elements and Electrolytes. 2010;27:65-72.
31. Györkey F, Min K-W, Huff JA, Györkey P. Zinc and magnesium in human prostate gland: Normal, hyperplastic, and neoplastic. Cancer Res. 1967;27(8 Part 1): 1349-53.
32. Zaichick V. Sampling, sample storage and preparation of biomaterials for INAA in clinical medicine, occupational and
environmental health. In: Harmonization of Health-Related Environmental
Measurements Using Nuclear and Isotopic Techniques. Vienna: IAEA; 1997.
33. Zaichick V. Losses of chemical elements in biological samples under the dry ashing process. Trace Elements in Medicine (Moscow). 2004;5(3):17-22. Russian. 34. Zaichick V. Medical elementology as a new
scientific discipline. J Radioanal Nucl Chem. 2006;269:303-9.
35. Korelo AM, Zaichick V. Software to optimize the multielement INAA of medical and environmental samples. In: Activation analysis in environment protection Dubna (Russia): Joint Institute for Nuclear Research; 1993. Russian.
36. Woodard HQ, White DR. The composition of body tissues. Br J Radiol. 1986;59:1209-18.
37. Saltzman BE, Gross SB, Yeager DW, Meiners BG, Gartside PS. Total body burdens and tissue concentrations of lead, cadmium, copper, zinc, and ash in 55
human cadavers. Environ Res. 1990; 52:126-45.
38. Terry J. The major electrolytes: Sodium, potassium, and chloride. J Intraven Nurs. 1994;17:240-7.
39. Zaichick V, Zaichick S. Relations of Bromine, Iron, Rubidium, Strontium and Zinc content to morphometric parameters in pediatric and nonhyperplastic young adult prostate glands. Biol Trace Elem Res. 2014;157:195-204.
40. Zaichick V, Zaichick S. Relations of the neutron activation analysis data to morphometric parameters in pediatric and nonhyperplastic young adult prostate glands. Advances in Biomedical Science and Engineering. 2014;1(1):26-42. 41. Zaichick V, Zaichick S. Relations of the Al,
B, Ba, Br, Ca, Cl, Cu, Fe, K, Li, Mg, Mn, Na, P, S, Si, Sr, and Zn mass fractions to morphometric parameters in pediatric and nonhyperplastic young adult prostate glands. Bio Metals. 2014;27:333-48. 42. Zaichick V, Zaichick S. The distribution of
54 trace elements including zinc in pediatric and nonhyperplastic young adult prostate gland tissues. Journal of Clinical and Laboratory Investigation Updates. 2014;2(1):1-15.
43. Zaichick S, Zaichick V. INAA application in the age dynamics assessment of Br, Ca, Cl, K, Mg, Mn, and Na content in the normal human prostate. J Radioanal Nucl Chem. 2011;288(1):197-202.
44. Zaichick S, Zaichick V. The effect of age on Ag, Co, Cr, Fe, Hg, Sb, Sc, Se, and Zn contents in intact human prostate investigated by neutron activation analysis. Appl Radiat Isot. 2011;69(6):827-33. 45. Zaichick V, Nosenko S, Moskvina I. The
effect of age on 12 chemical element contents in intact prostate of adult men investigated by inductively coupled plasma atomic emission spectrometry. Biol Trace Elem Res. 2012;147:49-58.
46. Zaichick S, Zaichick V, Nosenko S, Moskvina I. Mass fractions of 52 trace elements and Zinc trace element content ratios in intact human prostates investigated by inductively coupled plasma mass spectrometry. Biol Trace Elem Res. 2012;149(2):171-83.
analytical and related methods. Biol Trace Elem Res. 2015;168(1):44-60.
48. Mocchegiani E, Muaaioli M, Giacconi R. Zinc, metallothioneins, immune responses, survival and ageing. Biogeront. 2000; 1:133-43.
49. High KP. Nutritional strategies to boost immunity and prevent infection in elderly individuals. Clin Infect Dis. 2001;33:1892-900.
50. Padro L, Benacer R, Foix S, Maestre E, Murillo S, Sanvicens E, et al. Assessment
of dietary adequacy for an elderly population based on a mediterranean model. J Nutrit Health Aging. 2002;6:31-3. 51. Vaquero MP. Magnesium and trace
elements in the elderly: Intake, status and recommendations. J Nutrit Health Aging. 2002;6:147-53.
52. Costello LC, Franklin RB, Feng P, Tan M, Bagasra O. Zinc and prostate cancer. A critical scientific, medical and public interest issue (United States). Cancer Causes Control. 2005;16:901-15.
_________________________________________________________________________________ © 2016 Zaichick and Zaichick; This is an Open Access article distributed under the terms of the Creative Commons Attribution License (http://creativecommons.org/licenses/by/4.0), which permits unrestricted use, distribution, and reproduction in any medium, provided the original work is properly cited.
Peer-review history: