*
Effect of pipe inclination on flow behaviour of fine-grained
settling slurry
Pavel Vlasak1,*, Zdenek Chara1, Vaclav Matousek1, Jiri Konfrst1, and Mikolas Kesely 1
1 Institute of Hydrodynamics of Czech Academy of Sciences, v. v. i., Pod Patankou 30/5, 160 00, Prague 6, Czech Republic
Abstract. The effect of flow parameters of fine-grained settling slurry on the pressure drop-velocity relationship, deposition limit velocity and local concentration distribution was studied in an experimental pipe loop of inner diameter D = 100 mm with inclinable pipe sections for pipe inclination ranging from – 45° to +45°. The slurry consisted from water and narrow particle size distribution glass beads of mean diameter
d50 = 0.18 mm. The concentration distribution was studied with application of a gamma-ray densitometry.
The deposition velocity was defined as the flow velocity at which stationary deposit started to be formed at the pipe invert. The study revealed the stratified flow pattern of the studied slurry in inclined pipe sections, for slurry velocities below to the deposition limit sliding or stationary bed were created in ascending pipe sections. For low pipe inclination (α < ± 25°) the effect of inclination on local concentration distribution was not significant. Mean transport concentration for descending flow was lower than that for the ascending flow Deposition limit in inclined pipe was slightly lower than that in horizontal pipe. Frictional pressure drops in ascending pipe were higher than that in descending pipe, the difference decreased with increasing velocity and inclination.
1 Introduction
Pipeline systems used in different industrial, mining, transport and technological applications often contain inclined sections. The settling slurries, which contain particulate material, tend to stratify in horizontal and inclined parts of the pipeline system. The flow of fully or partially stratified settling slurry may be defined as the flow with an asymmetrical concentration and velocity distribution.
The stratification is dependent on the pipeline system and transported material parameters, mainly on pipe dimension and roughness, material size and density, the flow velocity, slurry concentration, and affects both the pressure drops and the operational velocity. The operational velocity is velocity at which the system should operate safe and without a danger of pipe blockage, and of course with acceptable energy consumption. Usually it is the velocity slightly above the so called a deposition limit velocity, Vdl, which is
defined as slurry velocity at which conveyed particles stop moving and start to form deposit at the bottom of a pipe [1, 2, 3, 4, 5].
Operational velocity, slurry concentration, and pressure drops are the most important parameters for transport pipelines design and operation. A number of empirical and semi-empirical correlations, which can be used to determine pressure drops and critical velocity, were developed, mostly for horizontal flow. The accuracy of these correlations depends on the specific
conditions of their development [6-12]. From half of seventies physically based models, generally called the layered models, exist.
Wilson [12] proposed a two-layer model for settling slurries with fully stratified flow pattern in horizontal pipes. The layers differ in the local concentration and velocity. Wilson supposed that at the pipe invert a granular contact bed forms if the slurry velocity is slightly below the deposition limit, and above the bed, the carrier liquid flow. Wilson’s method is based on a balance between the resisting stress of an infinitesimally thick layer of immersed, stationary particles and the driving (impelling) stress produced by the flow of liquid above the bed[9, 12]. The velocity difference between the solid and liquid phases, called slip velocity, is one of mechanisms of particle movement in two-phase flow.
Shook and Roco [6] adapted force balance equations of a two-layer model for a partially stratified slurry in inclined pipe section. Doron et al. [13] introduced a three layers model (a stationary bed, a moving bed, and a suspended slurry flow). They assumed the uniform particle distribution in the stationary and moving bed layers and the solids distribution given by the turbulent diffusion equation in the suspended slurry layer.
model for partially stratified flow. The bed is important contributor to the frictional pressure drops in settling slurry flow. Friction losses of settling slurries flow are strongly dependent on the concentration distribution, unfortunately the experimental data containing measured solids distributions, and especially in vertical and inclined pipes, are extremely scarce in the literature [1, 16, 17].
This paper focuses on experimental investigation of the effect of pipe inclination on settling slurry concentration distribution, pressure drops, and deposition limit velocity. The experimental data can be used for predictive models that will deals with effect of pipe inclination on flow behaviour of fine-grained slurries.
2 Experimental Equipment and Material
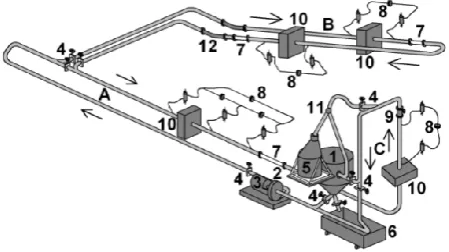
The experimental investigation was carried out on the pipe loop of inner diameter D = 100 mm made from smooth stainless steel pipes, see Fig. 1. The total length of the loop was 93 m, the horizontal (A), inclinable (B) pipe sections are connected by abrasion resistant flexible hoses (12). The pipe section B can be fixed at slopes α varying from - 45° to + 45°. Measured slurry was prepared in a mixing tank (1) and pumped by a centrifugal slurry pump GIW LCC-M 80-300 (2) with variable speed drive Siemens 1LG4283-2AB60-Z A11 (3) to the pipe loop. The pressure drops were measured by Rosemount 1151DP differential pressure transducers (8) over 2-meter long measuring sections, slurry velocities were measuredby a Krohne OPTIFLUX 5000 magnetic flow meter (9), mounted in the vertical section (C). The flow divider (11) and the sampling tank (5) allow measuring of the transport concentration. For easier operation the loop is also equipped by slide valves (4) and slurry output tank (6).
Fig. 1. Experimental test loop D = 100 mm (IH CAS, v. v. i.,).
The loop was equipped with two gamma-ray density meters (10) controlled by a computer. They consist of a γ-ray source (Caesium137Cs, activity 740 MBq) and of a
detector (a scintillating crystal of NaI(Tl)). A multi-channel digital analyser enables an evaluation of the energy spectrum of the detected signal. The measuring time period of 16 seconds was used to sense the local concentration at each position [18, 19]. The inclinable U-tube was used to determine the volumetric transport
concentration Cd of the slurry using a method by Clif &
Clif [20].
Transparent viewing pipe sections (7) for visual observation of the slurry flow behaviour and deposition limit velocity were situated just downstream to the pressure drops measurement sections of the horizontal (A), ascending and descending pipe sections (B).
The slurry consisted of rather fine glass beads B134 with narrow particle size distribution. Particle mean diameter d50 = 0.18 mm, d18= 0.16 mm, d84= 0.24 mm,
particle density ρp = 2 460 kg m-3, particle Archimedes
number Ar50 = 62.6), carrier liquid was water. The slurry
can be classified as partially stratified. The transport volumetric concentration Cd ranged from 12 to 34%.
3 Pressure gradient
Worster and Denny [21] articulated effect of pipe inclination on the pressure gradient I = dp/dL in inclined pipes with help of so called the solids effect,I = is- il,
which they defined as the difference in pressure gradients between slurry, is, and carrier liquid, il, where
dp is pressure drop over the pipe section of length dL, subscript s and l means slurry and liquid respectively.
Pressure gradient for slurry flow in pipe with inclination α is therefore given as
- Iα = - (is,α - il) = - i0. cos α + (s - l).g.sin α, (1)
where ρ is the density, and g is the gravitational acceleration, subscript α and 0 means inclined and horizontal flow, respectively. The solids effect consists from two parts – the frictional pressure gradient (the first term on right-hand side of Eq. 1) and the hydrostatic pressure (the second term on right-hand side of Eq. 1).
Because the pressure gradient due to liquid flow friction il is independent of the pipe inclination, the
directly measured slurry manometric pressure gradient Is,α in inclined pipe is
Is,α = - il– ( is,0 – il ) . cos α + (s - l) . g . sin α, (2)
and the slurry frictional pressure drops if,s,α in the
inclined pipe are
if,s,α = il,0 + ( is,0 - il) . cos α. (3)
The frictional pressure gradient for the same positive and negative pipe inclination should be the same, thus the slurry flow behaviour in positive and negative inclined pipe should be also the same, including the concentration distribution in a pipe cross section [22]. Worster and Denny neglected effect of slip velocity, which is not negligible in stratified slurry flows in inclined pipes, especially with increasing size of conveyed particles.
that Eq. (3) is theoretically valid for flow with the sliding bed, while for partially stratified flow the term cos α should be powered by factor larger than unity.
Layered models distinguish between transport, Cd, and
in situ, Cv, concentrations, and thus it is necessary to use
for calculation of the hydrostatic pressure gradient in inclined pipes the appropriate slurry density, s, which should be based on in situ concentration. Fig. 2 illustrates the results of directly measured manometric pressure drops Im = − (dp/dL) / g ρw, where subscript w means water, for
horizontal (α = 0) and positive and negative inclination of the pipe sections.
velocity [m/s]
0.5 1.0 1.5 2.0 2.5 3.0 3.5
I [mm
/m
]
-0.3 -0.2 -0.1 0.0 0.1 0.2 0.3 0.4
+5o -5o +15o -15o +25o -25o +35o -35o +45o -45o 0o D=100 mm, B134, Cd=0.25
Fig. 2. Effect of the slurry velocity V on manomeric pressure gradient Im (Cd= 0.25).
velocity [m/s]
0.5 1.0 1.5 2.0 2.5
cv
0.00 0.05 0.10 0.15 0.20
0o
+15o
-15o
+25o
-25o
+35o
-35o
+45o
-45o
D=100 mm, B134, Cd=0.12
Fig. 3. Effect of the slurry velocity V on mean in situ
concentration Cv (Cd= 0.12)
To recalculate the frictional pressure drops i from the measured manometric pressure drops Im we had to use the in situ concentration Cv , obtained by integrating
concentration profiles. Because the measured values of Cv are available only at velocity values where
concentration profiles were measured, see Fig. 3, we calculated mean in situ concentration Cv using a linear
interpolation.
At velocity values above deposition limit slurry concentration Cv remained approximately constant, at
velocities below Vdl, values of Cv quickly decreased due
to forming of sliding or stationary bed, where velocity of particles was considerable less than that of suspended particles.
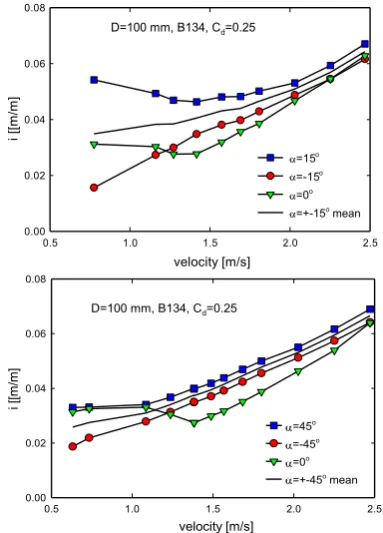
The effect of pipe inclination α on frictional pressure gradient i is illustrated in Fig. 4 for slurry transport
concentration Cd = 0.25 and pipe inclination α = 0°,
α = ± 5°, and α = ± 45°. The data in Fig. 4 illustrates that frictional pressure gradient in ascending and descending pipe are not the same, and that the Worster-Denny formula overestimates the frictional gradient in ascending pipe section and vice versa.
velocity [m/s]
0.5 1.0 1.5 2.0 2.5
i [
[m
/m
]
0.00 0.02 0.04 0.06 0.08
=15o =-15o =0o =+-15o mean D=100 mm, B134, Cd=0.25
velocity [m/s]
0.5 1.0 1.5 2.0 2.5
i [
[m
/m
]
0.00 0.02 0.04 0.06 0.08
=45o =-45o =0o =+-45o mean D=100 mm, B134, Cd=0.25
Fig. 4. Effect of the inclination angle α and flow velocity V on
frictional pressure drops i.
From Fig. 4 follow that difference between positive and negative pipe slope and between horizontal and inclined flow increases up to about inclination angle α = 25°, then slowly decreases. Maximum difference between horizontal and inclined flow were observed for slurry velocity close to the deposition limit Vdl, with
increasing slurry velocitythe difference decreased. Frictional pressure gradient was higher in the ascending pipe than that in the descending pipe, the difference decreases with increasing velocity and pipe inclination angle. The different effect of positive and negative inclination on frictional pressure gradient can be accounted for using the layered models [6, 9, 10, 12].
4 Local Concentration
From the mutual comparison of the concentration distribution in positive and negative sloped pipe sections the different structure of the flow and the effect of the pipe inclination on particle resisting forces and stress produced by the flow of carrier liquid are obvious [9, 12].
In Figs. 5–7 the chord-averaged concentration profiles, cv(y), are illustrated for different slurry
Near and above the deposition limit the ascending flow was less stratified than the corresponding descending flow. For velocities below deposition limit stationary bed was observed in ascending pipe for inclination angle α < 30°. For descending flow the thickness of the bed was significantly less and the bed disappeared for pipe slope α < - 15°.
cv
0.0 0.1 0.2 0.3 0.4 0.5 0.6
y
[m
]
0.00 0.02 0.04 0.06 0.08 0.10
=0o, V=1.38 m/s =15o, V=1.42 m/s =25o, V=1.49 m/s =35o, V=1.43 m/s =45o, V=1.38 m/s
D=100 mm, B134, Cd=0.25
cv
0.0 0.1 0.2 0.3 0.4 0.5 0.6
y
[m
]
0.00 0.02 0.04 0.06 0.08 0.10
=0o, V=1.38 m/s =-15o, V=1.42 m/s =-25o, V=1.49 m/s =-35o, V=1.43 m/s =-45o, V=1.38 m/s
D=100 mm, B134, Cd=0.25
cv
0.0 0.1 0.2 0.3 0.4 0.5 0.6
y [
m
]
0.00 0.02 0.04 0.06 0.08 0.10
=0o, V=2.05 m/s =15o, V=2.03 m/s =25o, V=2.02 m/s =35o, V=2.03 m/s =45o, V=2.03 m/s
D=100 mm, B134, Cd=0.25
cv
0.0 0.2 0.4 0.6 0.8 1.0
y [
m
]
0.00 0.02 0.04 0.06 0.08 0.10
= 0o, V=0.78 m/s =-15o, V=0.82 m/s =-25o, V=1.01 m/s =-35o, V=0.67 m/s =-45o, V=0.67 m/s D=100 mm, B134, Cd=0.25
Fig. 5. Effect of the pipe inclination α (Cd= 0.25).
With increasing inclination angle slope of the concentration profiles increased and thickness of the bed layer decreased for slurry velocity V ≈ 2 m/s, similar
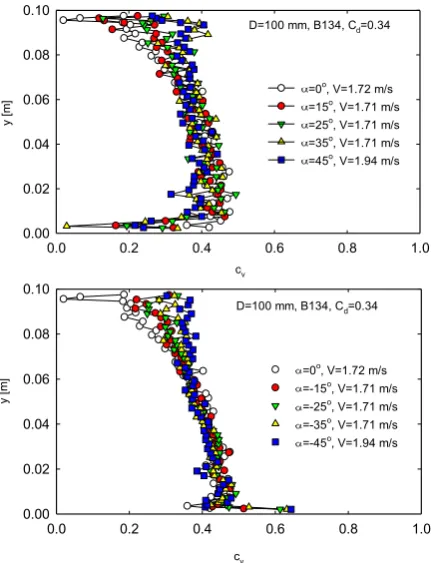
flow behaviour was observed for slurry velocities close to deposition limit, i.e. V ≈ 1.5 m/s. Local in situ concentration in the upper part of the pipe increased, this effect is more pronounced in the ascending than in descending pipe sections. Analogous behaviour was observed for lower and higher transport concentration Cd = 0.12 and Cd = 0.34 (see Figs. 6 and 7).
cv
0.0 0.1 0.2 0.3 0.4 0.5 0.6
y
[m
]
0.00 0.02 0.04 0.06 0.08 0.10
=0o, V=1.57 m/s =15o, V=1.54 m/s =25o, V=1.53 m/s =35o, V=1.53 m/s =45o, V=1.53 m/s D=100 mm, B134, Cd=0.12
cv
0.0 0.1 0.2 0.3 0.4 0.5 0.6
y [
m
]
0.00 0.02 0.04 0.06 0.08 0.10
=0o, V=1.57 m/s =-15o, V=1.54 m/s =-25o, V=1.53 m/s =-35o, V=1.53 m/s =-45o, V=1.53 m/s D=100 mm, B134, Cd=0.12
Fig. 6. Effect of the pipe inclination α (Cd= 0.12).
cv
0.0 0.2 0.4 0.6 0.8 1.0
y
[m
]
0.00 0.02 0.04 0.06 0.08 0.10
=0o, V=1.72 m/s =15o, V=1.71 m/s =25o, V=1.71 m/s =35o, V=1.71 m/s =45o, V=1.94 m/s D=100 mm, B134, Cd=0.34
cv
0.0 0.2 0.4 0.6 0.8 1.0
y [m
]
0.00 0.02 0.04 0.06 0.08 0.10
=0o, V=1.72 m/s =-15o, V=1.71 m/s =-25o, V=1.71 m/s =-35o, V=1.71 m/s =-45o, V=1.94 m/s D=100 mm, B134, Cd=0.34
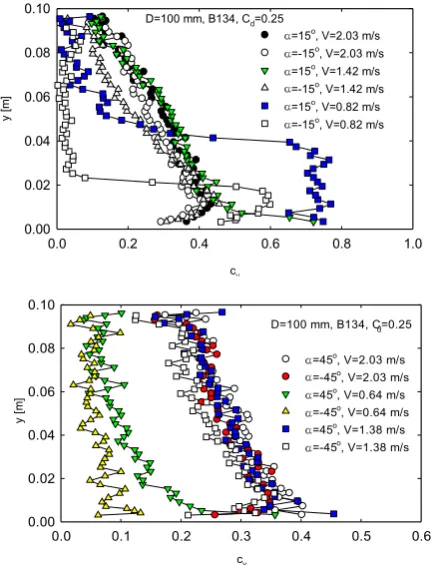
Difference between ascending and descending flows is illustrated in Fig. 8. For low inclination angle α = ± 15° and velocity close todeposition limit Vdl a bed
layer was observed in both ascending and descending pipe sections. Bed layer reached substantially lower values of local concentration cv and deposit height y in
descending pipe than that in ascending pipe. The effect of pipe inclination on concentration distribution was not significant for low inclination angle, similarly as it was found for pressure gradient [10, 19, 25].
cv
0.0 0.2 0.4 0.6 0.8 1.0
y [m
]
0.00 0.02 0.04 0.06 0.08 0.10
=15o, V=2.03 m/s =-15o, V=2.03 m/s =15o, V=1.42 m/s =-15o, V=1.42 m/s =15o, V=0.82 m/s =-15o, V=0.82 m/s D=100 mm, B134, Cd=0.25
cv
0.0 0.1 0.2 0.3 0.4 0.5 0.6
y [
m
]
0.00 0.02 0.04 0.06 0.08 0.10
=45o
, V=2.03 m/s =-45o
, V=2.03 m/s =45o, V=0.64 m/s =-45o, V=0.64 m/s =45o
, V=1.38 m/s =-45o
, V=1.38 m/s D=100 mm, B134, Cd=0.25
Fig. 8. Effect of mean slurry velocity V on local concentration profiles (Cd = 0.25).
The local concentration in ascending pipe section was always higher than that in descending pipe section due to the effect of the axial component of gravity force. In descending pipe no deposition limit was observed for angle α < - 25°.
The influence of the mean transport concentration Cd
on the chord-averaged concentration profiles is illustrated in Fig. 9, which documents decrease of the slurry stratification with increasing inclination angle and transport concentration. The stratification is visible even for higher slurry velocities for the angle of inclination α = ± 15°. For α = ± 45° the stratification was considerably smaller, and for V = 1.94 m/s and Cd = 0.34
practically disappeared in the ascending pipe.
5 Deposition limit velocity
Since 1960, numerous correlations for deposition limit velocity have been developed, mostly based on dimensional analysis. Durand and Condolios [26] (1952) introduced the dimensionless deposition velocity for horizontal flow, so called the Durand parameter FL
FL = Vdl / (2gD (s /l – 1))1/2, (4)
which can be determined as function of particle mean diameter and slurry concentration from an empirical nomogram.
cv
0.0 0.2 0.4 0.6 0.8 1.0
y [
m
]
0.00 0.02 0.04 0.06 0.08 0.10
Cd=0.12, V=1.54 m/s Cd=0.25, V=1.42 m/s Cd=0.34, V=1.40 m/s D=100 mm, B134, =15o
cv
0.0 0.2 0.4 0.6 0.8 1.0
y [
m
]
0.00 0.02 0.04 0.06 0.08 0.10
Cd=0.12, V=1.53 m/s Cd=0.25, V=1.49 m/s Cd=0.34, V=1.40 m/s D=100 mm, B134, =25o
cv
0.0 0.2 0.4 0.6 0.8 1.0
y [
m
]
0.00 0.02 0.04 0.06 0.08 0.10
Cd=0.12, V=1.53 m/s Cd=0.25, V=1.43 m/s Cd=0.34, V=1.71 m/s D=100 mm, B134, =35o
cv
0.0 0.2 0.4 0.6 0.8 1.0
y [
m
]
0.00 0.02 0.04 0.06 0.08 0.10
Cd=0.12, V=2.07 m/s Cd=0.25, V=2.03 m/s Cd=0.34, V=1.94 m/s D=100 mm, B134, =45o
Fig. 9. Effect of slurry transport concentration Cd on local
concentration profiles.
on deposition limit velocity Vdl Wilson and Tse [28]
employed the difference between Durand parameter FL
in inclined and horizontal pipe and introduced the change of Durand parameter
FL = FL,α – FL,0, (5)
where FL,α and FL,0 is Durand parameter for inclined and
horizontal pipe, respectively. They provided a nomogram relating FL with α based on results of a
computer program evaluation of their own experiments with sand and gravel (d50 from 1 to 6 mm) in a pipe of D
= 76 mm.
Their results were in agreement with measurement conducted by Hasimoto et al. [29]. De Hoog et al. [30] also verified the Wilson-Tse nomogram for coarse material (gravel of d50 = 4.6, 6.3 and 12 mm) in a
100-mm pipe, and they found the maximum Vdl at the pipe
inclination of about α = 30°.
The most often used method of an experimental determination of Vdl is a visual observation of a deposit
formation in a transparent pipe section, i.e. to trace the velocity at which a stationary bed first forms at the bottom of the pipe. In order to reduce uncertainty of Vdl
determination, we combine visual observation and changes on I(V) diagram with application of radiometric measurement. We provided measurement of local concentration in a layer close to pipe bottom.
Tab. 1. Deposition limit Vdl, α > 0,B134, Cd = 0.25
Inclination
angle α [ °] 0 5 15 25 35 45
Vdl [m/s] -
from I (V) 1.50 1.35 1.38 1.43 1.43 1.50
Vdl [ m/s] -
visualisation
1.45 1.47 1.25 1.25 1.43 1.50
Tab. 1 shows the deposition limits obtained by visualization and determined from I (V) diagrams for ascending flow. The difference between values ranges from 5% to 15%, Vdl is slightly lower in the inclined
pipes than in the horizontal pipe, the minima reached for an inclination angle between α = + 15° and α = + 25°, and then the deposition limit again slightly increased. In the descending pipe, the deposition limit values from the visual observation decreased significantly. For negative pipe inclination (α < - 15°) no real bed deposit was observed.
6 Conclusions
The effect of pipe inclination on the pressure gradient, local concentration distribution, and deposition limit velocity was studied for fine-grained settling slurry on the experimental pipe loop of inner diameter D = 100 mm. The slurry consisted of narrow particle size distribution glass beads (B134, mean diameter d50= 180
µm) and water.
It was revealed that the frictional pressure gradient for the same positive and negative pipe inclination were different. This fact is in contradiction with the assumption of the Worster-Denny formula, which overestimates the frictional gradient in ascending pipe section and vice versa.
Frictional pressure gradient in the ascending pipe was higher than that in the descending pipe, the difference decreases with increasing velocity and pipe inclination angle. Difference between ascending and descending flow increased from horizontal flow up to about inclination angle α = 25°, then slowly decreased.
The visualization and local concentration measurements revealed the stratified flow pattern of the settling slurry in inclined pipe sections. The measured chord-averaged concentration profiles showed different degrees of stratification for the positive and negative pipe inclination, for slurry velocity above the deposition limit the ascending flow was less stratified than the corresponding descending flow, the degree of stratification decreased with increasing slurry velocity and angle of inclination.
The mean in situ concentration for ascending flow was always higher than that for the descending flow. For the more steep slopes the degree of stratification was strongly affected (decreased) by the axial component of gravity force, the flow did not exhibit any bed at inclination angle α > 30°.
Deposition limit Vdl in the inclined pipes was slightly
lower than that in the horizontal pipe, the minima reached Vdl for an inclination angle α about 25°, then in
the ascending pipe the deposition limit again slightly increased. For negative pipe inclination (α < -15°) no bed deposit was observed.
Supports under the project 17-14271S of the Grant Agency of the Czech Republic, and RVO: 67985874 of the Czech Academy of Sciences are gratefully acknowledged.
References
1. V. Matousek, J. Krupicka, M, Kesely, Powder Technology, 333, 317 (2018)
2. A.D. Thomas, N.T. Cowper, Proc. HYDROTRANSPORT 20, Melbourne (Australia), 7 (2017)
3. G.V. Messa, R. De Lima Branco, J.G.D. Filho, S. Malavasi, J. Hydrol. Hydromech., 66, 121 (2018) 4. P. Vlasak, B. Kysela, Z. Chara, J. Hydrol.
Hydromech., 60, 115 (2012)
5. J.M. van Wijk, A.M. Talmon, C. van Rhee, Ocean Eng. 125, 203(2016)
6. C.A. Shook, M.C. Roco, 1991. Slurry Flow. Principles and Practice (Butterworth-Heinemann, USA, 1991)
7. P. Vlasak, Z. Chara, Powder Technology, 104, 200 (1999)
9. K.C. Wilson, R.G. Addie, A. Sellgren, R. Clift, Slurry Transport Using Centrifugal Pumps (Springer,US., 2006)
10. R.B. Spelay, R.G., Gillies, S.A. Hashemi, R.S. Sanders, Can. J. Chem. Engng, 94, 1032 (2016) 11. M.K. Gopaliya, D.R. Kaushal, J. Hydrol.
Hydromech., 64, 261(2016)
12. K.C. Wilson, Proc. HYDROTRANSPORT 4, Banff (Canada), Paper A1 (1976)
13. M. Doron, M. Simkhis, D. Barnea, Int. J. Multiphase Flow, 23, 313 (1997)
14. V. Matousek, Proc. HYDROTRANSPORT 13, BHRG, Cranfield (UK), 187 (1996)
15. V. Matousek, S. Zrostlik, J. Hydrol. Hydromech.,
66, 330 (2018)
16. V. Matousek, 2002. Exp. Therm. Fluid Sci., 26, 693 (2002)
17. P. Vlasak, Z. Chara, J. Konfrst, J. Hydrol. Hydromech., 65, 183 (2017)
18. J. Krupicka, V. Matousek, J. Hydrol. Hydromech.,
62, 126 (2014)
19. P. Vlasak, Z. Chara, J. Krupicka, J. Konfrst, J. Hydrol. Hydromech. 62, 241 (2014).
20. R. Clift, D.H.M. Clift, Int. J. Multiphase Flow, 7, 555 (1981)
21. R.C. Worster, D.F. Denny, P. I. Mech. Eng, 169, 563 (1955)
22. P. Vlasak, Z. Chara, V. Matoušek, M. Kesely, J. Konfrst, 2018a. Proc. 24th Int. Conf. Eng. Mech.,
Svratka (CR), 900 (2018)
23. V. Matousek, Flow Mechanism of Sand-Water Mixtures in Pipelines, Delft University Press, Delft (The Netherlands, 1997)
24. K.C. Wilson, S.P. Byberg, Proc. 12th Int. Conf. on
Slurry Technology, Washington (USA), 59 (1987) 25. P. Vlasak, Z. Chara, J. Konfrst, J. Krupicka, Can. J.
Chem. Engng, 94, 1040 (2016)
26. R. Durand, E. Condolios, Étude expérimentale du refoulement des matériaux en conduite, 2émes Journées de l´Hydralique, SHF, Grenoble, France (1952)
27. K.C. Wilson, Proc. HYDROTRANSPORT 6, BHRA, Cranfield (UK), 1 (1979)
28. K.C. Wilson, J.K.P. Tse, Proc. HYDROTRANSPORT 9, BHRA Fluid Engineering, Cranfield (UK), 149 (1984)
29. H. Hashimoto, L. Noda, T. Masuyama, T. Kawashima, Proc. HYDROTRANSPORT 7, BHR Group, Sendai (Japan), 231 (1980)