ABSTRACT
PEDDYCORD-LIU, ZHONGXIU AURORA. Game Learning Analytics and Qualitative Methods for Actionable Change in a Curriculum-Integrated Educational Math Game . (Under the direction of Dr. Tiffany Barnes).
Educational games have become a mainstay of learning for our new generation. As more games emerge, we face unprecedented challenges in evaluating games against their educational goals. Traditional methods fall short. Games are growing in size and complexity, which makes it increasingly inefficient to pinpoint game design flaws through controlled trial experiments. Games are intended to be used over longer periods of time, but pre- and post-tests have limited power in investigating the longitudinal process of gameplay and learning. We need new data-driven methods to understand gameplay and inform game design in an efficient, scalable fashion. The fact is, more games are being used in schools, but pure data-driven methods often ignore the rich context in classrooms. Thus, this work combines game learning analytics and qualitative methods to derive actionable insights for a curriculum-integrated K12 educational game: ST Math.
ST Math is a large-scale curriculum-integrated game used by over 1.2 million students across the U.S. In this dissertation, I have performed four studies on this game’s data and users to derive actionable insights. In the first study, I analyzed how performance and learning associated with students’ game replay behaviors. This analysis showed that replaying games was not necessarily beneficial, and some patterns may be associated with work-avoidance behaviors. In the second study, I designed data-driven methods to mine predictive relationships between math objectives and to inform the design of ST Math curriculum (sequence of math objectives). This study suggested how math objectives may connect to each other, such as that playing games involving money helps students understand fractions. In the third study, I applied learning curve analyses under different cognitive assumptions. This work pinpointed game levels where students failed to learn or transfer, identifying potential game design changes that could result in better learning. Lastly, I conducted a field study and qualitative analyses to investigate the practical gaps in the design and use of ST Math in classrooms. I identified critical needs and practices of teachers and students, and created a new framework that adds to our understanding of teacher activities around the use of a curriculum-integrated games. I also derived actionable game design feedback and generalizable insights for educational games to be used in classrooms.
© Copyright 2018 by Zhongxiu Aurora Peddycord-Liu
Game Learning Analytics and Qualitative Methods for Actionable Change in a Curriculum-Integrated Educational Math Game
by
Zhongxiu Aurora Peddycord-Liu
A dissertation submitted to the Graduate Faculty of North Carolina State University
in partial fulfillment of the requirements for the Degree of
Doctor of Philosophy
Computer Science
Raleigh, North Carolina
2018
APPROVED BY:
Dr. Collin Lynch Dr. Min Chi
Dr. Teomara Rutherford Dr. Tiffany Barnes
DEDICATION
I dedicate this dissertation to all the great people who made a positive impact to my life.
My parents Hong Wang and Jie Liu who couldn’t speak English, have never studied STEM, or attended graduate school, but supported me both financially and spiritually to pursue my dream in their clumsy way. I’m very lucky to have them as my parents.
BIOGRAPHY
Aurora was born in 1993 in Shenyang, China–a very cold city which contributes to her decision of pursuing PhD in the south. She went to the U.S. in 2010 to study math in Worcester Polytechnic Institute, but ended up falling in love with computer science. In 2014, she joined Dr. Tiffany Barnes lab at NC State, where she had the best years of her adult life. During which time, she also found a husband Barry, a cat Cinnamon Bun, and two chihuahuas Cocoa Bean and Eclair Puff. She has traveled to 15 countries and is proud of her art museums’ postcard collection.
ACKNOWLEDGEMENTS
I love my advisor Dr. Tiffany Barnes. She is ridiculously cool just as people told me when I started to apply to graduate schools. She believes in me and helps me grow both personally and professionally. I am very proud to be her student. Without her, I would never had the confidence I have today.
I am grateful to my committee: Dr. Collin Lynch, Dr. Min Chi, and Dr. Teomara Rutherford. They sincerely want me success and provide me with support and resources to do so.
TABLE OF CONTENTS
LIST OF TABLES . . . vii
LIST OF FIGURES. . . .viii
Chapter 1 Introduction. . . 1
1.1 ST Math, its Uniqueness and Generality . . . 3
1.1.1 Data and Population . . . 6
1.2 Research Questions . . . 7
Chapter 2 Literature Review . . . 9
2.1 Educational Games for Math . . . 9
2.1.1 The Design . . . 10
2.1.2 The Assessment . . . 11
2.2 Educational Data Mining and Learning Analytics . . . 12
2.2.1 Mining the Relationships in Educational Content . . . 13
2.2.2 Constructing Learning Curves . . . 14
2.3 Game Learning Analytics . . . 16
2.4 Educational Games in the Classroom . . . 17
2.5 Summary . . . 18
Chapter 3 Study 1: Is Student-initiated Game Replay Worth the Effort? . . . 20
3.1 Introduction . . . 21
3.2 Background . . . 21
3.3 Methods . . . 22
3.3.1 Data & Features . . . 22
3.3.2 Pass Attempt Features . . . 23
3.3.3 Elective Replay Features . . . 24
3.3.4 Student Grouping from ER Features . . . 24
3.4 Results & Discussion . . . 25
3.4.1 Who Engaged in Elective Replay? . . . 25
3.4.2 What Gets Replayed, and When? . . . 27
3.4.3 Is Elective Replay Associated with Gains? . . . 28
3.5 Contribution . . . 31
Chapter 4 Study 2: Inform Curricular Sequencing through Mining Predictive Relation-ships between Math Contents . . . 33
4.1 Introduction . . . 34
4.2 Background . . . 34
4.3 Method . . . 35
4.3.1 Participants & Data . . . 35
4.3.2 Mining Predictive Relationship . . . 39
4.4 Results & Discussion . . . 40
4.4.2 Categorization of Objective Pairs . . . 42
4.5 Contribution . . . 47
Chapter 5 Study 3: Pinpoint where Learning & Transfer Support is Needed Using Learn-ing Curve Analyses . . . 49
5.1 Introduction . . . 50
5.2 Background . . . 50
5.3 Method . . . 50
5.3.1 Data . . . 50
5.3.2 Fitting Learning Curves . . . 51
5.4 Result & Discussion . . . 52
5.4.1 Analyzing Puzzles in Levels . . . 52
5.4.2 Analyzing Levels in Games . . . 57
5.4.3 Analyzing Games in Objective . . . 59
5.5 Contribution . . . 60
Chapter 6 Study 4: Teacher-focused Field Study on the Classroom Use of a Curriculum-integrated Game. . . 62
6.1 Introduction . . . 63
6.2 Background . . . 63
6.3 Method . . . 64
6.4 How were Teachers Using ST Math? . . . 65
6.4.1 Preparation . . . 66
6.4.2 Integration . . . 67
6.4.3 Intervention . . . 72
6.4.4 Data-Informed Practice . . . 76
6.5 What Did Teachers Suggest? . . . 77
6.6 Contribution . . . 78
Chapter 7 Conclusion. . . 80
7.1 RQ1 . . . 81
7.2 RQ2 . . . 83
7.3 RQ3 . . . 84
7.4 Future Work . . . 86
7.5 Final Canapés . . . 87
Bibliography . . . 88
APPENDIX . . . .102
LIST OF TABLES
Table 1.1 The First Six (out of 26) Objectives from Grade 3, 2012-2013 Curriculum, and the Total Number of Games, Levels, Puzzles and Lives in each Objective. NOTE: Numbers of Lives and Puzzles are Unevenly Distributed across Game Levels. . 5 Table 1.2 Populations’ Demographics Information. . . 7
Table 3.1 Example of Elective Replay and Pass Attempts. . . 23 Table 3.2 Elective Replay (ER) Features and Their Descriptive Statistics Among Students
who Electively Replayed, Collapsed to the Student Granularity. . . 25 Table 3.3 Mann-Whitney U Tests Comparing Gameplay Characteristics Between Student
Groups of Different Elective Replay Patterns. . . 26 Table 3.4 Decision Trees to Predict Levels whose Pass Attempts were Interrupted or
Followed by Elective Replay. . . 28 Table 3.5 % of Data Observations with Gains, No Gains, and Percentage Dropped for the
Three Gain Types. . . 29 Table 3.6 Mann-Whitney U Tests Comparing Gains Between Student Groups of Different
Elective Replay Pattern. . . 31
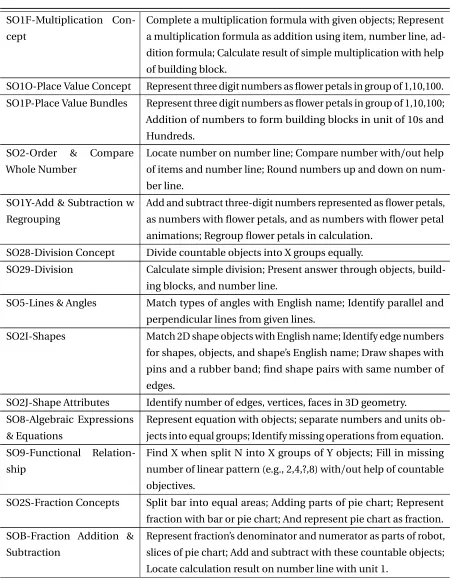
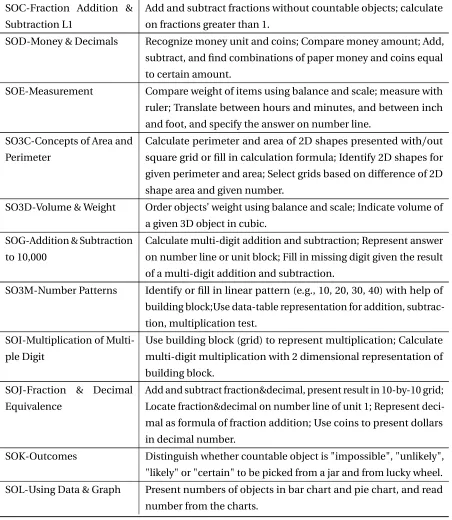
Table 4.1 A Description of Objectives in the Curriculum and Objectives with Predictive Power Over Each From Regression Analyses. . . 35 Table 4.2 Statistics of the Sequence of Objectives 3rd Grade Students Played in ST Math. 38
Table 5.1 Learning Curve Plots and AFM Statistics. . . 53 Table 5.1 (continued). . . 54 Table 5.2 Learning Models Under Different Assumptions of KC Interactions. . . 60
Table 6.1 Categories of Teacher Activities to Orchestrate a Curriculum-Aligned Digital Game in Classrooms. . . 66
LIST OF FIGURES
Figure 1.1 ST Math Content and Examples. . . 4
Figure 3.1 Decision Tree to Predict Whether a Student will Gain in State Standardized Math Test. . . 30
Figure 4.1 Objectives, the # of Objectives They Predict, and the # of Objectives that Predict Them. . . 41 Figure 4.2 Pairwise Predictive Relationship between Objectives. . . 42
Figure 5.1 An Example of a Too Difficult Level with Flat Learning Curve. . . 56 Figure 5.2 An Example Where Students Failed to Transfer. The Above Four Types of
Puzzles Showed Four Disjointed Learning Curves. . . 57 Figure 5.3 Hierarchical Combinations of Game 6 Levels that Led to Models with Different
CHAPTER
1
INTRODUCTION
Educational games have become a mainstay of learning for our current generation. From literature reviews, decades of research have shown that educational games positively impact the outcomes of learning, and motivation and attitude towards learning[Ke09; BH13; Boy16]. Consequently, there is increasing popularity of educational games worldwide[Adk17]. For example, Ambient Insight reported that global game-based learning revenue was expected to achieve 20.2% growth, reaching $8.1 billion in the next five years[Adk17]. A recent national survey reported that more teachers have started to adopt educational games in teaching[Fin15], with curriculum-integrated games identified as a key market demand[Ric13a; TV14]. For example, ST Math, the game we are studying, is integrated into the curriculum of 3,900 schools and used by over 1.2 million students according to its official website. As more and more educational games emerge and are utilized in schools, we face unprecedented challenges in designing and using educational games effectively to benefit our next generations.
mini-games or game levels that are intended to be played over a long period of time. Evaluating such games through traditional controlled experiments or user studies can be expensive and inefficient. As educational games grow in size and scale, we need data-driven methods to inform game design in an efficient and scalable fashion. Such data-driven methods need to be used in combination with human interpretations, to derive actionable insights given the educational content and specific context of learning.
Another challenge is how to support the use of serious games in authentic classroom settings [BH13]. Research has shown that games-based learning can be enhanced when combined with classroom instruction[Wou13; Row17; Bak15]. However, a recent literature review concluded that the crucial role of teachers has been neglected or marginalized, in both research and game-design [Mol17]. Teachers not only have limited knowledge to choose educational games, but limited time to play and prepare for the use of educational games before teaching[San06; Mol17; Che14; Mif13; ES13; Lim11; DT10]. Teachers may be unaware of how a game’s content or features affect learning outcomes. This means common classroom decisions, such as which game content to skip or play, could affect learning unexpectedly. We need to use data to derive educational insights on children’s gameplay and learning to empower both game designers and practitioners. These data-driven insights should be enhanced with field studies to understand the practical gaps in the design and use of educational games in classrooms.
However, there are few studies that address these challenges. The majority of math-games-research limits assessments to pre- and post-tests. Some math-games-researchers have conducted longitudinal empirical studies[Ros03; Rut10; Rut14; Sch14; Bai12a; Bak15]to prove their games’ effectiveness, as shown in Appendix I. However, pre- and post-tests alone cannot provide sufficient feedback for game design if the process of gameplay and learning itself remains in a black box. On the other hand, researchers have increasingly applied data mining and analytics methods to gameplay data [Loh15]. However, most of these studies were conducted in pre-designed experimental conditions, few analyzed data from authentic classroom settings or discussed how these analytics could help the classroom use of educational games. Moreover, few studies looked into the rich contextual information of the classroom or heard from teachers. Educational games are increasing in scale and being utilized by more schools. We need to join the forces of data-driven methods and quali-tative insights to derive actionable, practical, and generalizable insights to the design and use of educational games.
In this dissertation, I developed and applied data-driven methods to address the stated challenge, combined with field study of classroom use. I intend to make the below contributions:
• Pioneering research on curriculum-integrated educational math games, a type of game inte-grated into school activities with increasing market demand and popularity,
which could potentially benefit over 1.2 million students currently using ST Math across the U.S.,
• Data-driven and qualitative methods and insights that are applicable to educational games and other e-learning platforms, benefiting students beyond ST Math.
Together, these contributions support a new methodology of integrating human insights with data-driven methods, combining qualitative and quantitative research to derive actionable, practical insights.
1.1
ST Math, its Uniqueness and Generality
ST Math[Rut14], designed by the MIND Research Institute, teaches K-12 math concepts through solving puzzles to help a penguin ‘Jiji’. The design is centered around the following educational hypotheses: that students can gain conceptual understanding along with procedural and computa-tional skills through intuitive spatial relationships and the exposure to multiple representations of math problems; that English language learners would struggle less in a creative and language-light environment; that new math skills are built upon previously mastered skills and students will learn better by progressing from simpler to more complicated skills at their own paces[Rut14].
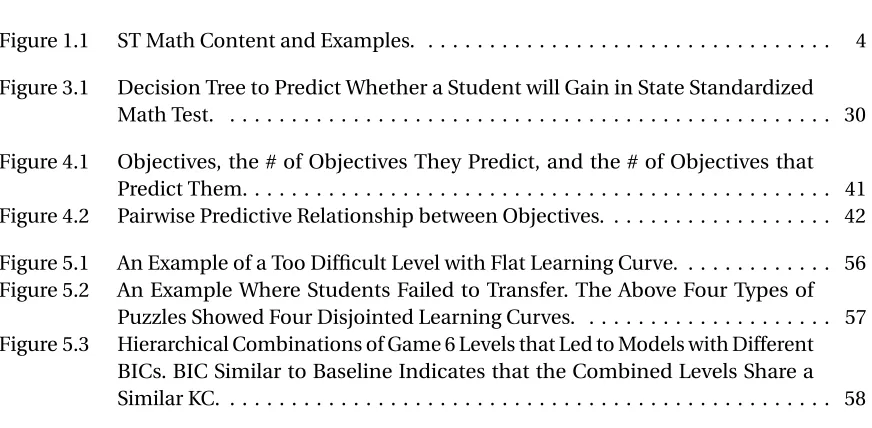
ST Math includes content mapped to the Common Core curriculum and to relevant state stan-dards and is designed as a supplement to a school’s existing math curriculum. ST Math teaches math concepts through visualizations and spatial reasoning, minimizing written instructions. Every student answer leads to animated feedback. For example, a puzzle practices multiplication of 3*4 by showing 3 dogs with missing shoes. Students calculate to select the number of shoes needed; animated feedback will show shoes missing (if the answer is less than 12), that the shoes fit, or how many shoes are left (if the answer is more than 12). Students are supposed to learn and correct their answers based on the feedback, consequently developing their understanding of multiplication. Students may struggle to get the answer, but the process itself (e.g., spatial-reasoning, reflection on wrong answers) develops student skills and mindset–productive struggle is a key component of ST Math. Figure 1.1 illustrates the hierarchy of ST Math content. Table 1.1 presents the Grade 3, 2012-2013 curriculum, and the amount of associated game content.
Figure 1.1ST Math Content and Examples.
the first sub-objective (game). Games represent scenarios for problem-solving using a particular mathematical concept, such as finding the right number of boots for X animals with Y legs as shown in the puzzle picture in Figure 1.1 Each game contains one to ten levels, which follow the same general structure of the game, but with increasing difficulty.
As with many games, students are given a set number of ‘lives’ per level. Every time they fail to complete a puzzle correctly, they lose one life. If all of their lives for a given level are exhausted, then they will be required to re-attempt the level before they can move on to new content. Once a student has passed a level, they can elect to replay it at any time. Once a student has passed every level within an objective, then they will be permitted to take the objective-level post-test. The objective pre- and post-tests consist of five to ten multiple choice questions related to the objective, and are parallel in both the question format and the content’s difficulty. Students cannot progress to the next objective until they have completed the latest objective’s post-test.
Table 1.1The First Six (out of 26) Objectives from Grade 3, 2012-2013 Curriculum, and the Total Number of Games, Levels, Puzzles and Lives in each Objective. NOTE: Numbers of Lives and Puzzles are Unevenly Distributed across Game Levels.
Objectives Equal
Groups
Multipli-cation Concept
Place Value Concept
Place Value Bundles
Ordering & Compar-ing Whole Number
Addition & Subtrac-tion with Regrouping
Total # of Games 7 6 5 7 11 8
Total # of Levels 31 20 15 29 38 31
Total # of Puzzles 221 138 106 202 267 186
Total # of Lives 62 40 30 58 76 93
generation technique based on the 957 ST Math puzzles played by 7,394 third grade students in our data sample. The proportions for each type are 38% randomly generated, 35.7% randomly selected, and 26.2% randomly ordered. The 364 randomly generated levels use rules to assign random attributes to create different puzzles, such as assigning 1-9 to each digit to create two digit numbers. We considered any level that had more than 20 different puzzles to be a randomly generated level. In the 342 randomly selected levels, students answer puzzles that are randomly selected from a pre-made puzzle pool. For the third-grade curriculum, we estimated that most of these levels have slightly more puzzles to choose from than the number of puzzles required to pass the level, but less than 20. On average, the pre-made puzzle pools contains 4.9 more puzzles than what are required to pass the level. However, the most frequent number of extra puzzles occurring in a pool is 1. In other words, the mode of the difference in the number of puzzles to select from and the number of puzzles needed to pass the level is just one. Thirty-three percent (33%) of the levels contain just one or two more puzzles beyond the number needed in the pre-made pool. In the 251 randomly ordered levels, all students answer the same pre-designed puzzles in a random order. Note that for a small number of levels, some puzzles follow a different template than the rest. For example, the first two puzzles of a level can be randomly ordered and the rest of the level can be randomly generated. In general, when data are analyzed in this dissertation, it is assumed that there is considerable similarity in the content that students see at each level.
ST Math provides functionality for the teacher to manipulate at the objective level. For example, teachers can re-ordering objectives and assign objectives as homework for the whole class. ST Math also provides feedback for teachers during and after student gameplay. During gameplay, ST Math displays information on an individual student’s screen, including the remaining lives at the current level, the number of attempts conducted at the current level, a warning hurdle for too many attempts, and whether students click the ‘raise hand’ button. After gameplay, ST Math shows reports on a student’s progress (number of levels completed in the curriculum), current objectives, pre- and post-test scores, and some other information.
ST Math provides unique research opportunities, as it is one of the few games integrated into classrooms at scale. This gives us a pioneering view on how teachers use educational games in classrooms, and informs the future design of such games. This also enables us to investigate game-play behaviors that arise with abundant time and flexibility, such as students’ optional regame-play of passed levels, and teachers’ re-ordering of game’s objectives. Moreover, ST Math is designed to be played along with the curriculum for the entire school year. Such data enable us to connect gameplay performance with the progress and transfer of learning. For example, we can see how the performance on earlier math objectives affect the later ones, and how students transfer the same math skills across different games. Lastly, ST Math allows us to investigate the practices of using educational games in classroom scenarios, and suggest game design that benefits such practical use.
Meanwhile, the data-driven insights and analytic methods derived from research on ST Math can be potentially generalized to other games and e-learning platforms. For example, ST Math’s drill-and-practice mini-game mechanism is widely applied in math educational games (see Appendix A). These games will benefit from ST Math’s data-driven methods and design insights, such as the application of learning curves to pinpoint game design flaws.
1.1.1 Data and Population
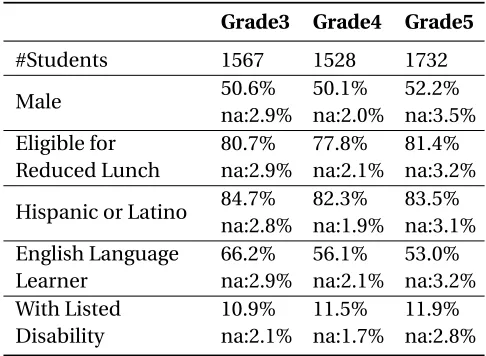
In the first stage of this project, we analyzed the state, student, and ST Math level data from 4,827 3rd-5th graders from California, during the school year 2012-2013. The students came from 17 schools and 221 classrooms, with their demographics information displayed in Table 1.2. These students created a total of 2,524,681 level attempts, with statistics regarding their specific gameplay behaviors described in Chapter 3.
Table 1.2Populations’ Demographics Information.
Grade3 Grade4 Grade5
#Students 1567 1528 1732
Male 50.6% 50.1% 52.2%
na:2.9% na:2.0% na:3.5% Eligible for
Reduced Lunch
80.7% 77.8% 81.4% na:2.9% na:2.1% na:3.2%
Hispanic or Latino 84.7% 82.3% 83.5% na:2.8% na:1.9% na:3.1% English Language
Learner
66.2% 56.1% 53.0% na:2.9% na:2.1% na:3.2% With Listed
Disability
10.9% 11.5% 11.9% na:2.1% na:1.7% na:2.8%
(with the game and objective it belongs to), and the number of puzzles correctly answered in this level attempt (before passing the level or exhausting all lives). The percentage of puzzles completed in a level attempt is defined as performance of this level attempt.
At the second stage of this project, we were provided ST Math puzzle data from 7,394 3rd grade students in a southern U.S. region. The puzzle data record gameplay at the finest granularity– students’ answer to a specific puzzle. Each observation contains a timestamp, a student ID, the puzzle played (with the level, game, and objective it belongs to), the student’s answer, the correct answer, and time took for the student to answer. Unfortunately, the puzzle-level data were not linked to demographics data and objective level pre- and post-tests, which limited our ability to conduct fine-grained analyses at puzzle level factoring in the characteristics of our student population, such as their math state test scores prior to playing ST Math.
Lastly, we were provided with opportunities to observe the use of ST Math in authentic class-rooms. We selected eight teachers from a district in Southern U.S. teaching 3rd-4th graders. We collected field observations notes and interviews approved by IRB as described in Chapter 3.
1.2
Research Questions
This work has three overarching research questions listed below. All studies contributed to answering the overarching question 1. Studies 2-3 focused on addressing question 2, and study 4 focused on addressing question 3.
2. What data-driven methods can we design to evaluate game content against educational outcomes, and to inform designs that maximize students’ learning?
CHAPTER
2
LITERATURE REVIEW
This chapter is organized as follows: the first section discusses the state of art in the design and assessment of math games–the domain subject of my thesis. The second section describes the research fields Educational Data Mining and Learning Analytics, which inspired our analytic meth-ods. The third section describes serious game analytics–the specific domain that uses data-driven analytics to improve learning in games. The last section discusses literature on the classroom use of educational games–the necessary practical considerations to inform game design.
2.1
Educational Games for Math
Appendix I shows the math games from searching academic literature in the recent decades. These works came from Google Scholar, ERIC, and the NCSU Libraries’ Databases, through searching keywords such as: math, educational games, serious games, and computer games. These works do not include commercial or individually-designed math games that have not been researched or published about their designs and assessments.
2.1.1 The Design
Modern math games exhibit three trends: the increasing diversity in game mechanisms to support other skills alongside math learning; the emergence of mini-games targeting a wide range of math skills; and the alignment between educational games and academic standards.
With regard to the first trend, game designers have realized educational games can provide cognitive and affective benefits beyond their targeted math skills. This has resulted in an increasing diversity of game mechanisms and features that target skills beyond math learning. For example, Monkey Tales[Der16]incorporates the popular drill-and-practice mechanism with increasing time pressure. The designers assumed that time pressure would enhance students’ mental arithmetic skills and working memory[Der16]. Other popular features include collaboration[MM04; Bai12a; Sto11; Vru15]and visual-spatial skills[Rut14; Ven13; Der16; Kos18].
The next trend is the emergence of mini-games targeting a wide range of math skills[Ke06; Rut14; Str14; Der16; Bak15; McL17; Hie17]. Instead of practicing a specific game skill, these mini-game groups practice a set of math skills, usually from the same domain or from a set of math concepts. These mini games have many advantages, including allowing students to practice math skills under a rich variety of presentations and problem-solving scenarios. Other advantages of mini games include flexible time duration and low technology requirements[Jon09]. These advantages make it easier for educational games to be integrated into classroom activities.
The third trend is the alignment between educational games and academic standards. These games contain a large amount of educational material and are designed to be played alongside the school’s curriculum over the duration of the semester. Such curriculum-aligned games have been recognized as a key market demand[Ric13a; TV14], influenced by the federal No Child Left Behind (NCLB) Act[Ric13a]. One reason is that educational games have been found to help weaker students catch up[Bai12a; McL17; Mas17; Ku14], and improve students’ attitude towards math learning[McL17; Cas14; Ric13b; Bai12a; KG07; Ke06; Ke08; Ku14]. Consequently, more games are designed as supplementary curriculum resources to help schools meet standardized assessments. Examples of these games are Astra Eagle[Ke06], MotionMath[Ric13b; TJ17], VmathLive[Kin11], Knowledge Battle[Hie17], My-Pet-My-Quest[Che12; LIA12], and ST Math[Rut14].
objective contains a set of mini-games, representing different problem-solving scenarios under a drill-and-practice mechanism. ST Math does not contain written instructions so it requires both math skills and spatial-temporal reasoning skills to solve its puzzles[Rut14]. Therefore, studying the ST Math game will provide a pioneering view on the design of future games and impact game-based learning for future generations.
2.1.2 The Assessment
Decades of research have found that math educational games are effective at improving learning outcomes as compared to traditional teaching methods alone, such as[Ran92; Ke09; BH13; Ros03; CZ04; Ke08; KG07; Cas14; Sch14; Bai12a; Ku14; Bak15; Hie17; McL17]. Many math games have led to other positive outcomes, such as improved motivation and attitudes towards math learning [McL17; Cas14; Ric13b; Bai12a; KG07; Ku14; Ke06; Ke08]. Increasingly, researchers have conducted longitudinal empirical studies to prove the effectiveness of math games as compared to traditional classroom instruction, with improved learning outcomes found in most[Ros03; Rut10; Rut14; Sch14; Bai12a; Bak15].
However, as shown in Appendix A, the majority of math game assessments were limited to pre- and post-tests and questionnaires. Some studies (17 out of 50) generated game usage and performance statistics from in-game logs to assist analysis. However, few studies (8 out of 50) applied learning analytics to delve deep into user performance or behavior patterns, or related them to math performance or math game design[Bak07; Kli11; Ven13; LIA12; Dav13; Mar15; MN17; Kou17]. Moreover, most studies lasted only a few sessions or a few weeks long. Among the 14 studies that ran over three months, six relied on pre- and post-tests before and after gameplay, which ignored the much longer process of gameplay and learning in between tests[Keb10; Bai12a; Rut10; Rut14; Sch16; Kin11]. Among the rest of the eight studies that collected data during gameplay: three applied classroom observations and user diaries to gather qualitative data[Der16; Bes17; Ros03]; five looked into games’ data logs, in which four studies (three of them belongs to the same Maths Garden game) went beyond reporting basic usage statics and applied game learning analytics[Kli11; Ven13; MN17; LIA12].
large amount of students already playing ST Math. We need data-driven methods that penetrate the black box between pre- and post-tests in order to better inform game design to achieve educational goals.
Moreover, penetrating this black box will significantly benefit the math domain. For example, researchers have increasingly shown that math learning is inherently hierarchical[Dun07; RS11]. Children tend to follow a certain trajectory as early skills build upon each other to form a more complex understanding of mathematics[CS14]. Data collected during the learning process would help us understand how such math learning occurs in the game context, and how to design games that support such learning trajectories[Con17b; Con17a]. Another example is that certain math skills, such as fractions, are difficult for 3rd graders, which calls for research on how to teach them better[MH08; RJ09; Han17; Jor17]. Educational games, especially those applied at large scale such as ST Math, collect rich data that would yield valuable insights on how students develop understanding of certain math skills. These insights can not only inform game design, but can benefit the broader field of math education.
However, data-driven methods alone are not enough. Previous work[Ke08; Lin11; Der16; TJ17; Bes17; LJ17; Nan18]has shown that qualitative methods compliment game learning analytics by providing rich, contextual information on gameplay that can lead to valuable game design insights. For example, Lindstrom et al.[Lin11]conducted a nine-week-long field observation of students playing a place-value math game. By observing students’ gameplay, the authors identified possible mismatches between pedagogical principles intended by the designer and the actual use by students. Because ST Math is a curriculum-integrated game commonly used in school, applying field studies and qualitative methods to understand the use of the game in authentic classroom scenarios is of crucial importance. Qualitative methods would help interpret data-driven insights, which will guard against the spurious results that could arise from the sheer amount of data with no empirical meaning or practical impacts. Additionally, qualitative methods empower teachers to share their perspectives, which can lead to game design principles that could empower practitioners.
2.2
Educational Data Mining and Learning Analytics
Educational Data Mining[RV13](EDM) and Learning Analytics[SB12](LAK) are new fields with a common goal to improve and understand learning through data. EDM has greater focus on automatic discovery, and LAK puts more emphasis on informing and empowering instructors and learners[SB12; BI14].
these, we need insights from both EDM and LAK communities. The following subsections describe exemplary work that relates to my application.
2.2.1 Mining the Relationships in Educational Content
There has been a growing interest in using data-driven approaches to inform curricular design, especially the sequencing of educational content.
At the skill granularity, researchers have informed educational content sequencing through mining prerequisites between skills. Chen et al.[Che16]applied Structural Expectation Maximization to learn the optimal Bayesian network structures that represent skill prerequisites using students’ performance from textbook exercise for an English Proficiency test. Chen et al.[Che15]applied Association Rule Learning on the same educational context, which assumed that one skill is a prerequisite for another if the probabilities of mastering skill A given that B is mastered, or not mastering skill A given that B is not mastered, were both above a certain threshold. Brunskill[Bru11] used Expectation Maximization with the conditional probabilities of observing certain performances on test questions, which are designed to map each question to a single skill, to discover prerequisite relationships between linear inequality math skills. This mapping process also faces the risk of expert blind-spots–pedagogical organization based on “the structure of the domain rather than the learning needs of novices”[Nat01]. Moreover, these methods require a significant amount of effort to map educational content to specific skills, which can be extremely costly in large-scale games such as ST Math.
results are interpretable and can derive actionable insights for game design and usage.
At the course granularity, Ochoa, Yang et al. and Moretti[Och16; Yan15; Mor14]applied data-driven methods on high-level data such as enrollment, web-mined course descriptions, and online ratings to inform the selection and sequencing of college courses. For example, Yang et al.[Yan15] projected courses to concepts (skills) extracted from online course descriptions, used pre-existing course prerequisites to optimize the relationship between concepts and predicted course prerequi-sites of another university. However, these methods are not applicable to ST Math. ST Math does not have enough verbal descriptions on games’ math concepts to apply these methods, as it is designed to be an language-light environment that teaches math through visual-spatial reasoning. At the system granularity, Pechenizkiy et al. and Pechenizkiy and Toledo[PT14]designed conceptual frameworks for the cyclic process of curriculum mining and designing.
However, little work has applied such data-driven methods in serious games. In Chapter 4, I present a method that can inform the sequencing of ST Math objectives at the problem-set granu-larity.
2.2.2 Constructing Learning Curves
Simply finding correlations or predictive relationships among games is not enough to inform content design within games, because within an objective, games are played following a defined order in ST Math. However, games represent various problem-solving scenarios under the same math topic, which contain levels of progressing difficulties. Investigating how levels and games maps to the fine-grained skill can yield insights on how students transfer and improve performance across problem-solving scenarios. Such insights can pinpoint where game design can better support student learning.
Moreover, many derived Q-matrices aim to increase the accuracy of predicting student responses [Lan14; DN13], rather than producing interpretable relationships. To inform the content design of ST Math, we need methods that yield interpretable results.
Learning curve analysis is an interpretable method that models knowledge growth through connecting content to skill. Learning Curves are derived from the cognitive theory of Newell and Rosebloom[NR81]. This theory assumes that with more practice, a students’ accuracy at answering a question improve following a logarithmic curve. In other words, a good learning curve shows that students’ accuracy increases, but the amount of this increase gets smaller over time. After enough practice, the increase will be negligible, and students can be considered to have reached their best performance. Learning curves are great choices for modeling data in games with a drill-and-practice mechanism, as students practice the same skills consecutively.
Several learning models have been applied to fit learning curves. The Additive Factors Model (AFM)[Cen06]is a logistic regression model that assumes the probability of correctly answering a question depends on individual students’ parameters, the skill difficulties, and the number of previous practice opportunities on the skills. For questions containing multiple skills, the difficulty and practice attempts of these skills are summed together. This assumes that a student can correctly answer a question without knowing all of the skills involved, provided the summation of known skills passes a certain threshold. The Conjunctive Factor Model (CFM)[Cen08]is similar to AFM, but assumes that the difficulties and practice of skills are multiplied together for questions with multiple skills. This means that a student can never answer a question correctly unless they know all the required skills. Another method is Performance Factor Analysis (PFA)[Pav15], which is similar to AFM with an additional assumption that success and failure have different impacts on learning. Because we don’t currently have evidence that this additional assumption of PFA holds in ST Math, we focused on applying AFM and CFM in this paper.
Despite the wide application of empirical Learning Curves in intelligent tutors and other e-learning platforms, there has been little application in serious games. As an exception, Harpstead and Aleven[HA15]applied the AFM model in a physics game. Through examining learning curves, they identified an unforeseen shortcut strategy with which students could pass the game without sufficiently mastering its underlying math concepts. Similarly, Baker et al.[Bak07]fit learning curves in a action-based math game to model gains in speed and accuracy over time. They found that modeling accuracy helped to identify skills that needed extra support and scaffolding. However, modeling speed (time taken to answer a question) was not as helpful, because it was hard to separate the increases in speed due to increased math fluency from those that were due to the increased familiarity with the gameplay. Lomas et al.[Lom13]applied learning curves to a game locating numbers on a number line. They found when students were allowed to pass the game with less accurate estimations, the learning rate was lower.
within serious games. However, in all previous work, the games studied represented a single solving scenario. In contrast, games such as ST Math practice math skills through various problem-solving scenarios. Applying learning curves to ST Math can yield not only game design insights, but can help understand how students transfer knowledge across different problem-solving scenarios.
2.3
Game Learning Analytics
Serious games are games designed for a primary purpose other than entertainment[Loh15]. Simi-larly, Game Learning Analytics[Fre16](also called Serious Game Analytics[Loh15]) grounds game design in students’ learning and performance on targeted skills, whereas traditional game analytics primarily focuses on player enjoyment[Loh15]. Game learning analytics connects data during gameplay, such as user actions, choices, and performances, with assessments outside gameplay, such as learning gain and psychological responses. This approach penetrates the black box of what happened in between the traditional pre- and post-tests and converts user-generated data into actionable game-design insights. Game learning analytics also shares similar and potentially trans-ferable methods with Learning Analytics[SB12]and Educational Data Mining[RV13]. However, Game learning analytics is a more specific domain, whose nature of play and learning can be inherently different from other e-learning environments. We need more research to verify the applicability of these methods across domains, and to adapt these methods to solve contemporary challenges in educational games.
Game learning analytics connects game design to gameplay behaviors and learning. This pro-vides feedback for game designers to better achieve their educational goals. In another work, Harp-stead et al.[Har14]clustered data from 174 students to investigate the alignment between the game’s feedback (how it reacts to the student gameplay artifacts), and the game’s educational goals (physics principles of stability). This work suggested redesigns for more consistent and immediate feedback. Hicks et al.[Hic16]applied survival analysis and interaction networks[Eag12]to evaluate the game-play from 433 students on 30 levels of a physics game. This work pinpointed problem spots where students frequently dropped out due to a rough progression of levels’ difficulties. ST Math contains dozens of math objectives and hundreds of mini games for each grade’s curriculum. Thus, applying game learning analytics would help pinpoint problematic content efficiently and yield valuable feedback to game designers to improve gameplay and learning.
determin-istic patterns in their gameplay choices demonstrated higher target skill acquisition. Bauer et al. [Bau17]analyzed problem-solving behaviors through visualizing and quantifying solution spaces in a science-discovery game. They found high-performing problem solvers explored more hypotheses, explored more broadly in solution spaces, and engaged less in greedy optimization for reaching local optima. Similarly, Kang et al.[Kan17a]analyzed problem-solving through applying sequential data mining in a problem-solving simulation game. This work identified stages of problem-solving, and that high-performing students used in-game tools more strategically to break complex prob-lems into sub-goals. These examples show that game learning analytics could contribute to our general understanding of learning. Because ST Math is a curriculum-integrated game, applying game learning analytics on ST Math would yield valuable insights that improve the learning and teaching of standardized math content.
Additionally, game learning analytics has often been combined with Machine Learning to track and support learning in real time. One of the earliest works by Conati and Zhao[CZ04], and a more recent work by Davoodi and Conati[DC13]used dynamic Bayesian networks to connect students’ gameplay behaviors with the probabilities of mastering target skills. Through real-time knowledge tracing, this work provided customized in-game hints. Some resulting hints were found to be significantly correlated with learning gain. Min et al.[Min17]applied long short-term memory neural networks to a science simulation game. This work predicted students’ competency levels through students’ in-game actions and external pre-learning measurements. Rowe et al.[Row17] used data-mined learning strategy detectors and automated coding of interaction networks to measure implicit learning in a physics game, showing that in-game measures of implicit learning significantly improved the prediction of post-test scores. However, many of these methods were designed for specific game environments, and focus more on automation than interpretability. ST Math data contain much simpler gameplay interactions, with my goal being understanding of game use and providing actionable feedback.
2.4
Educational Games in the Classroom
One primary goal of my thesis is to suggest practical, actionable feedback to support the use of ST Math in authentic classrooms. To do so, it is necessary to understand the classroom uses of ST Math and consider ST Math from the practitioner’s perspective.
play; 3)playing: tutoring students’ gameplay; 4)elaborating: leading discussion and reflection after gameplay; and 5)reflecting: teacher’s self-reflection process to develop teaching practices.
A limited number of studies have investigated contextual practices surrounding the use of specific educational digital games in classrooms. In a case study of one teacher, Watson et al. identi-fied three key teacher strategies: learning by playing the game; setting student goals for gameplay and encouraging reflection; and identifying teachable moments during gameplay[Wat11]. From three teacher case-studies, Eastwood and Sadler found that teachers viewed and used curriculum-integrated materials differently, demonstrating the importance of flexible and adaptive design[ES13]. Nanavati et al. found that games caused some shifts of authority from teachers to students, and identified disconnects between how games were intended to be used and how they were used in context[Nan18]. Callaghan et al. interviewed and surveyed ST Math teachers and reported that they needed most help with 1) assisting struggling students 2) being aware of the game’s purpose and the underlying mathematics in later game levels, and 3) better aligning games with curriculum[Cal18].
Controlled experiments have suggested that digital games are more effective when combined with structured classroom activities, such as debriefing and bridging. In a longitudinal study, Bakker et al. found that playing at home with debriefing at school was the most effective, followed by integrating games into lessons at school, as compared to playing only at home and having no game at all[Bak15]. Similarly, Rowe et al. found students learned better from a game when teacher bridged game-based learning to classroom learning using game examples and discussion[Row17]. In a study of games and student choice in classrooms, Barendregt and Bekker found that having teachers provide students with choices from a small sample of activities promoted higher student interest than students’ free choice, or teachers rigidly defining activities[BB11]. However, all of these studies of digital games focused on evaluating pre-designed conditions instead of understanding authentic classroom and teacher practices.
These studies have shown that teachers can use varied practices used to make game-based learning work. In Chapter 6, we build on and extend this previous work to explore the use of a single game (ST Math) across several contexts. We provide rich information about the teachers and their classrooms through an integrated grounded theory approach, combining field observations with semi-structured interviews, discussing our findings from a game-design perspective.
2.5
Summary
To summarize, prior literature has shown that:
• ST Math is representative of the contemporary trends in math educational games. Studying ST Math can yield pioneering insights for the design and use of math games for learning.
short as games grow in size and in their intended time of usage. Applying game learning analytics can penetrate the black box between pre- and post-tests and significantly improve our understanding of game design and learning, which will be extremely beneficial to the math domain.
• Advances in Educational Data Mining and Learning Analytics have opened opportunities to take game learning analytics to a higher level. Designing such data-driven methods would inform the design and use of educational games to maximize learning outcomes in an efficient fashion.
• Teachers face difficulties integrating educational games effectively with classroom teach-ing. Combining data-driven insights and qualitative research could inform game design to maximize the practical impact of educational games in classroom settings.
CHAPTER
3
STUDY 1: IS STUDENT-INITIATED GAME
REPLAY WORTH THE EFFORT?
Liu, Z., Cody, C., Barnes, T., Lynch, C., and Rutherford, T. (2017). The antecedents of and associations with elective replay in an educational game: is replay worth it. In Proceedings of the 10th International Conference on Educational Data Mining (EDM). Full Paper.[Liu17]
3.1
Introduction
This work analyzed gameplay logs from a series of math games within the year-long supplemental digital mathematics curriculum Spatial Temporal (ST) Math. We analyzed gameplay data from 4,827 3rd-5th graders throughout the 2012-2013 school year. Our data contained 37,452 logged elective replays, accounting for 1.48% of the logged play. We analyzed gameplay and elective replay features in association with students’ demographic information, in-game math objective tests, and the state standardized math test. We sought to answer three research questions: Q1: What are the characteristics of students who engage in elective replay, Q2: What gets replayed, and under what circumstances? And Q3: Is elective replay associated with improvements in students’ accuracy on math objectives, confidence, and general math ability?
3.2
Background
“Replayability is an important component of successful games.”[Pre05]In most games, there are two types of plays: play and replay to pass a level (pass attempts) and replay after passing a level (elective replay). In this study, we investigate the latter. Elective replay (ER) is particularly interesting because the motivations behind a student’s decision to replay and the impact of those replays are relatively unknown. We explores potential associations between elective replay and student characteristics and performance in the domain of educational games.
Replayability has been touted as a benefit of educational games[Gee07]. Replayability encour-ages players to engage in repeated judgement-behavior-feedback loops, where users make decisions based on the situation and/or feedback, act on those decisions, and receive feedback based on their actions[Tho04]. In the RETAIN model designed by Gunter et al.[Gun08]to evaluate educational games, replayability is a criteria for naturalization â ˘AˇT an important component in helping students make their knowledge automatic, reducing the cognitive load of low-level details to allow for higher order thinking. In the RETAIN model, “replay is encouraged to assist in retention and to remediate shortcomings.”[Gun08]Meaningful elective replay is often encouraged by game features such as score leaderboards, which inspire students to replay for higher scores[Boy11]. Because higher scores typically require a deeper understanding of the educational content in a well-designed game, encouraging elective replay may promote mastery. Games with replay also allow the student to be exposed to more material and give them more freedom to control their learning. Studies have shown that giving students control over their learning process can increase motivation, engagement, and performance[Cal05; CL96].
leaderboard that shows each student’s rank based upon their score, a tool for creating custom puzzles, and a social system for messaging among players. The experimental design required students to play the game in one session, and to replay the game as more features were added in the subsequent sessions. The study found a sharp increase in test scores as these features were added to the game. The authors concluded that features designed to increase replayability can increase learning gains. However, this result may be due to increased time on task as the same group replayed the base game with new features. In another study, Clark et al.[Cla11]analyzed logged student-initiated elective replay in a digital game. They found that frequency of elective replay did not correlate with learning gains, prior gaming habits/experience, or how much students liked the game. They also found that, although there was no statistically significant difference between the male and female students, males replayed more than the females. This may have been responsible for their slightly higher, although not statistically significant, “best level scores”–the highest score received on each level.
However, more research is needed to understand the potential educational impact of replay in educational games, particularly elective replays initiated solely by the players. One reason for the lack of such research is that educational game studies are often comparatively brief, so replayability is often minimally assessed with post-game questionnaires asking about students’ intention for future play[Pla13; Bur15]. Consequently, there is a need to investigate elective replay with actual logged actions in a game setting where students have sufficient time and freedom to replay.
3.3
Methods
3.3.1 Data & Features
MIND Research Institute (MIND), the developers of ST-Math, collected and provided to the re-searchers gameplay data from 4,827 3rd-5th graders during the school year 2012-2013. These stu-dents came from 17 schools and 221 classrooms. Their demographics information is displayed in Table 1.2.
This gameplay data includes pre- and post-tests for each objective and the number of level attempts. For each pre- and post-test, ST Math logged students’ accuracy and self-reported confi-dence level (1 for ’high’ and 0 for ’low) for each question. For each play at a level, ST Math logged the student’s ID, timestamp, and the number of puzzles completed. From these data, we identified ER as plays made after a student initially passed the level. We found ERs in 89.6% of all objectives in ST Math, accounting for 1.48% of all level attempts. Among 4,827 students, 59.85% ERed at least one level, with an average of 7.84 levels (SD=12.99, 95% CI[7.37, 8.32]) across 3.06 average objectives replayed per student.
observation. We calculated the features by averaging all gameplay for a specific student at a specific level. For objective granularity, each unique student-objective combination was treated as a single observation. Features were created by averaging across all levels played by a specific student within a single objective. The objective granularity also included the objective pre- and post-test accuracy and confidence. For the student granularity, we treated each student as a single observation. We calculated the features by averaging across all objectives played by a student over the entire year. The student granularity also included student demographic data and state standardized math test scores. These granularities ensured that our analysis did not favor units with the majority of data logs. Each student was considered equally in our analysis, regardless of how many objectives they played. Our data contained 4,827 students and 2,524,681 plays, which yielded 1,462,660 student-level observations, and 74,985 student-objective observations.
Table 3.1 shows five example plays of “Division-Level3,” including four pass attempts and one ER of this level, interspersed with ERs from other levels. We consider consecutive ERs as an ER Session, as these ERs are circumstanced on the same pass attempts.
Table 3.1Example of Elective Replay and Pass Attempts.
Play Objective-Level Passed? Play Type 1 Division- Level3 No Pass Attempt 2 Division- Level3 No Pass Attempt 3 Division-Level1 Yes ER (ER Session1) 4 Division- Level3 No Pass Attempt 5 Division-Level1 Yes ER (ER Session2) 6 Division- Level3 Yes Pass Attempt 7 Division- Level3 Yes ER (ER Session3) 8 Subtraction-Level1 No ER (ER Session3)
3.3.2 Pass Attempt Features
3.3.3 Elective Replay Features
Table 3.2 shows ER features that describe ER from three angles: (I) the frequencies of ER, (II) the performance of ER, and (III) the circumstances of ER in terms of the ER’s prior plays. To summarize, the majority of ERs had higher performance than their levels’ first attempt, and resulted in another pass of their levels. Levels that were ERed had similar performance compared to levels that weren’t ERed, but levels that were followed(54.65%) or interrupted (54.35%) by ER had much lower perfor-mance than those that weren’t followed or interrupted by ER. Among all ERs, most ERs’ immediately prior pass attempts were from different levels or objectives. There were few instances (9.80%) where students passed a level and immediately ERed it following the pass.
3.3.4 Student Grouping from ER Features
We created student groups to encapsulate the circumstances under which ER occurred, based on students’ majority ER and ER sessions. Based on prior literature, we hypothesized that ER is a habitual behavior that arises from individual needs, such as gaining higher scores[Bar96], avoiding progress on the current task[Mos02], or taking a mental break from negative emotions[Sab13]. Thus, grouping students based upon the circumstances of replay based on their majority behaviors provides high level profiles to investigate characteristics of students who engaged in ER and benefited from ER.
We characterized ER by the timing relative to the student’s current learning objectives and gameplay. The first grouping describes whether the majority ER sessions started before (Group B) or after (Group A) passing the previous attempted level (current learning objective). If there is a tie between the two types of replay session, the student belongs to neither group. For example, Table 3.1 describes a group B student, who has two replay sessions before passing “Division-level3,” and one replay session after passing this level but before moving on to the next level.
Table 3.2Elective Replay (ER) Features and Their Descriptive Statistics Among Students who Electively Replayed, Collapsed to the Student Granularity.
ER Features Descriptive Stats
I. Frequencies of ER
% ER out of all plays M=2.40%, SD=4.26%
% Objectives that have been electively replayed M=22.94%, SD=20.89% % Objectives whose pass attempts were
inter-rupted/followed by ER
M=19.48%, SD=17.57%
II. Performance of ER
Performance of ER M=0.71, SD=0.28
% ERs performed better than the level’s first attempt M=71.96%, SD=31.44% % ERs that result in another pass of the level M=60.36%, SD=35.51% III. Circumstances of ER
The Replayed Levele.g., “Division-lvl1," “Division-lvl3," and “Subtraction-lvl1" in Table 3.1 Pass Attempts Features M=0.79, 1.98, 0.87 for 1st performance,
#pass attempts, and avg performance The Immediately-Prior play of the ERe.g., Play 2 is the immediately-prior play of play 3 in Table 3.1
Performance on the immediately-prior play M=0.63, SD=0.29 % ERs whose immediately-prior plays is also an ER M=0.31, SD=0.28 % ER whose immediately-prior pass attempt is on the
same level
M=9.80%, SD=23.84%
% ... on a different level in the same objective M=40.75%, SD=39.09% % ... on a different objective M=49.44%, SD=40.76%
The Immediately-Prior Pass Attempts followed or interrupted by ER and ER Sessione.g., “Division-lvl3" for all ER Sessions in Table 3.1
Pass Attempts Features M=0.51, 3.62, 0.55 for 1st performance, #pass attempts, and avg performance % ER sessions whose prior pass attempt passed the
level
M=45.65%, SD=40.69%
Note.statistics are reported at the student granularity, which are calculated through averaging across all objectives played by a student, and then averaged across all students who electively replayed. This means each student contributes equally to the average, regardless of how many objectives s/he played.
3.4
Results & Discussion
3.4.1 Who Engaged in Elective Replay?
peers (ELL: 62.3%, non-ELL: 57.1%, c2(1, N=4827)=12.69, p<.001 ), as did students with reported disabilities (disability: 68.7%, non disability: 59.1%, c2(1, N=4827)=18.17, p<.001). There were no statistically significant differences in the frequencies of ER based on race when operationalized as Hispanic/non Hispanic, or based on free/reduced lunch eligibility. The frequency of ER was not found to be correlated with other out-of-game student factors, such as state standardized math test scores.
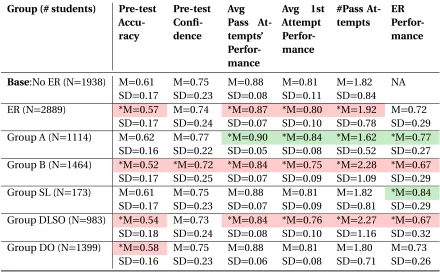
The frequency of ER was also not correlated with in-game pre-test accuracy and confidence at the objective granularity. Next, we investigated the gameplay characteristics of students who electively replayed. We first separated students into groups based on their replay patterns. The first 5 columns of Table 3.3 shows the results of Mann-Whitney U tests with Benjamini-Hochberg correction to compare each group in-game performance to the students who never electively replayed any levels (the Base group). The last column compares the averaged ER performance of each group to the rest of students who electively replayed.
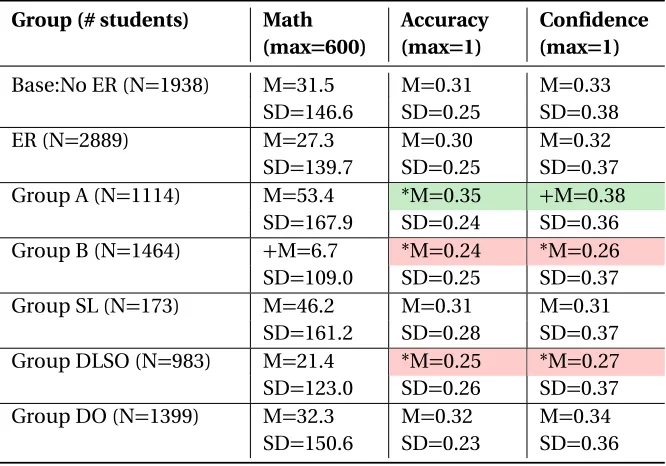
Table 3.3Mann-Whitney U Tests Comparing Gameplay Characteristics Between Student Groups of Differ-ent Elective Replay Patterns.
Group (# students) Pre-test Accu-racy Pre-test Confi-dence Avg Pass At-tempts’ Perfor-mance Avg 1st Attempt Perfor-mance #Pass At-tempts ER Perfor-mance
Base:No ER (N=1938) M=0.61 M=0.75 M=0.88 M=0.81 M=1.82 NA SD=0.17 SD=0.23 SD=0.08 SD=0.11 SD=0.84
ER (N=2889) *M=0.57 M=0.74 *M=0.87 *M=0.80 *M=1.92 M=0.72 SD=0.17 SD=0.24 SD=0.07 SD=0.10 SD=0.78 SD=0.29 Group A (N=1114) M=0.62 M=0.77 *M=0.90 *M=0.84 *M=1.62 *M=0.77 SD=0.16 SD=0.22 SD=0.05 SD=0.08 SD=0.52 SD=0.27 Group B (N=1464) *M=0.52 *M=0.72 *M=0.84 *M=0.75 *M=2.28 *M=0.67 SD=0.17 SD=0.25 SD=0.07 SD=0.09 SD=1.09 SD=0.29 Group SL (N=173) M=0.61 M=0.75 M=0.88 M=0.81 M=1.82 *M=0.84 SD=0.17 SD=0.23 SD=0.07 SD=0.09 SD=0.81 SD=0.29 Group DLSO (N=983) *M=0.54 M=0.73 *M=0.84 *M=0.76 *M=2.27 *M=0.67 SD=0.18 SD=0.24 SD=0.08 SD=0.10 SD=1.16 SD=0.32 Group DO (N=1399) *M=0.58 M=0.75 M=0.88 M=0.81 M=1.80 M=0.73
SD=0.16 SD=0.23 SD=0.06 SD=0.08 SD=0.71 SD=0.26
Compared to the base group, students for whom most replays happened before passing the prior non-replay level (Group B) and students for whom most replays followed a different level on the same objective (Group DLSO) started with significantly lower pre-test scores and did worse in gameplay, as measured by the three pass attempt features described in section 3.3.2. For example, students in Group B started with lower accuracy and confidence at pre-test, took an average 0.5 more attempts to pass a level, and had lower performance on the 1st pass attempt and all pass attempts (including the 1st). It seems that Group B students who replayed earlier levels before passing the current one had less prior knowledge and struggled more in the game. By contrast, students in Group A, for whom most replay happened after passing the current level, did slightly better in gameplay compared to students who never electively replayed (the Base group). Because these students started with pre-test scores that were not statistically significantly different from the base group, their replay patterns are associated with higher gameplay performance.
3.4.2 What Gets Replayed, and When?
Next, we studied what levels get replayed, and under what circumstances. We used a decision tree classifier which allowed us to identify which factors are most important in relation to ER. Our goal was not to find precise predictive models, but to augment our understanding of performance and its relationship to ER. We used R’s rpart package with parameters minsplit=5% and cp=0.02 to build trees to classify levels that were replayed from levels that were not replayed, and levels whose pass attempts were interrupted or followed by replay from levels that were not interrupted or followed by replay. We randomly undersampled the majority class (levels without replay, levels not interrupted or followed by replay), so that each class represented half of the observations. We used pass attempt features at the level granularity together with pre-test results, objective, and demographic information to build our tree. We used 10-fold cross validation to access the accuracy of the learned trees.
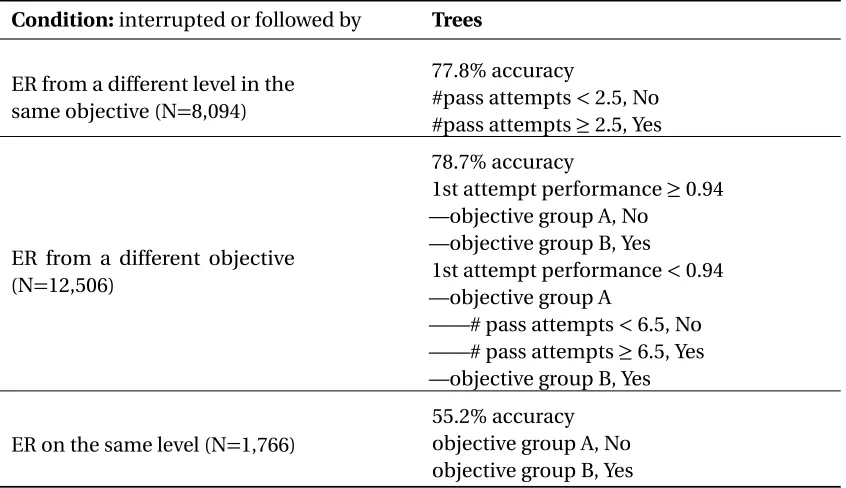
Table 3.4 reports the derived decision trees and the importance of the features. We found that a student’s performance on a particular level influenced whether replay happened during/after the level’s pass attempts. For example, a student was more likely to replay a different level under the same objective (DLSO) if they took more than two attempts to pass the current level. This result is related to the previous result in Table 3.3, showing that, at the student level, those with lower gameplay performance were more likely to replay another level under the same objective.
Table 3.4Decision Trees to Predict Levels whose Pass Attempts were Interrupted or Followed by Elective Replay.
Condition:interrupted or followed by Trees
ER from a different level in the same objective (N=8,094)
77.8% accuracy
#pass attempts<2.5, No #pass attempts≥2.5, Yes
ER from a different objective (N=12,506)
78.7% accuracy
1st attempt performance≥0.94 —objective group A, No
—objective group B, Yes
1st attempt performance<0.94 —objective group A
——# pass attempts<6.5, No ——# pass attempts≥6.5, Yes —objective group B, Yes
ER on the same level (N=1,766)
55.2% accuracy objective group A, No objective group B, Yes
Note.Trees are presented in text format. For example, the first tree shows that if a student passed a level with less than 2.5 pass attempts, the tree predicts this student will not replay another level during/after this level.
either the content or timing of the objectives. In our tree node, we noticed that many objectives with a higher chance of ER occurred earlier in the curriculum, this could be because students had more time in which these objectives were available for ER. Our tree model also had only 55.2% accuracy when predicting whether a level would be ERed following the pass attempts of itself. One explanation is that we do not have puzzle granularity data on how many lives a student actually lost. From prior literature[Boy11] [Cla11], students may replay the same level following it pass attempts to get a better score, which means losing fewer lives (making fewer errors) at a level. As shown in Table 3.3, Group SL students who performed most of their ERs after the same level also achieved the highest ER performance.
3.4.3 Is Elective Replay Associated with Gains?
post-tests. We averaged these scores across the pre- and post-test questions to compute the first two gain scores. These were assessed at the objective granularity. Math gain was calculated based upon the difference between the students’ state standardized math test scores in years 2012 and 2013. This was assessed at the student granularity.
Table 3.5% of Data Observations with Gains, No Gains, and Percentage Dropped for the Three Gain Types.
Gain Types ER? Gained Dropped No Gain
Accuracy (N=75,083) ER 48.10% 8.60% 37.90%
No ER 43.70% 6.10% 36.60%
Confidence (N=75,083) ER 28.30% 42.60% 23.70% No ER 26.40% 37.40% 22.70% Math Test (N=4,827) ER 41.60% 0.40% 46.90%
No ER 40.80% 0.50% 45.70%
Note.1) Observations in the ’Dropped’ column (pre- and post-tests were both 0 or 1) were excluded from analysis. 2) Accuracy and Confidence Gains were mea-sured at objective granularity, Math gain was meamea-sured at student granularity. 3)ER and no ER were collapsed across level.
11.8% of the students were excluded from the math gain analysis due to missing state math test records. These excluded students performed statistically significantly worse in the game as measured by the three pass attempt features; this implies that we excluded weaker students. 8.5% of the objective observations were excluded from the accuracy and confidence gain analysis due to missing pre- or post-tests. These excluded observations were not statistically significantly different from the rest as measured by pass attempt features. The accuracy and confidence gains were significantly correlated (r=0.37, p<0.001), but these two gains were not strongly correlated with math gain scores at the student granularity (r<0.1, p<0.001). Table 3.5 reports the percentage of data points that gained, dropped (mainly for avoiding ceiling effect in this data), and did not gain for each type of gain based on the Marx and Cummings Normalization method[MC07].
We first constructed decision trees to partition our data to see which factors influence gains, using the method described in the prior section. No sampling was necessary because the groups had similar sizes. We used pass attempt features, ER features, pre-test results, and demographics. For student granularity, we also added the percentage of required objectives attempted by the student.
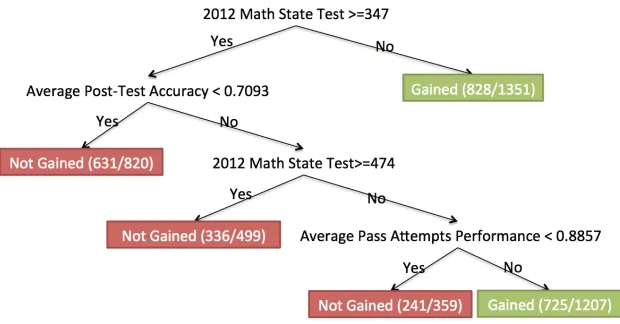
Figure 3.1Decision Tree to Predict Whether a Student will Gain in State Standardized Math Test.
only a 25.9% chance. Students with high pre-test confidence (≤0.95, indicated confidence on almost all questions) had a 62.5% chance of positive confidence gain in the same objective. It could be that these in-game tests were too easy, as 18.9% of pretests showed full scores in accuracy and 54.5% showed full scores in confidence.
Our decision tree for the student granularity is shown in Figure 3.1, with a cross-validated accuracy of 57.8%. Students who started with medium level of math abilities (2012 state test math scores<474, and≥347) improved their scores when they performed well in ST Math (average pass attempts performance>0.8857). This shows that the gameplay data in ST Math has predictive power for assessment outside of the game. However, for all three gain scores, the ER features were not selected for inclusion in the decision tree nor was any correlation found with the students gains.
Finally, we investigated how ER patterns relate to gains. Table 3.6 reports the result from sep-arating students into 6 groups based on ER patterns and conducting Mann-Whitney U tests with Benjamini-Hochberg correction (as in the previous section). Moreover, although decision trees constructed from the complete dataset show that low pre-test results led to more gains, some ER pattern groups showed opposite trends. For example, Group B, who primarily ERed before passing the current level, started with lower pre-test scores, did worse in the game, and had fewer gains that were statistically significant, in all three gain measures. The same applies to Group DLSO. These two groups of students also had the lowest ER performance.