ISSN (Online) : 2319 - 8753
ISSN (Print) : 2347 - 6710
I
nternationalJ
ournal ofI
nnovativeR
esearch inS
cience,E
ngineering andT
echnologyAn ISO 3297: 2007 Certified Organization, Volume 2, Special Issue 1, December 2013
Proceedings of International Conference on Energy and Environment-2013 (ICEE 2013)
On 12th to 14th December Organized by
Department of Civil Engineering and Mechanical Engineering of Rajiv Gandhi Institute of Technology, Kottayam, Kerala, India
LAYOUT PLANNING FOR SUSTAINABLE
DEVELOPMENT
Gia Elizabeth Abraham , R.Sasikumar
4th Semester M.Tech in Industrial Engineering& Management, Department of Mechanical Engineering, Rajiv Gandhi Institute of Technology, Kottayam, Kerala, India
Professor, Dept. of Mechanical Engineering, Rajiv Gandhi Institute of Technology, Kottayam, Kerala, India
ABSTRACT
This paper focuses on the modification of the existing layout of a rubberised coir mattress factory using two different approaches viz graph theory and Computerised Relative Allocation of Facilities Technique (CRAFT). The results of the two approaches are compared in terms of the comparative parameters; total distance between departments, total distance travelled per day and material handling cost reduction. It has been found that the Computerised Relative Allocation of Facilities Technique (CRAFT) modified layout could yield highest reduction in all the three comparative parameters. The total distance between departments reduces by 4.5%, total distance travelled per day reduces by 2.4% and the material handling cost reduces by 2.4%.
Keywords: Facility Layout Planning, Facility re-layout, Graph Theory, Computerised Relative Allocation of Facilities Technique (CRAFT).
TABLE OF ABBREVIATIONS
CRAFT Computerised Relative Allocation of Facilities Technique SLP Systematic Layout Planning
MH Material handling REL Relationship
1. INTRODUCTION
everything needed for production of goods or delivery of services. It may be a machine tool, a work centre, a manufacturing cell, a machine shop, a department, a warehouse, etc. [12]. The layout design generally depends on the products variety and the production volumes.
Layout planning is determining the best physical arrangement of resources within a facility. Layout decisions entail determining the placement of departments, work groups within the departments, workstations, machines, and stock-holding points within a production facility [12]. Facility resource arrangement can significantly affect productivity. Plant layout planning includes decisions regarding the physical allocation of the economic activity centres in a facility, where an economic activity centre is any
entity occupying space. To carry out an appropriate plant layout, it’s important to take into account the
business strategic and tactical objectives.
Most layouts are designed properly for the initial conditions of the business, although as long as the company grows and has to be adapted to internal and external changes, a re-layout is necessary. The reasons for a re-layout are based on 3 types of changes namely, changes in production volumes, processes and technology and product [12]. The frequency of the re-layout will depend on the requirements of the process
In this paper an attempt is made to modify the existing layout of a rubberised coir mattress industry inorder to solve the existing problems related to the material movement in the company. It has been found that congestion of materials, unscientific stacking of materials, improper material handling and need for more storage area are affecting the entire production process. The paper discusses the two different approaches that have been used to find a solution which can reduce the material handling cost, total distance travelled per day to the maximum possible extent and also to provide a smooth material movement.
2.LITERATURE REVIEW
The Facility Layout Problem (FLP) is defined as the physical arrangement of the specified departments or machines in a pre-defined area. CRAFT method could be used in case of multi floor facility problems [2]. CRAFT combined with Group Technology (GT) layout with Rank Order Clustering could be used to re design the layout. The performance evaluation of the current and the re designed layout has been done by using ARENA [1]. A comparative analysis of various approaches to find the best layout for a furniture production firm and has found that BLOCPLAN using automated search has given the best result [11]. An illustrative case study on the modification of a plant layout model using CRAFT method has been done and the visualization of the effects of changes introduced has been provided using the ARENA software [9]. A study on the cellular layout, cellular manufacturing system has been done and a case study has also been done to illustrate the benefits of cellular layouts [4]. The travel chart technique could be used to minimize wastes of time, manpower and money and to generate higher profits for the same work from the same resources [6]. Systematic Layout Planning (SLP) procedure has been used to modify the layout of a compressor manufacturing firm to improve the productivity of the firm [7]. An extension of the CRAFT algorithm that aimed to solve complex layout problems has been developed and the results were compared with that obtained from literature [3].
case study.
3. PROBLEM IDENTIFICATION AND RELEVANCE OF THE STUDY
The company under study is concentrating on the rubberised coir mattress production with an annual installed capacity of 6000 tonnes, around 4.8 lakh units (an ISO 9001:2008 certified company having strict quality standards and also exports products to many countries). The company has to store sufficient amount of raw materials, work in process and finished products. The company has been facing problems that hinder the smooth material flow and it has also been observed that there is a lack of scientific layout planning.
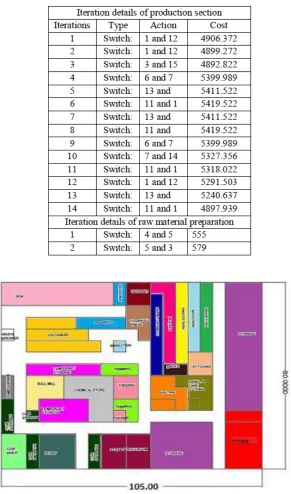
The study is intended to analyse the exiting situation of the factory, to identify the major problems existing in the factory and finally to develop an alternative that could solve the identified problems. The existing layout of the factory has been drawn using AUTOCAD based on the primary data collected from the factory and is given in the Figure 1.
FIGURE 1. EXISTING LAYOUT OF THE FACTORY
The building has a dimension of 105m x 80 m and the various departments are located within the building. The building is divided into two sections namely production plant and the furnishing department. The bare mattress produced in the plant is carried over to the furnishing area for the upholstery works and is finally dispatched out. The study has been conducted on the basis of the assumption that there is a constant demand for the products and the production is carried out to meet the daily target of 800 finished mattresses.
The material handling audit check sheet, interviews with concerned staff and secondary data from the production unit have been used to identify the major issues. It includes the congestion due to low space availability near machines such as Hydraulic press, Vulcaniser, Band saw, 1st Inspection table, chances for easy spreading of fire, unscientific stacking, difficulty to move the bare mattress from production to furnishing on First In First Out (FIFO) basis, need for more warehousing space for furnished mattress and inappropriateness of closeness between departments. Even though there is sufficient space in the building to incorporate all the departments, the improper positioning the departments with respect to the production flow makes the flow of materials complicated.
4. DATA COLLECTION AND SELECTION OF TOOLS
constitutes the secondary data group. The various tools used for layout modification have been identified based on the literature review, from which the Graph theory and CRAFT are found to be the most appropriate and relevant in the particular case.
There are different parameters available to measure the effectiveness of the results obtained. Distances, flows between departments, production time, labour cost, productivity, line balancing efficiency are few among them. The selection of the comparative parameters depends on the uniqueness of the problems that exists in the company. The total distance between departments, total distance travelled per day and the material handling (MH) cost have been selected in this case.
The total distance between departments is taken as the sum of distance between departments. Similarly the total distance travelled per day is the product of distance between 2 departments and the flow between them. The flow may be defined as the number of trips per day. The material handling cost data is not directly available from the company. So the MH cost has been found by taking certain assumptions based on the benchmark data available. The assumption taken is that material handling cost is about 20-30 % of manufacturing cost. In this particular case the average value is taken, i.e. 25% of the manufacturing cost. In this we are using the notations like Total Material Handling Cost (TMHC), Unit Material Handling Cost (UMHC), Material Handling Cost (MHC), Total distance travelled by material (Dt), distance (dij), flow (fij) and unit MH cost (cij) between departments i, j respectively.
The unit material handling cost for the present system is found to be, cij= RS.3.37/m.
5. METHODOLOGY
The modification of the existing layout has been attempted by using two different approaches viz qualitative method (Graph Theory) and quantitative method (CRAFT). The three comparative parameters have been selected for comparing the alternatives obtained in each case. The graph theory considers qualitative parameters to define the relationship between activities whereas CRAFT uses quantitative data relating to material flow and distance between departments.
6. LAYOUT MODIFICATION USING GRAPH THEORY
Graph theory is SLP based approach. Graph theory approach considers only direct adjacency requirements.
Graph theoretic approaches also handle the unequal area block plan. It’s a 2 stage process involving generation of graph followed by development of actual layout. The procedure can be summarized as follows:-
1: Construction of Activity Relationship Chart from Precedence diagram
2: Construction of Activity Relationship diagram from Activity Relationship Chart 3: Development of Block Layout from Activity Relationship diagram
4: Development of Modified Plant Layout from Block Layout
The step wise procedure is given in detail below. Step 1: Select a department pair with largest weight
Step 1: Select a department pair with largest weight
Step 4: Continue the Step 3 until all departments are selected Step 5: Construct a block layout from the planar graph.
There are certain limitations for using the graph theory. The adjacency score does not account for distance, nor does it account for distance other than adjacent department, even though size is considered in this method, the specific dimension & the length between adjacent departments are not considered, the final layout is very sensitive to the assignment of weights in the relationship chart are few among them.
According to Muther’s approach, the desirability of locating a given department next to any other
department is rated by one of the following terms: A-Absolutely necessary, E- especially important, I-important, O- ordinary closeness okay, U- unI-important, X- undesirable. The material flow and the activity relationships are integrated to obtain the activity relationship (REL) chart and is used as the primary input. The closeness ratings used are assigned values on the 5 point Likert scale. The ratings are also given numerical weights corresponding to the scale and is calculated by using the equation, numerical weight = 2n, where n indicates the code. The closeness ratings that are used are given in the table 1[12]. There are certain underlying reasons for assigning the closeness rating and they should also be considered along with the ratings. The relevant reasons have been shortlisted from the literature;
the appropriate ones have been selected and is given in the table 2[12]. They are given values, known as code, based on their importance and are also considered for developing the REL chart given in the table 3.
TABLE 1 CLOSENESS RATING Closeness rating Numerical Weights Code
A 16 5
E 8 4
I 4 3
O 2 2
U 0 1
The REL chart is used to develop the relationship diagram given in figure 3 and the final block layout in figure 4 in the subsequent stages to develop the final alternative layout. The numbers used indicate the departments defined in the REL chart.
TABLE 2 REASONS FOR CLOSENESS RATING Code Reason
FIGURE 2. REL CHART- CLOSENESS RATING
FIGURE 3. RELATIONSHIP DIAGRAM
FIGURE 5. BEST ALTERNATIVE USING GRAPH THEORY
The block layout so developed yielded different alternative layouts after integrating the practical limitations existing within the company. The alternatives that have been obtained are evaluated on the basis of the first two selected comparative parameters and the best one is chosen in such a way that it gives the least possible value for the parameter under consideration. The best alternative after evaluation is given in the Figure 5.
The total distance travelled between departments of the existing layout is 730.46m and that of the total distance travelled per day is 95878m. In the case of the best alternative, the total distance travelled between departments is 705m and the total distance travelled per day is 94985.7m. The layout has been chosen as the best alternative since it has lower value than the existing system and is having the lowest value among the available alternatives. It is evident that there is 3.5% provides a user friendly working environment. The add- in button gives an option to design as well as redesign plant layouts. In this each department is divided into different grids which are equal in size. In this case 5m x 5m grid has been chosen for convenience. First of all the basic details regarding size of the company, the number of departments, area requirements, grid size, and flow matrix are given to it whenever corresponding dialog box appears. In this case it is assumed that the material reduction in total distance between departments and 0.1% handling cost is uniform throughout the production reduction in total distance travelled per day for the process. In this case the cost has been taken as 1, since it
modified layout has been assumed to be uniform.
7.LAYOUT MODIFICATION USING CRAFT
CRAFT is a heuristic algorithm that takes load matrix of interdepartmental flow and transaction costs with a representation of a block layout as inputs. The block layout could either be an existing layout or, for a new facility, any arbitrary initial layout. CRAFT algorithm is the most widely known algorithm which is developed for situations in which materials handling costs is a major consideration.
decrease) is stored. The algorithm proceeds this way through all possible combinations of swaps accommodated. The basic procedure is repeated a number of times resulting in a more efficient block layout every time till such no further cost reduction is possible. The final block layout is reported as output layout.
The algorithm can be summarized as follows:
Step 1. For any layout describe it in blocks. Then determine centroids of each department. From that calculate the cost = distance (from distance matrix) x unit cost. The distance can be Euclidian or Rectilinear.
Step 2. To make improvements, make pair wise or three way exchanges which have equal area only and are adjacent (generally).
Step 3. If better solution exists; Choose the best, or else go to step 1and continue the steps or otherwise stop.
The modification of the existing layout using CRAFT is done by using an add-in for Microsoft Excel developed by Jensen & Co. It provides a comfortable platform to work since it is easy to work and it also In the next stage facility is defined. Here traditional CRAFT is used. The existing layout is drawn in the next stage. All the departments that have been specified in the first stage are automatically displayed with suitable colour codes and numbers in a column in this stage. Drag and paste the colour codes in their positions in the company outline that is automatically generated by receiving inputs in the first stage. The existing layout model is created by using this method. The department centroids are automatically updated in the respective columns whenever the layout is completed.
In the next stage there is an option available to evaluate the existing layout. Whenever the pop-up button named evaluate is selected the value of the current layout i.e. the total cost incurred per day for the facility is displayed and it is generated by summing up the value of distance and unit cost for all departments with material flow. The evaluation is done and it shows the value of current layout in terms of total cost incurred per day. Another pop-up button named solve is available which provides option for solving the present layout. On clicking the button, the program automatically checks for solutions by suitable number of iterations. All these iterations are displayed until the best possible solution is obtained. The iteration stops whenever the best result is obtained. There is also an option known as switch which provides manual switching of departments. It can also be selected to cross check if the obtained results are the best available ones. In the final stage, the modified layout has been displayed with the department centroids and its draft.
In this case the plant has been divided into 3 separate sections, since it is impossible to carry out the CRAFT iterations together by incorporating all the parallel activities occurring in the company into a proper sequence. The plant is divided into production, furnishing and the raw material preparation sections. This obtained initial layout is the same as the existing layout described in Figure 1.
Each section is subjected to individual iterations for improvement and the iteration details are given in the table 3. It has been found that the furnishing section hasn’t shown any improvements in the CRAFT method.
in the column titled action and the resultant variation in the cost is given in the final column. TABLE 3. CRAFT ITERATION DETAILS
FIGURE 6. BEST ALTERNATIVE USING CRAFT ALGORITHM
is 4.5% reduction in total distance between departments and 2.4% reduction in total distance travelled per day for the modified layout.
8. RESULTS & DISCUSSION
The modification of the existing layout using graph theory and CRAFT has yielded two different solutions. A comparative analysis of the two alternatives obtained in each case is necessary to decide the best alternative. The best alternative is the one which has the highest reduction in total distance between departments and total distance travelled per day. The solutions obtained using both methods are found to be acceptable, since there is reduction in total distance between departments and the total distance travelled per day. The comparative analysis of the output of both methods is given table 4.
TABLE 4.EVALUATION OF ALTERNATIVES Comparative Existing Graph CRAFT parameter layout Theory output
output
Total distance 730.46 705 697.66 between
departments (m)
Reduction in total 25.46 32.8 distance between
departments.
Total distance 95878 94985.7 93606.4 travelled per day
(m)
Reduction in total 892.3 2271.5 distance travelled
/day
Total MH cost 3,24,000 3,20,556.6 3,16,294.6 per day (Rs.)
Savings in MH 3443.32 7705.33 cost per day
The best solution has shown a reduction of 4.5% in total distance between departments, 2.4% reduction in the total distance travelled per day and 2.4% material handling (MH) cost savings. Considering the results of comparative parameters, the Computerised Relative Allocation of Facilities Technique (CRAFT) modified layout is suggested as the best solution to the problem.
9. CONCLUSION
The modification of the existing layout of a rubberised coir mattress factory using two different approaches has yielded two distinct solutions. The qualitative input method (graph theory) and the quantitative input method (CRAFT) have yielded two alternative layouts. The alternative layouts obtained using each method has satisfied the condition that the value of the comparative parameters must be lower than that of the existing layout. A final comparison between the results obtained in each method showed that the CRAFT modified alternative yielded the best reduction for the parameters under consideration. The comparative result showed that there is reduction of 4.5% and 2.4% in case of total distance between departments and total distance travelled per day respectively. It is also evident that the CRAFT modified layout has maximum MH cost reduction by 2.4%.
The layout modified using CRAFT Algorithm is recommended to be implemented in the company. There is a need of some civil work for the implementation and a low initial investment is necessary for it.
The layout alternatives developed are evaluated using the three selected parameters such as total distance between departments, total distance travelled per day and savings in material handling cost. There are various other comparative parameters to evaluate the alternatives like line balancing efficiency, production time, cycle time reduction etc. They are not considered in this study. The present system is assumed to have a constant demand for the products but in practice there are seasonal
variations in the demand. The study hasn’t yielded an optimum layout. So optimization of the existing
layout incorporating the seasonal variation in demand using the advanced tools like genetic algorithm can be considered as further scope of the study.
REFERENCES
[1] Inproceedings, Winter Simulation Conference, 2004. “Simulation Based Layout Planning of a Production Plant”. In Proceedings of the
2004 Winter Simulation Conference, R .G. Ingalls, M. D. Rossetti, J. S. Smith, and B. A. Peters, eds., Old Dominion University, Altinkilinic Mert., pp.1079-1084.
[2] Bozer Yavuz, A., Meller Russell, D., and Erlebacher Steven, J., 1994. “An Improvement Type Layout Algorithm for Single and Multiple
Floor Facilities”. Management Science, 40(7), July, pp.918-932.
[3] Inproceedings, International Conference on Industrial Engineering and Operations Management, 2012. “An Improved Approach to
Exchange Non-Rectangular Departments in CRAFT Algorithm”, In Proceedings of the 2012 International Conference on Industrial Engineering and Operations Management,, Sabanci University, Esmaeili Aliabadi Danial, and Pourghannad Behrooz, pp.410-416.
[4] Huawei Chen, Aimin Wang, Ruxin Ning, and Canxia Shao, 2011. “Layout Planning Technology of Cellular Manufacturing System
Based on Process Interconnection Analysis”. Chinese Journal Of Mechanical Engineering, 24, pp.1-11.
[5] Matusek Mirosław, “Layout Planning: A Case Study on Engineering-to-order Company”, Carpathian Logistics Congress, November 2012.
[6] Prakash Ram, and Agarwal Ashish, S. N, 2012. “Reduction in Material Handling Cost using Travel Chart Technique”.International Journal
of Engineering Science and Technolgy, 4(6), June, pp. 2662-2669.
[7] Shewale Pramod, P., Manmath Shete, S., and Sane, S. M., 2012. “Improvement in Plant Layout using Systematic Layout Planning (SLP)
for Increased Productivity”. International Journal of Advanced Engineering Research and Studies, 1(3), pp. 259-261.
[8] Singh Mahendra, 2012. “Innovative Practices In Facility Layout Planning”. International Journal of Marketing, Financial Services & Management Research, 1(12), December, pp.126-139.
[9] In Proceedings International MultiConference of Engineers and Computer Scientists, 2009. “Plant Layout Design with Simulation”, In Proceedings of the International MultiConference of Engineers and Computer Scientists, Vol II, Chiang Mai University, Uttapol Smutkupt, Sakapoj Wimonkasame, pp.1-6.
[10] Verma Komel, Upadhyay Ramakant, and Gangawat Sandeep, 2012. “Improving Facility Layout of an Automotive Industry: using Graph
Theory”. Pacific Business Review International, 5(6), December, pp.100-107.
[11] Wilsten Pinto, J., and Shayan, E., 2007. “Layout Design of a Furniture Production Line using Formal Methods”. Journal of Industrial and
Systems Engineering, 1(1), pp 81-96.
[12] James Tompkins, A., John White, A., Yavuz Bozer, A., Tanchoco, J., M., A., 1984. Facilities Planning. 3rd Edition. John Wiley & Sons