INVESTIGATION
The Role of Background Selection in Shaping
Patterns of Molecular Evolution and Variation:
Evidence from Variability on the
Drosophila
X
Chromosome
Brian Charlesworth1
Institute of Evolutionary Biology, School of Biological Sciences, University of Edinburgh, Edinburgh EH9 3JT, United Kingdom
ABSTRACTIn the putatively ancestral population ofDrosophila melanogaster, the ratio of silent DNA sequence diversity forX-linked loci to that for autosomal loci is approximately one, instead of the expected“null”value of 3/4. One possible explanation is that background selection (the hitchhiking effect of deleterious mutations) is more effective on the autosomes than on theXchromosome, because of the lack of crossing over in maleDrosophila. The expected effects of background selection on neutral variability at sites in the middle of anXchromosome or an autosomal arm were calculated for different models of chromosome organization and methods of approximation, using current estimates of the deleterious mutation rate and distributions of the fitness effects of deleterious mutations. The robustness of the results to different distributions offitness effects, dominance coefficients, mutation rates, mapping functions, and chromosome size was investigated. The predicted ratio of X-linked to autosomal variability is relatively insensitive to these variables, except for the mutation rate and map length. Provided that the deleterious mutation rate per genome is sufficiently large, it seems likely that background selection can account for the observed X to autosome ratio of variability in the ancestral population ofD. melanogaster. The fact that this ratio is much less than one inD. pseudoobscurais also consistent with the model’s predictions, since this species has a high rate of crossing over. The results suggest that background selection may play a major role in shaping patterns of molecular evolution and variation.
M
EAN silent site DNA sequence diversities in the puta-tively ancestral East African populations ofDrosophila melanogaster seem to be approximately the same for the X chromosome (X) and autosomes (A) (Andolfatto 2001; Hutteret al.2007; Singhet al. 2007), despite the fact that the“null”expectation for the ratio of the effective popula-tion sizes (Ne) ofXandAis 3/4 for the case of a 1:1 sex ratioand purely random variation in offspring number in both sexes (Wright 1931). There is little evidence for anX vs. A difference in mutation rate at silent sites inDrosophila, after possible differences in the intensity of selection and muta-tional biases on silent sites for X andA are taken into ac-count (Bauer and Aquadro 1997; Hutter et al. 2007; Keightleyet al.2009; Zeng and Charlesworth 2010; Haddrill
et al.2011) (but see Bachtrog 2008). This observation there-fore suggests an equality of Ne values for X and A, since
neutral diversity under the infinite sites model is equal to the product of 4Ne and the neutral mutation rate per site
(Kimura 1971), where Ne is defined as one-half of the
ex-pected coalescent time for a pair of alleles at a given locus (Charlesworth and Charlesworth 2010, p. 217).
This equality of Ne values for X and A could reflect a
highly female-biased sex ratio and/or a very high variance in male reproductive success (Hedrick 2007; Hutter et al. 2007; Ellegren 2009; Vicoso and Charlesworth 2009a), both of which reduce the effective population size of males rela-tive to females. This reduction would have a smaller effect onXthan onA, since theDrosophila Xspends two-thirds of its time in females and only one-third of its time in males, whereas an autosome spends half of its time in each sex. But this difference betweenXandAalso affects the population-effective rate of recombination forX vs. A, which controls the rate of breakdown of linkage disequilibrium. Drosophila males lack recombinational exchange between homologous
Copyright © 2012 by the Genetics Society of America doi: 10.1534/genetics.111.138073
Manuscript received December 23, 2011; accepted for publication February 26, 2012
1Address for correspondence: Institute of Evolutionary Biology, School of Biological
chromosomes (Ashburneret al.2005); the population-effective recombination rate for a given rate of recombinationrin fe-males between two loci is therefore 0.5rforAand 0.667rfor X(Charlesworth and Charlesworth 2010, p. 381). This sug-gests that hitchhiking effects may have less influence on var-iability at typicalX loci compared withAloci, given similar selection intensities for X and A mutations, consistent with the observation that X and A loci with similar population-effective recombination rates appear to have relative levels of silent site variability that are close to the null expectation (Vicoso and Charlesworth 2009b); a contrary effect can be produced by recurrent selective sweeps of partially recessive, positively selected mutations (Aquadroet al.1994; Betancourt et al.2004; Ellegren 2009).
An alternative explanation was proposed by Hutteret al. (2007), who suggested that a recent population expansion in the Zimbabwe population of D. melanogasterhas differ-entially affected X-linked and autosomal variability. How-ever, recent analyses of synonymous site variability in this population have cast doubt on the reality of such an expan-sion, when selection on codon usage is taken into account (Zeng and Charlesworth 2009, 2010). Similarly, the fact that the X/A diversity ratio is close to one for an African D. simulanspopulation, which lacks inversions, suggests that a reduction in autosomal diversity caused by hitchhiking effects of autosomal inversion polymorphisms in D. mela-nogaster (Andolfatto 2001; Singh et al. 2007) cannot be a general explanation for this effect.
The purpose of this article is to investigate whether the process of background selection, the hitchhiking of neutral or nearly neutral variability by linked deleterious mutations (Charlesworthet al.1993; Charlesworth 2012), can account for these apparently equal X and autosomal Ne values or
at least contribute to an X/Aratio that differs substantially from 3/4, as was suggested earlier by Aquadroet al.(1994). To do this, a model of the effect of background selection (BGS) on variability across a large, normally recombining region of a chromosome is needed. A previous investigation of this problem in D. melanogaster by Charlesworth (1996) used phenotypic estimates of the strength of selection against deleterious mutations and the overall mutation rate to delete-rious alleles, which have now been superseded by estimates based on DNA sequence data (Loewe and Charlesworth 2006; Loewe et al. 2006; Haag-Liautardet al. 2007; Keightley and Eyre-Walker 2007; Eyre-Walker and Keightley 2009; Keightley et al.2009; Schneideret al.2011; Wilsonet al.2011). In ad-dition, the study by Charlesworth (1996) assumed that sites subject to purifying selection were spread uniformly along the chromosome, whereas in reality they are clustered into coding sequences and blocks of functional noncoding sequences (Misraet al.2002).
The present study attempts to remedy these deficiencies, with specific reference to the effect of BGS on theX/Aratio of effective population sizes or neutral diversities under the infinites sites model, both of which are proportional to the expected coalescent time for a pair of alleles. Equations 4–9
of Nordborget al.(1996) provide formulas for the effect of BGS on the coalescent time at a given nucleotide site. Com-parisons with the results of computer simulations have shown that these formulas are accurate for the case of a sin-gle chromosome, provided that the strength of selection is sufficiently strong in comparison with the effect of genetic drift that the frequencies of deleterious mutant alleles can be treated as though they are in deterministic equilibrium (Nordborget al.1996). The model developed here takes into account the fact that some noncoding sequences inDrosophila (both intergenic and intronic) are strongly conserved, so that deleterious mutations affecting them probably have similar selective effects to nonsynonymous mutations, whereas an-other large class of noncoding sequences is subject to weaker or no selective constraints (Haddrillet al.2005; Halligan and Keightley 2006; Casillaset al.2007; Sellaet al.2009).
This article is concerned with the effect of BGS over a whole chromosome or chromosome arm. To simplify the analysis, I assume that we are dealing with a site located in the middle of a Drosophila chromosome arm and that re-combination rates per unit physical distance are uniform across the arm. This will somewhat underestimate the over-all effect of BGS on variability in a Drosophilapopulation, since recombination rates are lower at the telomeres and centromeres than in the middle of an arm (Ashburner et al. 2005), but in practice most loci used in resequencing studies inDrosophilacome from regions with high levels of recombination, which constitute the majority of the genome (Charlesworth 1996). In addition, the effect of lower vari-ability in low recombination regions is partly counteracted by the weaker effect of BGS at the ends of a chromosome arm, caused by the lack of adjacent genes compared with the sites in the middle of a chromosome (Nordborget al.1996), so that consideration of the properties of the middle of a chromosome arm should provide a reasonably good pic-ture of the typical level of variability in the presence of BGS inDrosophila, except at the extreme ends of a chromosome or chromosome arm.
Theory and Methods
Model assumptions: types of sequence and their selection coefficients
noncoding sites. For reasons given below, both nonsynony-mous and strongly selected noncoding sequences are as-sumed here to share the same distribution, so thatf1(s)¼
f2(s), although this assumption is easy to relax. Sex
differ-ences in selection coefficients are also ignored in most of the results presented below; again, reasons are given later as to why this is unlikely to be important.
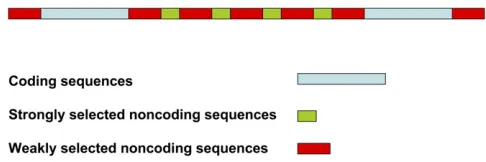
The different classes of sites are organized intongcoding
sequences of lengthlgbp, separated by“intergenic”
sequen-ces, which are divided into ns strongly selected noncoding
sequences of lengthlisandns+ 1 weakly selected
noncod-ing sequences of length liw(see Figure 1). Each coding
se-quence isflanked by weakly selected noncoding sequences, except at the telomere and centromere, where any nongenic DNA beyond the last coding sequences at the ends of the arm is ignored. The total length of noncoding sequence sepa-rating a pair of coding sequences is thusli¼nslis+(ns+ 1)liw.
By increasing the number of coding sequences and decreasing their length accordingly, a chromosome arm with genes that includes long introns, containing a mixture of strongly and weakly selected sites, can easily be modeled. For simplicity, the account below mostly refers to noncoding sequences as intergenic.
The focal neutral site for which the effect of BGS is to be calculated is assumed to be located in the center of the chromosome arm, in the middle of a weakly selected intergenic sequence, so that the distance to the nearest coding sequence is 0.5(li – 1), assuming li to be odd. To
accommodate this assumption, ng and ns are assumed to
be even, andliwis assumed to be odd.
Deleterious mutations involved in BGS effects are assumed to be under such strong selection that they are kept at low frequencies. For nonrecessive autosomal mutations, this means that the equilibrium frequency of a deleterious mutation at a given site in an infinitely large randomly mating population is determined by the ratio of the mutation rate,u, to a deleterious variant at a site and the heterozygous selection coefficient against the deleteri-ous variant, ts (Charlesworth and Charlesworth 2010,
p. 161). In a large finite population, the mean frequency of deleterious mutations over a collection of sites with the same mutation and selection parameters is close to this equilibrium, provided that recombination is sufficiently fre-quent (Nordborget al.1996). With dominance coefficienth and selection coefficientsagainst homozygotes, the effec-tive selection coefficient against the mutation is thusts¼hs (h.0). ForX-linked mutations with equal selection on the two sexes, the corresponding effective selection coefficient is given approximately by ts ¼ (2h + 1)s/3 (Charlesworth and Charlesworth 2010, p. 98); corresponding formulas can be obtained for the case of sex-specific effects onfitness.
Model assumptions: mutation rates
For most of the results presented here, only a single chromo-some arm is considered, on the assumption that the dissipa-tion of the effects of BGS with recombinadissipa-tional distance is
sufficiently strong that sites on one chromosome arm have little effect on another (evidence to support this assumption is presented inResults and Discussion). We define the diploid deleterious mutation rate for thekth class of selected site on a chromosome arm asUk, whereUkis equal to the sum of 2u over all sites subject to purifying selection of this type of site on the chromosome arm in question. The standard numer-ical values for theUkused in most of the calculations below were arrived at in the following way. The net deleterious diploid mutation rate for D. melanogasterwas estimated by Haag-Liautard et al.(2007) to be 1.2 mutations per genera-tion. The corresponding deleterious mutation rate, UD, for a
typical chromosome arm contributing 20% of the euchro-matic genome is equal to 0.24. With an average of 2800 genes per arm and an average total coding sequence length per gene of 1500 bp (Misraet al. 2002), the assumption that 70% of coding sites are nonsynonymous (Loewe and Charlesworth 2007) gives 2.94 Mb of sites capable of generating nonsy-nonymous mutations out of a total of 4.2 Mb coding sequence. In a chromosome arm of 20 Mb, this leaves 15.8 Mb of noncoding sequences. The majority of these are subject to some level of selective constraint (Halligan and Keightley 2006);25% are strongly conserved sequences with an aver-age length of40 bp (Casillaset al.2007).
The remaining 75% of noncoding sequences are here assumed to be under weak purifying selection. In the absence of introns, a total lengthli¼5659 bp of sequence
between a pair of coding sequences is allowed, which is divided into ns =36 strongly selected sequences of length
39 bp andns+ 1¼37 weakly selected noncoding sequences
of length 115 bp, organized as described above (these num-bers are reduced proportionately if ngis increased andlgis
reduced, to allow for long introns separating exons within genes). This gives a total of (ng–1)nsls¼2799·36·39¼
3.93 Mb of strongly selected noncoding sequence and (ng–1)(ns+ 1)lw¼2799·37·115¼11.91 Mb of weakly
selected noncoding sequence. Together with the nonsynon-ymous sites, this gives a total of 18.78 Mb of sequence that is potentially under significant selection [selection on codon usage acting at synonymous sites is ignored here, since it is too weak to have significant BGS effects (Zeng and Charlesworth 2009; Zeng 2010)].
To assess the contributions of these types of sequence to the deleterious mutation rate, we also need estimates of their respective levels of selective constraint, i.e., the frac-tion of mutafrac-tions in each class that are sufficiently deleteri-ous to ensure their elimination from the population (Halligan and Keightley 2006). Table 2 of Casillas et al. (2007) suggests that the divergence per site between D. melanogaster and D. simulans for strongly conserved non-coding sequences is comparable to that for nonsynonymous sites (see Table 1 of Sella et al. 2009), and their fit of a gamma distribution to the distribution of selection coeffi -cients against mutations in these sequences gave a similar value of the shape parameter a to published estimates for nonsynonymous mutations (Keightley and Eyre-Walker 2007; Eyre-Walker and Keightley 2009; Haddrillet al.2010).
There is also evidence that similar values of the fractiona of fixed differences between species caused by positive se-lection apply to strongly selected noncoding and nonsynon-ymous mutations (Casillas et al. 2007; Sella et al. 2009); these need to be removed from estimates of between-species divergence before calculating selective constraint values, which apply only to sites subject to purifying selection. This component of the ratio of divergence at strongly selected sites relative to that for putatively neutral sites is taken here to be equal to 0.078, consistent with the observed ratio of nonsynonymous to synonymous divergence betweenD. mel-anogasterandD. simulansof0.13 and a somewhat conser-vativea-value of 0.6, yielding a constraint value for strongly selected sites ofcs¼0.922, for both class 1 and class 2 sites.
For weakly constrained noncoding sites, a constraint value ofcw¼0.572 is used here, which is slightly higher than the
value indicated by Table 2 of Casillaset al.(2007) and Table 1 of Sellaet al.(2009), to accommodate a small fraction of positively selected mutations. If a shape parameter of the gamma distribution of 0.3 is assumed, consistent with the evidence just mentioned, then mean s values for strongly selected and weakly selected sites that are consistent with these constraint values can be calculated by the method described in the Appendix of Haddrillet al.(2010); assum-ing a dominance coefficient of 0.5, these are found to be s1=s2= 2.5·1023(strongly selected sites) anda3= 0.3,
s3¼8·1026(weakly selected sites), assumingNe¼106.
Let the proportion of strongly selected sites among all sites potentially under significant selection bexs¼xsc+xsn, where
xscandxsnare the proportions of nonsynonymous sites and
strongly selected noncoding sites among potentially selected sites; the proportion of weakly selected sites is xw ¼1– xs.
From the way in whichUDwas estimated (Haag-Liautardet al.
2007), the overall mutation rate for a chromosome arm con-tributed by these sequences is UA= UD/(xscs+xwcw). We
have xsc¼ 2.94/18.78¼ 0.157,xsn ¼3.93/18.78 ¼0.210,
xs¼ 0.367, andxw ¼0.633. Use of these numerical values
givesUA¼0.24/(0.367·0.922 + 0.633·0.572)¼0.343.
We then obtain the following values of the deleterious muta-tion rates for each class:U1¼UAxsccs¼0.050,U2¼UAxsncs¼
0.066, andU3¼UAxwcw¼0.124.
These values need to be reduced by removing mutations that fall below the threshold value for which the formulas for BGS used below are likely to be accurate (Nordborget al. 1996), giving truncated mutation rates ofUTkfor each class
of site. In the numerical results presented below, the distri-butions for both the strongly selected and the weakly se-lected sites were truncated at the lower end at sT ¼ 5 ·
1026, corresponding to an N
es value of 5 in a population
of effective size 106. This procedure will lead to an
under-estimate of the effect of BGS, as the mutations that fall below this threshold will exert some effects, although not as large as predicted by the formulas used below (Zeng and Charlesworth 2011). Using the gamma distribution and the mutation rate parameters described above, the truncated deleterious mutation rates are UT1 ¼ 0.044, UT2 ¼ 0.058,
andUT3¼0.044, giving a total truncated deleterious
muta-tion rateUT¼0.146. The truncated mutation rates for the
nonsynonymous and strongly selected sites are only slightly lower than the untruncated values, whereas 65% of the weakly selected noncoding sites are treated as neutral.
Exact model of BGS
For a focal neutral site, the expected effect of BGS caused by a given type of selected site is parameterized by the ratio of the coalescent time for this site to its “neutral”value in the absence of BGS (Hudson and Kaplan 1994, 1995; Nordborg et al.1996), denoted here byBkfor thekth class of site. For
simplicity, the mutation rate at a site in classkis assumed in the following analyses to be independent ofsfor these sites, but only mutations with an sabove the truncation pointsT
described above are included in the calculations. Because different organizations of sites apply to nonsynonymous, strongly selected noncoding sites and weakly selected non-coding sites, each of these must be considered separately.
For all sites included in a given class k, we have
Bkexp2u Z 1
sT
X
i
tsfkðsÞds ðtsþri½12tsÞ2
; (1)
whereuis the mean haploid mutation rate per base pair, and riis the frequency of recombination between the focal site and the ith site of classk(Nordborget al.1996).
We need to relaterifor each site to the physical distance from the focal site to theith site under selection. Let the total map length in females of the chromosome arm be MM, so that the map distance per base pair isr= M/(nglg+ [ng–1]
li). The simplest mapping function is a linear relation between
map distance and recombination rate. Taking into account the lack of crossing over in maleDrosophila(Ashburneret al. 2005), and averaging recombination rates across the two sexes as explained in the Introduction, this model yields population-effective recombination rates for a distance of d bp between the focal site and a given selected site of rdA¼
0.5rd and rdX ¼ 0.667 rd, for Aand X sites, respectively.
for the occurrence of double crossovers. Here, the“standard” mapping function of Charlesworth (1996) is used, which was shown by Cobbs (1978) to provide a good fit toDrosophila data. The population-effective recombination rates for map distance z are 0.25{1– cos(2z)exp(–2z)} and 0.333{1–cos (2z)exp(–2z)}, for theAand theX, respectively.
Given the values of the parameters described above, and the distribution of s, it is straightforward in principle to evaluateBkfor a givenkby applying numerical integration over fk(s) to the summation in Equation 1. This requires specification of the distances of each selected site from the focal sites, as outlined in the Appendixfor noncoding sites. The summation in Equation 1 proceeds along the chromo-some arm in one direction, starting at the centrally located focal site, and thefinal result is doubled to estimate the sum for the whole arm.
For calculations involving nonsynonymous sites, all third coding positions are treated as neutral to accommodate synonymous sites and are skipped over when summing along a coding sequence. The mutational densityufor these sites isu ¼U1/(1.4nglg), since the total number of
nonsy-nonymous sites on a chromosome arm is 0.7nglg. For
strongly selected noncoding sites, we have u¼U2/(2[ng–
1]nsls). The same distributions ofsare used for
nonsynon-ymous and strongly selected sites in the numerical results shown below. For weakly selected sites,u¼U3/(2[ng–1]
[ns + 1]lw), which is substantially smaller than u for the
strongly selected sites (reflecting the lower level of selective constraint in this case), and different parameters for the distribution ofsare used.
The only difficulty with this procedure is that the large number of nucleotide sites (20 million) on a typical Dro-sophila chromosome arm makes numerical integration over all sites very slow. For this reason, the summation formula over sites was used, averaging the contribution from each site over a grid of 1000 points taken over the range of a trun-cated gamma distribution, with s derived from a single-parameter gamma distribution with shape single-parameter ak and meanskbefore truncation of values ofs,sT(the mean
after truncation is higher). To avoid inaccuracies of numer-ical integration with very smalls, for values ofx,0.001 the analytical formula for the integral ofxak–1was used instead of xak–1exp(–x) in the formula for the gamma distribution (where x¼s ak/sk). Integration over the remainder of the distribution was continued up to a value of x ¼ 10, with constant increments of xon a logarithmic scale. To avoid selection coefficients greater than one, all values withs.1 were reset to 1.
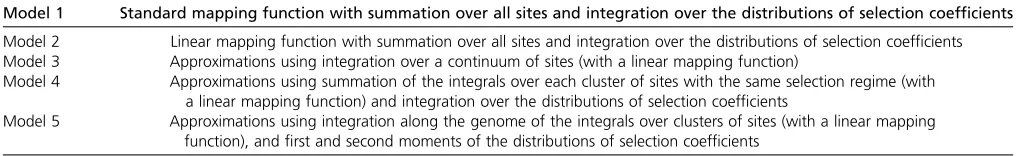
This approach yields the“model 1”results for the case of the standard mapping function and“model 2”results for the case of a linear map. The features of the different types of model are summarized in Table 1.
Approximations
Results can be obtained more rapidly using several different approximations to Equation 1. The simplest is that
intro-duced by Hudson and Kaplan (1994) and Barton (1995), which assumes a linear map of lengthMM in females. Se-lected sites are distributed uniformly along it, with a popu-lation-effective map length for the chromosome arm of Me
(0.5Mand 0.667M, for XandA, respectively), withMe
as-sumed to be much greater than any value oftsdrawn from the distribution. Replacing the summation in Equation 1 by integration along a continuum, these assumptions give Bk exp(–UT/Me) (see Equation 10 of Nordborg et al.
1996), where UT is the sum of the truncated deleterious
mutation ratesUTkover all classesk. This yields the“model
3”results.
An approximation that should in principle be more ac-curate can be obtained as follows, retaining the assumption of a linear map. For nonsynonymous sites, the following pro-cedure is followed. The physical distances from the focal site to the start and end of thejth coding sequence to its right or left areli(j–0.5) +lg(j–1) andli(j–0.5) +lgj,
respec-tively. Using the relations described above, these distances can be translated into population-effective recombination fre-quencies of rj1 and rj2, respectively. Summation along the
length of a coding sequence is replaced by integration, and a deleterious mutational density ofU1/(2·0.7·nglg) per site
is assumed, allowing as before for the fact that an average of 70% of coding sequence mutations are nonsynonymous. Using Equation 9 of Nordborget al.(1996) with some rear-rangement of terms (see Appendix, Equations A1 and A2), for a given value of ts we obtain the following net contri-bution to the negative of the exponent in Equation 1 from thejth pair of coding sequences to the right and left of the focal site
E1jðtsÞ U1ts ng
tsþrj1½12ts
tsþrj2½12ts
: (2)
The assumption that selected sites are uniformly dis-tributed along a coding sequence is of course inaccurate because of the presence of synonymous sites. However, this is likely to cause only a minor error, since the mutational density per nonsynonymous site isU1/(1.4nglg) rather than
U1/(2nglg), and the mean frequency of recombination
be-tween adjacent nonsynonymous sites is 1/(0.7) higher than assumed in this expression, if 30% of sites are neutral. The derivation given in the Appendix shows that these two effects cancel out in thefinal expression.
The overall exponent can then be obtained by integration over the truncated distribution of selection coefficients for nonsynonymous sites and summing over alljfrom 1 tong/2.
This gives
B1exp2
Z 1
sT
X
j
E1jðtsÞf1ðsÞds: (3)
andliwweakly selected sites, respectively (Appendix,
Equa-tions A4 and A10). Together with the results for the non-synonymous sites, the expressions forB2andB3obtained in
this way describe“model 4”.
Apart from model 3, these calculations are all dependent on the properties of the distribution of s. An alternative approximation that avoids using the details of this distribu-tion can be obtained by using the approach used for model 4, but replacing summation over coding sequence or blocks of noncoding sites by integration with respect to a continu-ous variable representing the index of the coding sequence or noncoding block in question. The calculation is further simplified by assuming that the distribution ofsis such that ts,,1 for most sites, so that the terms involving 1–tsin the above expressions can be replaced by 1.
For nonsynonymous sites, use of the above expressions for the distances from the focal site to the start and end of a coding sequence yields the following approximation to the sum over alljofE1j(ts),
E1 ðtsÞ U1ts
ng
Zð1=2Þng
1
· dx
tsþr~
li½x21 = 2 þlg½x21
tsþ~r
li½x21 = 2 þlgx
; (4)
where~r= 0.5rforAand 0.667rforX, andris the gradient of the map distance in female meiosis with respect to the number of base pairs separating a pair of sites.
Elementary integration reduces this expression to
E1ðtsÞ
U1ts ng~r
2 lg
liþlg
ln (
a9þ ð1 = 2Þbng
ðaþbÞ
aþ ð1 = 2Þbng
ða9þbÞ
)
; (5)
wherea¼ts–0.5~rli,a9¼ts–~r(0.5li+lg), andb¼~r(li+lg).
We have (a + b)/(a9 + b) ¼ 1 + ~rlg/(a9 + b) and
(a+ 0.5bng)/(a9+ 0.5bng)¼1 +~rlg/(a9+0.5bng), where
a9+ b¼ts+ 0.5~rlianda9+ 0.5bng¼ts–~r(0.5li+lg) +
0.5~r(li+lg)ngts+ 0.5~r(li+lg)ng. We can reasonably
assume thatli..lg, given the typical length of an intergenic
sequence compared with a coding sequence in Drosophila (Misraet al.2002). The logarithmic expression in Equation 5 can then be well approximated by its leading term ~
rlg{(1/[ts + b]) – (1/[ts + g])}, where b ¼ 0.5~rli and
g¼0.5~r(li+lg)ng.
An approximation to the expectation of E1(ts) over the truncated distribution of s can then be obtained by repre-senting 1/(ts+b) and 1/(ts+g) by their Taylor series in the deviation oftsfrom its mean,dts, and taking the
expec-tation of the resulting expression forE1(ts), ignoring terms of higher order than (dts)2. This yields the approximation
B1exp 2 U1T
ng~rliþlg
· (
1 ðt1þbÞ
"
t12 bV1 ðt1þbÞ2
#
2ðt 1 1þgÞ
"
t12 gV1 ðt1þgÞ2
#)
; (6)
where U1T is the deleterious mutation rate for
nonsynony-mous sites after truncation of the distribution of selection coefficients, andt1 andV1are the mean and variance ofts, respectively, taken over the truncated distribution of s for nonsynonymous sites.
The similar but more complex procedures for noncoding sites are described in theAppendix. Together with the results for nonsynonymous sites, these approximations for the Bk yield the “model 5”results. All these formulas were imple-mented in FORTRAN programs, which are available on request.
Results and Discussion
BGS on the X and A in D. melanogaster
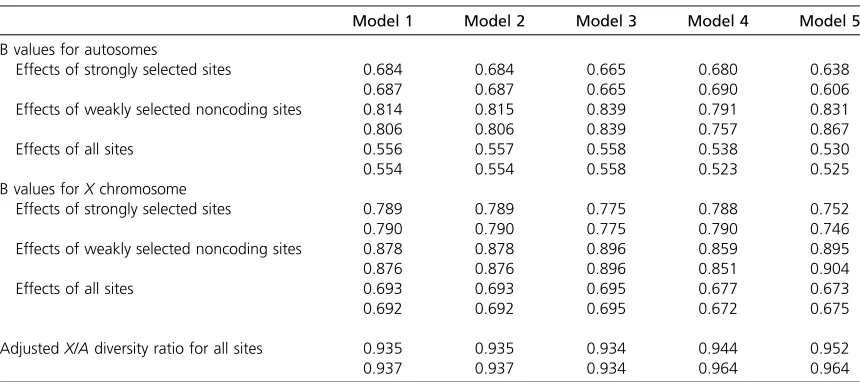
Table 2 shows the results of calculations of the expected coalescent times under background selection relative to neu-tral expectation (B), based on the above formulas and assumptions and using selection and mutation parameters that are probably fairly realistic for the D. melanogaster X chromosome (which is a single arm) and an arm of a major D. melanogasterautosome. The model assumes that a chro-mosome is organized into blocks of coding sequences that are uninterrupted by introns, but are separated by blocks of noncoding sequence containing a mixture of weakly selected and strongly selected sites (Figure 1). Note that the trunca-tion of very weakly selected mutatrunca-tions means that65% of the sites in the weakly selected sequences are treated as neutral, with the standard selection parameters used here. A diploid deleterious mutation rateU¼0.24 for this geno-mic region was assumed, on the basis of the genome-wide estimate of 1.2 from Haag-Liautard et al. (2007), which includes all types of deleterious mutations. The results for both intermediate dominance (h¼0.5) and partial recessivity (h ¼ 0.2) are shown. There is good evidence that many slightly deleterious mutations are partially recessive (h , 0.5) (Crow and Simmons 1983; Garcia-Dorado and Caballero 2000), although very weakly selected mutations, such as most of those generated by the gamma distributions assumed Table 1 Models of background selection with selection on nonsynonymous, weakly selected, and strongly selected noncoding sites
Model 1 Standard mapping function with summation over all sites and integration over the distributions of selection coefficients
Model 2 Linear mapping function with summation over all sites and integration over the distributions of selection coefficients Model 3 Approximations using integration over a continuum of sites (with a linear mapping function)
Model 4 Approximations using summation of the integrals over each cluster of sites with the same selection regime (with a linear mapping function) and integration over the distributions of selection coefficients
here, are likely to approach additivity (Wright 1934; Kacser and Burns 1981). It is thus not cleara prioriwhich of theseh values is likely to be more realistic, but anhvalue much less than 0.5 seems unlikely.
The map lengths of theXchromosome and the autosomal arm in female meiosis were set to 0.6 M and 0.5 M, respec-tively, which approximate the standard values forD. mela-nogaster (Ashburner et al.2005). The genes in this model include only coding sequences. The relative values ofXand A coalescent times are displayed after multiplying the B value for the X by 3/4, which is the ratio expected in the absence of BGS and with a 1:1 sex ratio and random varia-tion in offspring number in both sexes (Wright 1931). This adjusted ratio provides a baseline prediction for the ratio of X/Aneutral diversity values; an excess variance in male re-productive success due to sexual competition, or a female-biased sex ratio, would cause an even higher value (Hedrick 2007; Hutteret al.2007; Vicoso and Charlesworth 2009a). The predictions for B for autosomal loci when all sites are taken into account vary from 0.52 to 0.56, and for X -linked loci from 0.67 to 0.69, depending on the model and the value ofh. The adjustedX/Aratio varies from 0.93 to 0.96; this is the parameter of most interest for the pur-pose of this article, so that its relatively small range is en-couraging. The large data set of Hutter et al. (2007) on variability in noncoding sequences in the Zimbabwe popu-lation ofD. melanogastergave anX/Adiversity ratio of 0.90 after correcting for effects of GC content on diversity and divergence, which is in good agreement with the predictions of Table 2 and highly significantly different from the null value of 0.75. Note, however, that these predictions ignore possible effects of selection on the variants in the relatively
long noncoding sequences involved, so the exact value of this ratio is still somewhat uncertain.
Model 1 involves the least approximations, but model 2 (which assumes a linear map) gives almost identical results. Model 3, which simply assumes a uniform density of se-lected sites across the chromosome, gives a remarkably good approximation to the model 1 results; models 4 and 5, somewhat surprisingly, give a slightly worsefit to the model 1 results than model 3 and overpredict the effects of BGS, although the differences are probably not meaningful for the purpose of comparisons with data. The bulk of the effect of BGS comes from the strongly selected sites, but the weakly selected sites make a significant contribution to increasing the adjusted X/Adiversity ratio away from 3/4. For exam-ple, model 1 withh¼0.5 and no weakly selected sites gives an adjustedX/Adiversity ratio of0.86 instead of 0.93.
For models 1 and 2, a smaller value ofhgives a slightly larger effect of BGS; however, the effect of dominance ap-pears to be negligible in all cases, consistent with the good performance of model 3 as an approximation, which is in-dependent ofh. However, it should be noted that the mean and threshold svalues were kept unchanged from theh¼ 0.5 case, to isolate the effect of h. The distribution of muta-tional effects inDrosophilaas estimated from population genetic data in reality involvestsnots, since nonrecessive autosomal mutations are largely selected against on the basis of their heterozygous effects andX-linked mutations on the basis of a weighted average of their heterozygous effects on females and their hemizgygous effects on males (Charlesworth and Charlesworth 2010, p. 161), so that the s values withh¼ 0.2 should be adjusted to give the same distribution of ts values as for the h¼ 0.5 case. This implies that changing Table 2 The effects of background selection onD. melanogasterautosomal andXchromosomal genes
Model 1 Model 2 Model 3 Model 4 Model 5
B values for autosomes
Effects of strongly selected sites 0.684 0.684 0.665 0.680 0.638
0.687 0.687 0.665 0.690 0.606
Effects of weakly selected noncoding sites 0.814 0.815 0.839 0.791 0.831
0.806 0.806 0.839 0.757 0.867
Effects of all sites 0.556 0.557 0.558 0.538 0.530
0.554 0.554 0.558 0.523 0.525
B values forXchromosome
Effects of strongly selected sites 0.789 0.789 0.775 0.788 0.752
0.790 0.790 0.775 0.790 0.746
Effects of weakly selected noncoding sites 0.878 0.878 0.896 0.859 0.895
0.876 0.876 0.896 0.851 0.904
Effects of all sites 0.693 0.693 0.695 0.677 0.673
0.692 0.692 0.695 0.672 0.675
AdjustedX/Adiversity ratio for all sites 0.935 0.935 0.934 0.944 0.952
0.937 0.937 0.934 0.964 0.964
See Table 1 for the meaning of the different models.Bis the ratio of the effective population size under background selection to the neutral value. The parameters of the gamma distributions of selection coefficients area1¼a2¼0.3,s1¼s2¼2.5·1023(strongly selected sites) anda3¼0.3,s3¼
8·1026(weakly selected sites). Results for the dominance coefficienth¼0.5 are shown in the top part of each row, and results forh¼0.2 are
shown in the bottom part. A diploid deleterious mutation rate ofUD¼0.24 is assumed for both the autosomal arm (A) and theXchromosome.
Map lengths of 0.5 and 0.6 M in female meiosis are assumed forAandX, respectively. The number of coding sequences in an arm (ng) is 2800; the
h should have no effect on the results, provided that the distribution of ts is held constant, other than through rounding errors in the numerical results. This was verified by recalculating the results after multiplying the mean val-ues ofsfor the strongly and weakly selected sites, as well as the threshold value ofs, by 0.5/hand 3·0.5/(2h+ 1) for autosomal andX-linked loci, respectively. For example, with model 1 and the D. melanogaster parameters, the overallB values forAandX are 0.557 and 0.692, respec-tively, yielding an adjustedX/Adiversity ratio of 0.93. The same argument can be applied to other modifications to the selection model, such as female- or male-specific selective effects, implying that the results should be robust to these changes.
BGS on the X and A in D. pseudoobscura
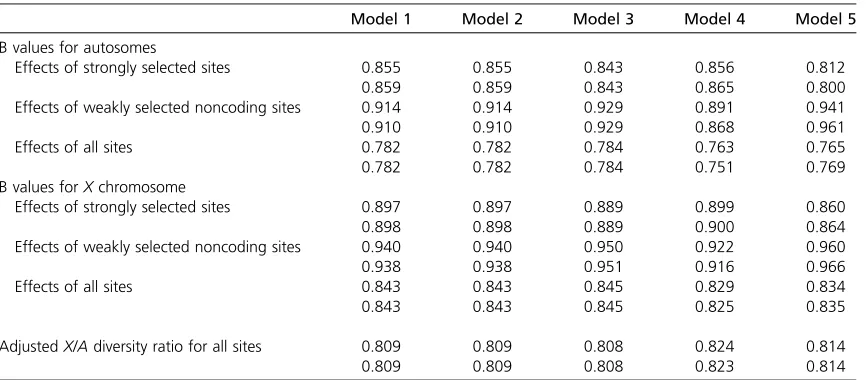
It is of interest to compare the results with those for D. pseudoobscura and its relatives, which have a two-arm X chromosome but single-arm autosomes and a much higher frequency of crossing over per base pair than D. mela-nogaster (Sturtevant and Tan 1937; Bachtrog and Andol-fatto 2006; Kulathinal et al. 2008; Stevison and Noor 2010). The total map lengths of the chromosome arms are not known precisely; values of 1.2 M and 1.3 M have been assumed here for an autosome and anXchromosome arm, respectively, on the basis of Kulathinal et al. (2008) and Stevison and Noor (2010). Table 3 shows the results for these map lengths, with the other parameters being the same as for D. melanogaster. The adjusted X/Aratios are always substantially smaller than their counterparts in Table 2, reflecting the greater dissipation of BGS by the higher fre-quencies of recombination on both chromosomes.
Haddrillet al.(2010) found that, after removing loci that deviated significantly from neutrality, the estimated mean synonymous site diversities X and A for D. pseudoobscura were 0.0149 (SE¼0.0018) and 0.0230 (SE¼0.0021) for
D. pseudoobscura, giving a value of 0.65 (SE¼0.26) for the X/Aratio, which is not significantly different from 0.75 but is significantly different from one and equal to the ratio ofX/A effective population sizes estimated by Haddrillet al.(2011) after taking the recent population expansion in this species into account. The corresponding estimate for the close rela-tiveD. miranda, for which there is little evidence for a recent expansion, was 0.79. The observed ratios for these two spe-cies are thus statistically consistent with the values of0.81 shown in Table 3.
Robustness of the results
The results for a focal site in the middle of an arm are largely insensitive to linkage to another chromosome arm of similar size to the one being considered. For example, under model 1 with the parameters used in Tables 2 and 3 withh¼0.5, the B values for D. melanogaster when an additional arm is present are 0.557 forAand 0.693 forX, with an adjusted X/Aratio of 0.93,i.e., a very slight decrease over the Table 2 results. There is no effect at all forD. pseudoobscura. Com-plete insensitivity to the size of the chromosome is necessar-ily the case for model 3, which uses the result that, for a site that is not too close to the end of a chromosome, the effect of BGS depends only on the ratio of the total mutation rate to the map length (see derivation of the model 3 prediction above). Increasing both the mutation rate and the map length by the same factor, as would happen if the influence of an additional arm with similar mutational parameters were considered, thus has no effect onB.
Another important feature of the models is the length of the coding sequences vs. intergenic sequences. The model on which the above results are based ignores the fact that, as mentioned in the Introduction, most Drosophila genes have introns, many of which are several hundred base pairs or more in length and contain some selectively highly constrained sequences (e.g., Sellaet al.2009). This can be crudely modeled Table 3 The effects of background selection onD. pseudoobscuraautosomal andXchromosomal genes
Model 1 Model 2 Model 3 Model 4 Model 5
B values for autosomes
Effects of strongly selected sites 0.855 0.855 0.843 0.856 0.812
0.859 0.859 0.843 0.865 0.800
Effects of weakly selected noncoding sites 0.914 0.914 0.929 0.891 0.941
0.910 0.910 0.929 0.868 0.961
Effects of all sites 0.782 0.782 0.784 0.763 0.765
0.782 0.782 0.784 0.751 0.769
B values forXchromosome
Effects of strongly selected sites 0.897 0.897 0.889 0.899 0.860
0.898 0.898 0.889 0.900 0.864
Effects of weakly selected noncoding sites 0.940 0.940 0.950 0.922 0.960
0.938 0.938 0.951 0.916 0.966
Effects of all sites 0.843 0.843 0.845 0.829 0.834
0.843 0.843 0.845 0.825 0.835
AdjustedX/Adiversity ratio for all sites 0.809 0.809 0.808 0.824 0.814
0.809 0.809 0.808 0.823 0.814
by increasing the number of coding sequences, while holding their total length constant. The length of intergenic sequence is decreased proportionately, keeping the lengths of individual blocks of weakly selected and strongly selected noncoding sequences approximately constant.
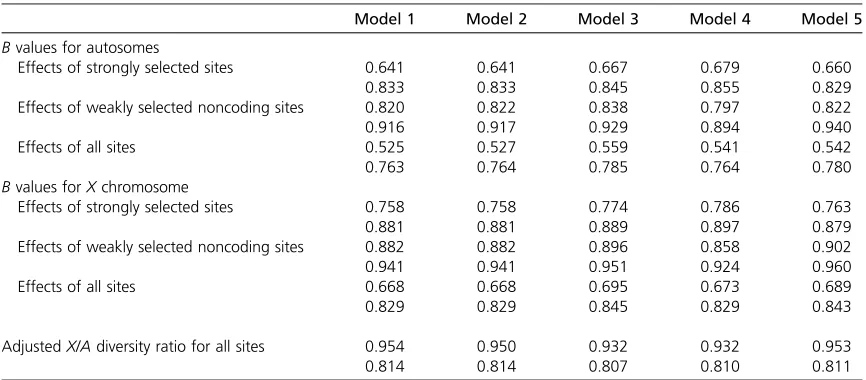
It would be expected that dividing the chromosome arm into a larger number of shorter functional sequences, for the same total size and map length, would increase the effects of BGS and hence theX/Adiversity ratio, since the average den-sity of selected sites in relation to the frequency of recombi-nation is reduced. Table 4 shows results that are otherwise comparable with theh¼0.5 results forD. melanogasterand D. pseudoobscura, for twice the number of coding sequences as before (some minor adjustments to the numbers and lengths of the noncoding sequences were made, to meet the assump-tions about the organization of the chromosome).
As expected, the effects of BGS due to strongly selected sites under models 1 and 2 are enhanced, resulting in a slightly higherX/Adiversity ratio than before. The effects of weakly selected noncoding sites are slightly diminished, pre-sumably reflecting the fact that there are smaller clusters of blocks of these sites. The overall effect of BGS is greater than before, and the X/A diversity ratio for D. melanogaster is predicted to be .0.95, whereas that forD. pseudoobscura is barely changed at 0.81. Doubling the number of coding sequences again produces further effects in the same direc-tion (results not shown), with the predicted X/A diversity ratios under models 1 and 2 for D. melanogaster and D. pseudoobscura becoming 0.98 and 0.82, respectively. The predictions of model 3 are no longer as close to the model 1 results as previously, mainly reflecting the increased effect of strongly selected sites in model 1, whereas the model 3 re-sults change only marginally because of the adjustments in the parameters mentioned above. Model 4 performs only slightly better than model 3, mainly because it underpredicts
the effects of strongly selected sites. Model 5 gives results that are closer to model 1, despite being an approximation to model 4. Overall, the results suggest that theX/Aratios are relatively insensitive to the way in which the chromosome arm is divided among coding and noncoding sequences, with a finer subdivision into strongly selected coding sequences leading to slightly larger effects of BGS.
The sensitivity of the results to the parameters of the dis-tribution of selection coefficients was also examined. Since model 3 generally provides a good approximation, provided that the threshold value ofsis kept constant, little effect of changing these parameters is expected, except by altering the proportion of deleterious mutations that fall below the threshold, thereby reducing the net truncated mutation rate UT. It would therefore be expected that, for a given shape
parametera, the effect of BGS should be greater, the larger the mean selection coefficient; similarly, for a given mean se-lection coefficient, the effect of BGS should be greater, the larger the value ofa, since this reduces the coefficient of var-iation of the distribution.
The effects of changing the selection parameters for strongly selected sites were investigated, since these con-tribute the most to the effects of BGS. The theoretical expectations were confirmed, but the effects on the adjusted X/A diversity ratio were relatively minor. For example, changings1¼s2from 2.5·1023to 0.01 or to 0.5·1023
caused the adjusted X/Aratio predicted by model 1 forD. melanogaster (with shape parameter a ¼ 0.3) to change from 0.935 to 0.936 and 0.922, respectively. Changing a from 0.3 to 0.6 or to 1.2 (withs1 =s2 ¼ 2.5 · 1023)
caused this ratio to change to 0.950 and 0.952, respectively.
Conclusions
Overall, it seems that the results are fairly robust to the details of the selection parameters for deleterious mutations, Table 4 Background selection with a large number of short coding sequences
Model 1 Model 2 Model 3 Model 4 Model 5
Bvalues for autosomes
Effects of strongly selected sites 0.641 0.641 0.667 0.679 0.660
0.833 0.833 0.845 0.855 0.829
Effects of weakly selected noncoding sites 0.820 0.822 0.838 0.797 0.822
0.916 0.917 0.929 0.894 0.940
Effects of all sites 0.525 0.527 0.559 0.541 0.542
0.763 0.764 0.785 0.764 0.780
Bvalues forXchromosome
Effects of strongly selected sites 0.758 0.758 0.774 0.786 0.763
0.881 0.881 0.889 0.897 0.879
Effects of weakly selected noncoding sites 0.882 0.882 0.896 0.858 0.902
0.941 0.941 0.951 0.924 0.960
Effects of all sites 0.668 0.668 0.695 0.673 0.689
0.829 0.829 0.845 0.829 0.843
AdjustedX/Adiversity ratio for all sites 0.954 0.950 0.932 0.932 0.953
0.814 0.814 0.807 0.810 0.811
for a given deleterious mutation rate. However, they are very sensitive to the deleterious mutation rate and the amount of recombination. Using model 3 (Hudson and Kaplan 1994; Barton 1995), which generally gives a reason-able approximation to the more exact results, the adjusted X/Aratio with a truncated deleterious mutation rate for an arm of UTis equal to 0.75·exp{UT(MeX–MeA)/MeXMeA},
whereMeXandMeAare the population-effective map lengths
of the X chromosomal and autosomal arms, respectively. This ratio changes almost linearly from 0.79 to 0.93, over the range from UT ¼0.0365 to 0.146 (the value assumed
above) with MeX ¼ 0.40 and MeA ¼ 0.25, the D.
mela-nogaster values, and from 0.76 to 0.81 with MeX ¼ 0.87
and MeA¼0.60, theD. pseudoobscura values. A higherUT
of 0.25 per chromosome arm gives values of 1.09 and 0.85, for the D. melanogasterandD. pseudoobscuramap lengths, respectively. Such a high mutation rate seems implausible, however, given the size of the Drosophilagenome and our current estimates of the mutation rate in D. melanogaster (Haag-Liautard et al. 2007; Keightleyet al. 2009), so that the lower range of mutation rates used in these calculations is more likely to apply.
As might be expected intuitively, longer map lengths lead to smallerX/Adiversity ratios and a lower sensitivity to the deleterious mutation rate. Species likeD. melanogaster, with a small number of chromosomes and relatively short map lengths, are thus most likely to show an effect of BGS on the overall X/A diversity ratio. As discussed by Charlesworth (2012), BGS will tend to reduce rather than increase the X/A diversity ratio in taxa like mammals, where crossing over occurs on the autosomes in males (the same applies to the ratio ofZchromosome to autosomal diversity in birds, but Lepidoptera should behave like Drosophila because of their lack of crossing over in females), but the effect is likely to be fairly small because of the large number of chromosomes and the correspondingly low deleterious mu-tation rate per chromosome. Even for a Drosophilaspecies, whether or not the ratio ofXto autosomal neutral variability for a gene in the middle of the relevant chromosome arms is substantially greater than the null expectation of 3/4 is highly dependent on the deleterious mutation rate and the map lengths in question. More accurate knowledge of these parameters will help to resolve the question of whether the observations on X/A variability ratios in different popula-tions and species can be accounted for solely by BGS or whether the other factors mentioned in the Introduction need to be invoked.
A role for selective sweeps rather than BGS in producing this effect cannot, of course, be ruled out, although these have usually been invoked to explain theX/Asilent diversity ratio of,3/4 in non-African populations ofD. melanogaster andD. simulans(Begun and Aquadro 1993; Aquadroet al. 1994; Begun and Whitley 2000; Andolfatto 2001; Harret al. 2002; Hutteret al.2007; Singhet al. 2007; Stephan 2010; Mackayet al.2012), on the basis of a faster rate of adaptive evolution onXthan onA(Charlesworthet al.1987; Vicoso
and Charlesworth 2009a) in response to the novel out-of-Africa environment. If this hypothesis is correct, then it seems unlikely that selective sweeps could be the cause of theX/Avariability ratio of near one in East African popula-tions of D. melanogaster, given that the theoretical study of the effect of selective sweeps on the X/A diversity ratio in Drosophilaby Betancourtet al.(2004) showed that thefi x-ation of partially recessive favorable mutx-ations reduces the value of this ratio below 3/4.
However, the question of the cause of the much lowerX/A diversity ratio in non-African populations of D. melanogaster andD. simulansremains undecided, since purely demographic explanations have been proposed as an alternative or supple-ment to the selective sweep model (Charlesworth 2001; Wall et al. 2002; Pool and Nielsen 2007, 2008). If the ancestral population had a high value of this ratio, this would seem to rule out demographic explanations based on a greater sensi-tivity of Xthan of Ato a population bottleneck that require a value close to three-quarters (Pool and Nielsen 2007, 2008). It is possible, however, that demographic effects could interact with those of BGS to contribute to the reducedX/Adiversity. A severe reduction in population size would be expected to reduce the effect of BGS, since a larger proportion of delete-rious mutations will fall below the threshold for validity of the model used here. If the effectiveness of BGS for a population at equilibrium with greatly reduced effective population size is examined by increasing the threshold selection coefficientsT
in inverse proportion to the population size, the reduction can be quite large—for twofold and fourfold reductions below the values shown in Table 2, the adjusted X/A diversity ratios become 0.81 and 0.80, respectively. Not surprisingly, however, the ratio always remains above 3/4, in contrast to the ob-served ratio of,0.60 for the non-African sample ofD. mela-nogasterin the meta-analysis in Table 4 of Singhet al.(2007). However, the question of how background selection would interact with changing population size to affect the dynamics of theX/Adiversity ratio remains to be studied; the computer algorithm for modeling BGS with recombination that has re-cently been developed by Zeng and Charlesworth (2011) should be helpful in this regard, since it can be modified to allow for changing population size. In this context, it is in-teresting to note that Singhet al.(2007) found that the level of polymorphism for intergenic noncoding sequences was similar forXandAin a sample from a U.S. population; both X and A showed a similar reduction in diversity compared with an African sample, suggesting that selective sweeps may be implicated in the greater reduction in variability for Xthan forAfor sequences obtained from genes. The genome-wide surveys of diversity that are becoming available in Dro-sophila(e.g., Sacktonet al.2009; Mackayet al.2012) should help to resolve these questions.
Acknowledgments
work was supported by grant BB/G003076/1 from the Biotechnology and Biological Sciences Research Council of the United Kingdom.
Literature Cited
Andolfatto, P., 2001 Contrasting patterns ofX-linked and
autoso-mal nucleotide variation in African and non-African populations ofDrosophila melanogasterandD. simulans. Mol. Biol. Evol. 18:
279–290.
Aquadro, C. F., D. J. Begun, and E. C. Kindahl, 1994 Selection,
recombination, and DNA polymorphism in Drosophila, pp. 46–
56 inNon-neutral Evolution: Theories and Molecular Data, edited
by B. Golding. Chapman & Hall, London.
Ashburner, M., K. G. Golic, and R. S. Hawley, 2005 Drosophila. A
Laboratory Handbook. Cold Spring Harbor Laboratory Press, Cold Spring Harbor, NY.
Bachtrog, D., 2008 Evidence for male-driven evolution in
Dro-sophila. Mol. Biol. Evol. 25: 617–619.
Bachtrog, D., and P. Andolfatto, 2006 Selection, recombination
and demographic history inDrosophila miranda. Genetics 174:
2045–2059.
Barton, N. H., 1995 Linkage and the limits to natural selection.
Genetics 140: 821–841.
Bauer, V. L., and C. F. Aquadro, 1997 Rates of DNA sequence
evolution are not sex biased inDrosophila melanogasterandD.
simulans. Mol. Biol. Evol. 14: 1252–1257.
Begun, D. J., and C. F. Aquadro, 1993 African and North
Ameri-can populations of Drosophila melanogaster are very different at
the DNA level. Nature 365: 548–550.
Begun, D. J., and P. Whitley, 2000 ReducedX-linked nucleotide
polymorphism inDrosophila simulans. Proc. Natl. Acad. Sci. USA
97: 5960–5965.
Betancourt, A. J., Y. Kim, and H. A. Orr, 2004 A
pseudohitchhik-ing model of X vs. autosomal diversity. Genetics 168: 2261–
2269.
Casillas, S., A. Barbadilla, and C. M. Bergman, 2007 Purifying
selection maintains highly conserved noncoding sequences in
Drosophila. Mol. Biol. Evol. 24: 2222–2234.
Charlesworth, B., 1996 Background selection and patterns of genetic
diversity inDrosophila melanogaster. Genet. Res. 68: 131–150.
Charlesworth, B., 2001 The effect of life-history and mode of
in-heritance on neutral genetic variability. Genet. Res. 77: 153–166.
Charlesworth, B., 2012 The effects of deleterious mutations on
evolution at linked sites. Genetics 190: 5–22.
Charlesworth, B., and D. Charlesworth, 2010 Elements of
Evolu-tionary Genetics. Roberts & Co., Greenwood Village, CO.
Charlesworth, B., J. A. Coyne, and N. H. Barton, 1987 The
rela-tive rates of evolution of sex chromosomes and autosomes. Am.
Nat. 130: 113–146.
Charlesworth, B., M. T. Morgan, and D. Charlesworth, 1993 The
effect of deleterious mutations on neutral molecular variation.
Genetics 134: 1289–1303.
Cobbs, G., 1978 Renewal approach to the theory of genetic
link-age: case of no chromatid interference. Genetics 89: 563–581.
Crow, J. F., and M. J. Simmons, 1983 The mutation load in
Dro-sophila, pp. 1–35 inThe Genetics and Biology of Drosophila, Vol.
3c, edited by M. Ashburner, H. L. Carson, and J. N. Thompson. Academic Press, London.
Ellegren, H., 2009 The different levels of genetic diversity in sex
chromosomes and autosomes. Trends Genet. 25: 278–284.
Eyre-Walker, A., and P. D. Keightley, 2009 Estimating the rate of
adaptive mutations in the presence of slightly deleterious
muta-tions and population size change. Mol. Biol. Evol. 26: 2097–
2108.
Garcia-Dorado, A., and A. Caballero, 2000 On the average coeffi
-cient of dominance of deleterious spontaneous mutations.
Ge-netics 155: 1991–2001.
Haag-Liautard, C., M. Dorris, X. Maside, S. Macaskill, D. L. Halligan et al., 2007 Direct estimation of per nucleotide and genomic
deleterious mutation rates inDrosophila. Nature 445: 82–85.
Haddrill, P. R., B. Charlesworth, D. L. Halligan, and P. Andolfatto,
2005 Patterns of intron sequence evolution in Drosophila are
dependent upon length and GC content. Genome Biol. 6: R67.
Haddrill, P. R., L. Loewe, and B. Charlesworth, 2010 Estimating the
parameters of selection on nonsynonymous mutations in
Drosoph-ila pseudoobscuraandD. miranda. Genetics 185: 1381–1396.
Haddrill, P. R., K. Zeng, and B. Charlesworth, 2011 Determinants
of synonymous and nonsynonymous variability in three species
of Drosophila. Mol. Biol. Evol. 28: 1731–1743.
Halligan, D. L., and P. D. Keightley, 2006 Ubiquitous selective
constraints in the Drosophila genome revealed by a
genome-wide sequence comparison. Genome Res. 16: 875–884.
Harr, B., M. Kauer, and C. Schloetterer, 2002 Hitchhiking
map-ping: a population-based fine-mapping strategy for adaptive
mutations in Drosophila melanogaster. Proc. Natl. Acad. Sci.
USA 99: 12949–12954.
Hedrick, P. W., 2007 Sex differences in mutation, recombination,
selection, gene flow, and genetic drift. Evolution 61: 2750–
2771.
Hudson, R. R., and N. L. Kaplan, 1994 Gene trees with
back-ground selection, pp. 140–153 inNon-neutral Evolution:
Theo-ries and Molecular Data, edited by B. Golding. Chapman & Hall, London.
Hudson, R. R., and N. L. Kaplan, 1995 Deleterious background
selection with recombination. Genetics 141: 1605–1617.
Hutter, S., H. P. Li, S. Beisswanger, D. De Lorenzo, and W. Stephan,
2007 Distinctly different sex ratios in African and European
pop-ulations of Drosophila melanogasterinferred from
chromosome-wide nucleotide polymorphism data. Genetics 177: 469–480.
Kacser, H., and J. A. Burns, 1981 The molecular basis of
domi-nance. Genetics 97: 639–666.
Keightley, P. D., and A. Eyre-Walker, 2007 Joint inference of the
distribution offitness effects of deleterious mutations and
pop-ulation demography based on nucleotide polymorphism
fre-quencies. Genetics 177: 2251–2261.
Keightley, P. D., M. Trivedi, M. Thomson, F. Oliver, S. Kumaret al.,
2009 Analysis of the genome sequences of three Drosophila
melanogaster spontaneous mutation accumulation lines.
Ge-nome Res. 19: 1195–1201.
Kimura, M., 1971 Theoretical foundations of population genetics
at the molecular level. Theor. Popul. Biol. 2: 174–208.
Kulathinal, R. J., S. M. Bennett, C. L. Fitzpatrick, and M. A. F. Noor,
2008 Fine-scale mapping of recombination rate in Drosophila
refines its correlation to diversity and divergence. Proc. Natl.
Acad. Sci. USA 10: 10051–10056.
Loewe, L., and B. Charlesworth, 2006 Inferring the distribution
of mutational effects on fitness in Drosophila. Biol. Lett. 2:
426–430.
Loewe, L., and B. Charlesworth, 2007 Background selection in
single genes may explain patterns of codon bias. Genetics 175:
1381–1393.
Loewe, L., B. Charlesworth, C. Bartolomé, and V. Nöel, 2006
Esti-mating selection on nonsynonymous mutations. Genetics 172:
1079–1092.
Mackay, T. F. C., S. Richards, E. A. Stone, A. Barbadilla, J. F. Ayroles et al., 2012 The Drosophila melanogaster genetic reference
panel. Nature 482: 173–178.
Nordborg, M., B. Charlesworth, and D. Charlesworth, 1996 The effect of recombination on background selection. Genet. Res.
67: 159–174.
Pool, J. E., and R. Nielsen, 2007 Population size changes reshape
genomic patterns of diversity. Evolution 61: 3001–3006.
Pool, J. E., and R. Nielsen, 2008 The impact of founder events on
chromosomal variability in multiply mating species. Mol. Biol.
Evol. 25: 1728–1736.
Sackton, T. B., R. J. Kulathinal, C. M. Bergman, A. R. Quinlan, E. B.
Dopman et al., 2009 Population genomic inferences from
sparse high-throughput sequencing of two populations of
Dro-sophila melanogaster. Genome Biol. Evol. 1: 449–450.
Schneider, A., B. Charlesworth, A. Eyre-Walker, and P. D. Keightley,
2011 A method for inferring the rate of occurrence andfitness
effects of advantageous mutations. Genetics 189: 1427–1437.
Sella, G., D. A. Petrov, M. Przeworski, and P. Andolfatto,
2009 Pervasive natural selection in the Drosophila genome?
PLoS Genet. 6: e1000495.
Singh, N. D., J. M. Macpherson, J. D. Jensen, and D. A. Petrov,
2007 Similar levels ofX-linked and autosomal nucleotide
var-iation in African and non-African populations ofDrosophila
mel-anogaster. BMC Evol. Biol. 7: 202.
Stephan, W., 2010 Genetic hitchikingvs. background selection:
the controversy and its implications. Philos. Trans. R. Soc. B
365: 1245–1253.
Stevison, L. S., and M. A. F. Noor, 2010 Genetic and evolutionary
correlates offine-scale recombination rate variation in
Drosoph-ila persimilis. J. Mol. Evol. 71: 332–345.
Sturtevant, A. H., and C. C. Tan, 1937 The comparative genetics
of Drosophila pseudoobscura and Drosophila melanogaster. J.
Genet. 34: 415–431.
Vicoso, B., and B. Charlesworth, 2009a Effective population size and
the Faster-Xeffect: an extended model. Evolution 63: 2413–2426.
Vicoso, B., and B. Charlesworth, 2009b Recombination rates may
affect the ratio ofXto autosomal noncoding polymorphism in
African populations of Drosophila melanogaster. Genetics 181:
1699–1701.
Wall, J. D., P. Andolfatto, and M. F. Przeworski, 2002 Testing
models of selection and demography in Drosophila simulans.
Genetics 162: 203–216.
Wilson, D. J., R. D. Hernandez, P. Andolfatto, and M. Przeworski,
2011 A population genetics-phylogenetics approach to
infer-ring natural selection in coding sequences. PLoS Genet. 7: e1002395.
Wright, S., 1931 Evolution in Mendelian populations. Genetics
16: 97–159.
Wright, S., 1934 Physiological and evolutionary theories of
dom-inance. Am. Nat. 68: 25–53.
Zeng, K., 2010 A simple multiallele model and its application to
identifying preferred–unpreferred codons using polymorphism
data. Mol. Biol. Evol. 27: 1327–1337.
Zeng, K., and B. Charlesworth, 2009 Estimating selection
inten-sity on synonymous codon usage in a non-equilibrium
popula-tion. Genetics 183: 651–662.
Zeng, K., and B. Charlesworth, 2010 Studying patterns of recent
evolution at synonymous sites and intronic sites inDrosophila
melanogaster. J. Mol. Evol. 70: 116–128.
Zeng, K., and B. Charlesworth, 2011 The joint effects of
back-ground selection and genetic recombination on local gene
ge-nealogies. Genetics 189: 251–266.
Communicating editor: J. Wakeley
Appendix
Derivation of Equation 2
For a given pair of genes with indexj, at the same distance to the right and left of the focal site and with a linear mapping function, the joint contribution to the negative of the exponent in Equation 1 can be written as
U1ts 0:7 nglg
Z zj2
zj1
dz
tsþrjðzÞ½12ts 2¼
U1ts nglg
lg
rj22rj1
Z rj2 rj1
dr ðtsþr½12tsÞ2
; (A1)
wherezj1andzj2are the numbers of bases separating the beginning and end of the gene from the focal site, respectively, and
rj1andrj2are the corresponding recombination fractions.
The factor of 0.7 in the denominator of the right-hand terms disappears from the left-hand side, because the assumption of a uniform density of selected sites along the coding sequence implies that dz/dr ¼ 0.7lg/(r1 – r2), since the mean
recombination frequency between adjacent selected sites is (r1–r2)/(0.7lg) and not (r1–r2)/lg. Performing the integration,
this expression becomes
U1ts ng
rj22rj1
1
ð12tsÞ
1
tsþrj1½12ts
2 1
tsþrj2½12ts
; (A2)
which yields Equation 2 of the text.
Distances from the Focal Site for Strongly Selected Noncoding Sites and Expressions for Models 4 and 5
The distancesd1mjandd2mjfrom the focal site to the beginning and end of themth block of strongly selected noncoding sites, in thejth intergenic region to its right, are as follows. Letm¼1 for the leftmost block in an intergenic region andm¼nsfor
For j¼0, the focal site is located in the center of the weakly selected noncoding block in the middle of the intergenic region, so that
d1m0¼ ðm20:5Þliwþ ðm21Þlis; d2m0¼d1m0þlis
1 # m # ns
2 : (A3a)
For 1#j#ng/2
d1mj¼jlgþ ðj20:5Þliþmliwþ ðm21Þlis; d2mj¼d1mjþlis ð1 # m # nsÞ: (A3b)
Note that d2mj–d1mj¼lis, independently ofm.
The corresponding population-effective recombination rates can be obtained by multiplying thed’s by the appropriate function relating recombination rate to physical distance, yielding values of r1mj and r2mj. For the mth strongly selected noncoding block in thejth intergenic sequence, we can thus obtain expressions similar to Equations 2 and 3, except thatU1is
replaced byU2andngis replaced byngnsin Equation 2, to take into account the fact that there are a total of approximately
ngnsstrongly selected noncoding sequences on the chromosome arm:
E2mjðtsÞ U2ts ngns
tsþr1mj½12ts
tsþr2mj½12ts
: (A4)
By taking the exponent of the negative of the sum of this expression over allmandj, we obtain the expression forB2in
model 4.
The corresponding model 5 approximation to this sum can be obtained as follows. Following the method used for Equations 4 and 5 of the text,mis replaced by a continuous variablex, and Equation A4 is integrated with respect toxfrom x¼1 tox¼ns. This yields an expression similar to Equation 5,
E2j ðtsÞ
U2ts ngns~r
2
ðliwþlisÞlis ln
(
aj9þbns
ajþb
ajþbns
aj9þb
)
; (A5)
wherea0¼ts–0.5~rliw,a90¼a0–~rlis,aj¼ts+~r(jlg+ [j–0.5]li),a9j¼aj–~rlis(for 1#j#ng/2), andb¼~r(liw+lis).
By taking expectations of thefirst- and second-order terms in the deviations of thetsfrom their mean over the truncated distribution ofs, an expression similar to the negative exponent in Equation 6 is obtained for the sum of the contributions from the jth genes to the right and left of the focal site,
E2j U2T ngns~r ðliwþlisÞ
( 1
t2þb2j
"
t22
b2jV2
t2þb2j
2
# 2 1
t2þg2j
"
t22
g2jV2
t2þg2j
2
#)
; (A6)
whereb2j¼aj+b–ts,g2j¼aj+bns–ts, andU2Tis the deleterious mutation rate for strongly selected noncoding sites after
truncation of the distribution ofs;t2 andV2are the mean and variance oftsover this distribution.
The sum of theE2jfor all values ofjbetween 0 andng/2 is needed to obtain thefinal approximate expression forB2. The
contributionE20from the intergenic sequences immediately surrounding the focal site is given by Equations A5 and A6 with
j¼0. The remaining part of the sum can be approximated by replacingjwith a continuous variabley, so thatb2jandg2jare replaced byb2yandg2y, and then integrating with respect toyfromy¼1 toy¼ng/2. We have
Z
1
ng=2 dy
t2þb2y
¼1 lln
t2þkþ ð1 = 2Þlng
t2þkþl
¼I1b; (A7)
wherek¼~r(liw+lis–0.5li) andl¼~r(li+lg).
A similar integralI1gcan be obtained forg2y, replacingliw+lisin the expressions forkandlwith (liw+lis)ns.
Similarly, we have
Z ng=2
1
b2ydy
t2þb2y
3¼
1 2lt2
(
kþ ð1 = 2Þlng
t2þkþ ð1 = 2Þlng2
2 ðkþlÞ2 ðt2þkþlÞ2
)
¼I2b (A8)
These can be used in place of corresponding components of the sum of theE2jin Equation A5, together with theE20term,
yielding the model 5 approximation forB2.
Distances from the Focal Site for Weakly Selected Noncoding Sites and Expressions for Models 4 and 5
A similar approach can be used for weakly selected sites. The distancesd1mjand d2mjfrom the focal site to the beginning and end of themth block of weakly selected noncoding sites in thejth intergenic region to its right are given by
d110¼0; d210¼0:5liw ðj¼0;m¼1Þ (A9a)
d1m0¼ ðm21ÞðliwþlisÞ20:5liw; d2m0¼d1m0þliw
j¼0; 2 # m # ns
2 : (A9b)
For 1#j#ng/2
d1mj¼jlgþ ðj20:5Þliþ ðm21Þðliwþlis;Þ; d2mj ¼d1mjþliw ð1#m#nsÞ: (A9c)
These expressions yield the corresponding recombination frequencies, r1mj and r2mj, by multiplying by the appropriate function that relates recombination rate to distance.
Following the same procedure as for the strongly selected noncoding sequences, the equivalent of Equation A4 is
E3mjðtsÞ U3ts
ngðnsþ1Þ
tsþr1mj½12ts
tsþr2mj½12ts
: (A10)
This yields the expression forB3in model 4, by taking the exponential function of the negative of its sum over allmandj.
The model 5 approximation to this sum can be obtained in a similar way to that used for the strongly selected noncoding sites. The equivalent to Equation A8 is
E3j
U3T
ngðnsþ1Þ~rðliwþlisÞ
8 > < > :
1
t3þb3j
"
t32
b3jV3
t3þb3j
2
#
2 1
t3þg3j
"
t32
g2jV3
t3þg2j
2
#9>=
>
;; (A11)
whereb30¼0.5~rliw,b3j¼~r(jlg+ [j–0.5]li+liw) (for 1#j#ng/2),g30¼~r(nslis+ [ns+ 0.5]liw),g3j¼r~(jlg+ [j–0.5]li
+nslis+ [ns+ 1]liw) (for 1#j#ng/2), andt3andV3are the mean and variance oftsover the truncated distribution ofsfor weakly selected noncoding sites. (Here, the discontinuity between m¼1 andm¼2 forj¼0 has been ignored, since it makes only a small contribution to the total; Equation A9b has been used for the case whenj¼0 andm= 1.)
Equivalents to Equations A7 and A8 can then be obtained by the same method as for strongly selected noncoding sites, where nowt2is replaced witht3,k¼r~(liw–0.5li), andl¼~r(li+lg) in the equivalents of Equation A7 and A8;kis replaced