Steady State Rolling Analysis of Pneumatic
Tire using ABAQUS
M Mahesh1, Abhijit C Patil1,Sharath Dinesh Bharadwaj1, P Sakthivel2
PG Student, Automotive Engineering, VIT University, Vellore, Tamil Nadu, India1
Professor, Automotive Research Centre, VIT University, Vellore, Tamil Nadu, India 2
ABSTRACT: Pneumatic tire is a flexible structure of the shape of a torrid filled with compressed air. The running tire on the ground is essential to study the performance, ride and handling behaviour of ground vehicles. The tire material properties and rolling characteristics mainly affects the vehicle performance, hence this project aims to analyse the rolling parameters in a tire with different materials. A Finite Element Analysis is conducted on 175 SR14 tire in ABAQUS 6.14 software on steady state rolling analysis with free rolling, traction and braking. The dynamic behaviour of tire is studied with variation in inflation pressure, camber angle and slip angle of tire. Thus the optimum tire material properties and optimum inflation pressure for various on road conditions can be obtained.
KEYWORDS:ABAQUS, Slip angle, Camber angle, Inflation pressure, Contact pressure, Shear stress
I. INTRODUCTION
Tire is a part or component of the vehicle that is in contact with ground surface. All the major forces and moments affecting the vehicle motion is applied through the contact area between the tire and ground surface. In order to propel the vehicle in forward direction the tire should have good rolling characteristics.[1]
A tire is a torrid shape flexible structure filled with compressed air. The main structural elements of tire are carcass, bead, belt, side wall and tread. The most significant elements is carcass. It is composed of number of layers of flexible cords of high modulus of elasticity encased in low modulus rubber component. The geometric position of cords plays an important role in the behaviour of tire, which is called crown angle, the angle between the cord and circumferential centre line.[4] If a tire has low crown angle then it good from cornering characteristics but a harsh ride. On the other hand if the cords are at right angle then it is good for ride but poor handling characteristics. Bead is the foundation for carcass and it also provides adequate seating of the tire on the wheel rim. In order to get the required properties to the tire the ingredients of rubber component is selected. The widely used rubber component is styrene butadiene, so that high resistance to fatigue and scuffing is obtained at the side walls. [4]
The main aim of this project is to obtain the rolling conditions for 175 SR14 tire with different materials and inflation pressure for free rolling conditions, full braking and full traction. The frictional stress induced in the tire due to rolling is completely different from static stress induced, so rolling characteristics of tire is the main concern in this research. The stimulation is carried out in ABAQUS 6.14. The stimulation was done with four different materials Natural rubber, Styrene Butadiene Rubber (SBR), Arcylonitriline Rubber (ACN) at 200kPa and 300kPa inflation pressure.
II. RELATEDWORK
Chen Liang, Guolin Wang and Zhou Zheng ,Jiangsu University, conducted a FEM Analysis in Abaqus by modifying the tire contour, and concluded that the new contour has better grip and ground contact for rolling conditions as the stress induced in it was less.[3]
Olivier Le Maitre, Manfred Sussner and Cesar Zarak, conducted a FEM Analysis in Abaqus to study the wear parameters of a tire and concluded the inflation pressure has great influence on wear and wear profile. He also concluded that five parameters mainly effect tire wear characteristics, Vehicle, Circuit and driver, Tire, Ground and Season.[1]
III. METHODOLOGY
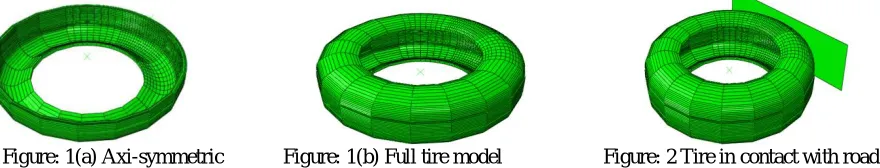
The tire model is imported form abaqus documentation. The tire used in this simulation is 17S SR14. Initially the tire is designed as an axi-symmetric sketch, then the sketch is revolved around the axis and then it mirrored about the symmetric plane. The tire design is shown in figure 1.
Figure: 1(a) Axi-symmetric Figure: 1(b) Full tire model Figure: 2 Tire in contact with road surface
As tire has been designed the tire and road surface contact has been created. The tire road interface is shown in Figure:2.
In the steady state transport analysis moving reference frame where rigid body rotates. It is described by Eluerian manner and deformation is described in a lagrangian manner. So mesh is refined only at contact patch region.
The results of this simulation include the results for contact pressure, shear stress, deformation of tire at three different tests 1. Braking test 2. Slip angle test 3. Camber test. This above mentioned test is carried for 3 different material and two different inflation pressure of tire. The three different materials considered for this analysis are
a) Natural rubber
b) Styrene Butadiene Rubber (SBR) c) Acrylonitrile Rubber (ACN)
The properties of these rubber materials are given in table below:
Table 1: Properties of rubber materials
Types of rubber Density
(Kg/m3)
Young’s modulus (MPa)
Poisson’s ratio.
(µ)
Natural rubber 1100 6 0.49
Styrene Butadiene Rubber (SBR)
950 10 0.48
Acrylonitrile Rubber (ACN) 1300 6.89 0.35
since the rolling speed is low ( 10 km/h). The streamlines needed for the steady-state transport analyses in this example are computed using the revolve functionality for symmetric model generation.
The incompressible hyperelastic material used to model the rubber in this example includes a time-domain viscoelastic component, which is specified directly using the Prony series parameters. A simple 1-term Prony series model is used. For an incompressible material a 1-term Prony series in Abaqus is defined by providing a single value for the shear relaxation modulus ratio, , and its associated relaxation time, . In this example = 0.3 and = 0.1.
Loading :
So for the first simulation of braking test, the braking solution is obtained by setting the coefficient to a limiting value of 1.0. It can be achieved by changing friction properties and also applying the translation ground velocity together with spinning angular velocity. A free rolling tire travels farther in one revolution than estimated by its centre height ‘H’ but less than calculated by the free tire radius. So from the free radius and the effective height of tire considered in this simulation, it is determined that free rolling occurs at an angular velocity between the 8.78 rad/sec to 9.38 rad/sec. Larger angular velocity will leads to traction and smaller angular velocity would result into breaking. So in this simulation we use an angular velocity of 8 rad/s for getting the full breaking condition.
Second simulation is carried out for slip angle test. The slip angle is the angle between direction of wheel travel and the line of intersection of the wheel plane with road surface. In this simulation the slip angle is varied from 0 to 3 degree. Thus the effect of slip angle variation on contact pressure, shear stress and deformation is obtained. This test is conducted for two different inflation pressure and three different tire materials.
Third simulation is carried out for camber angle test. The camber angle is the angle between the wheel plane and a plane perpendicular to road surface when viewed from front or rear side. The camber angle is varied from 0 to 5 degree. Thus the effect of variation of camber angle on contact pressure, shear stress and deformation is obtained.
IV.RESULTS
Steady state rolling analysis of tire was conducted for three materials and at two different inflation pressures. Performance test has been simulated in ABAQUS 6.14.
Following tests were conducted- 1) Braking test
2) Slip angle test 3) Camber test.
The results obtained are as follows-
1. Inflation Pressure=200kPa
1.1 Natural rubber
Steady state rolling analysis was conducted on the tire made of natural rubber. As mentioned above Braking, Slip angle and Camber test were conducted.
a) Braking test-
Figure: 3(a) contact pressure Figure: 3(b) Shear stress Figure:3(c)Deformation
After breaking the contact patch is shifted backward after application of the brake. The maximum contact pressure is observed to be nearly 374 kPa and the max shear stress was observed to be nearly 365 kPa. The maximum deformation of the tire is observed near the contact patch, the maximum deformation is nearly 0.02336 mm.
b) Slip angle test-
The slip angle test was conducted. The results were obtained for contact patch pressure, shear and deformation are as shown in Figure.4
Figure: 4(a) contact pressure Figure: 4(b) Shear stress Figure:4(c) Deformation
After varying the slip angle contact patch is shifted towards the left side of the tire, i.e towards the direction in which slip angle is varied. The maximum contact pressure is observed to be nearly 468.56 kPa and the max shear stress was observed to be nearly 155 kPa. The maximum deformation of the tire is observed in the tire region and the tire is deformed more in that direction in which slip angle is varied.
c) Camber test-
The camber test was conducted. The results were obtained for contact patch pressure,Shear and deformation are as shown in Figure:5 below-
After varying the camber angle contact patch is shifted towards the side in which the camber angle is varied. The maximum contact pressure is observed to be nearly 464.5 kPa and the max shear stress was observed to be nearly 145.8 kPa. The maximum deformation of tire is observed near the contact patch.
1.2 Styrene Butadiene Rubber (SBR) :
The rubber material is changed to Styrene Butadiene Rubber (SBR) and then simulations were conducted. The Braking, Slip angle and Camber test were conducted.
a) Braking
The results were obtained for contact patch pressure, shear and deformation are as shown in Figure.6.
Figure: 6(a) contact pressure Figure: 6(b) Shear stress Figure:6(c) Deformation
The trends of the results are similar to the natural rubber, but the magnitude of stress and deformation are different. The maximum contact pressure is observed to be 455 kPa. The maximum shear stress is 452.2 kPa. The deformation is concentrated at the contact patch.
b) Slip angle-
The slip angle test was conducted. The results were obtained for contact patch pressure, shear and deformation are as shown in Figure.7.
Figure: 7(a) contact pressure Figure: 7(b) Shear stress Figure:7(c) Deformation
The maximum contact pressure is 515.5 kPa. The maximum shear stress is 148.7 kPa. The of the tire is more at the contact patch.
c) Camber-
Figure: 8(a) contact pressure Figure: 8(b) Shear stress Figure:8(c) Deformation
The maximum contact pressure is 479.6 kPa and the maximum shear stress is 186.5 kPa. The maximum deformation is observed at the contact patch but there is more deformation to the side where the camber is increased.
1.3 Acrylonitrile Rubber (ACN) :
The rubber material is changed to Acrylonitrile Rubber (ACN) and then simulations were conducted. The Braking, Slip angle and Camber test were conducted.
a)Braking :
The results were obtained for contact patch pressure, shear and deformation are as shown in Figure.9.
Figure: 9(a) contact pressure Figure: 9(b) Shear stress Figure:9(c) Deformation
The maximum contact pressure is observed to be 391.4 kPa. The maximum shear stress is 391.4 kPa. The deformation is concentrated at the centre of contact patch.
b) Slip angle-
The slip angle test was conducted. The results were obtained for contact patch pressure, shear and deformation are as shown in Figure.10.
The maximum contact pressure is 469.2 kPa. The maximum shear stress is 160.8 kPa. The deformation of the tire is more at the contact patch.
c) Camber-
The camber test was conducted. The results were obtained for contact patch pressure, shear and deformation are as shown in Figure: 11 below-
Figure: 11(a) contact pressure Figure: 11(b) Shear stress Figure:11(c) Deformation
The maximum contact pressure is 468.8 kPa and the maximum shear stress is 170.1 kPa. The maximum deformation is observed at the contact patch but there is more deformation to the side where the camber is increased.
2. Inflation pressure=300 kPa
2.1 Natural Rubber
Steady state rolling analysis was conducted on the tire made of natural rubber with increased pressure. Braking, Slip angle and Camber test were conducted.
a) Braking:
The braking test was conducted. The results were obtained for contact patch pressure, shear and deformation are as shown in Figure.12.
Figure: 12(a) contact pressure Figure: 12(b) Shear stress Figure:12(c) Deformation
b) Slip angle-
The slip angle test was conducted. The results were obtained for contact patch pressure, shear and deformation are as shown in Figure.15
Figure: 13(a) contact pressure Figure: 13(b) Shear stress Figure:13(c) Deformation
The maximum contact pressure is 516.4 kPa. The maximum shear stress is 146.3 kPa. The deformation of the tire is more at the contact patch.
c) Camber-
The camber test was conducted. The results were obtained for contact patch pressure, shear and deformation are as shown in Figure: 14 below-
Figure: 14(a) contact pressure Figure: 14(b) Shear stress Figure:14(c) Deformation
After varying the camber angle contact patch is shifted towards the side in which the camber angle is varied. The maximum contact pressure is observed to be nearly 496.6 kPa and the max shear stress was observed to be nearly 119.8 kPa. The maximum deformation of tire is observed near the contact patch.
2.2 Styrene Butadiene Rubber (SBR)
a) Braking-
The results were obtained for contact patch pressure, shear and deformation are as shown in Figure.15.
Figure: 15(a) contact pressure Figure: 15(b) Shear stress Figure:15(c) Deformation
The trends of the results are similar to the natural rubber, but the magnitude of stress and deformation are different. The maximum contact pressure is observed to be 534.4 kPa. The maximum shear stress is 545.3 kPa. The deformation is concentrated at the centre of contact patch.
b) Slip angle-
The slip angle test was conducted. The results were obtained for contact patch pressure, shear and deformation are as shown in Figure.16.
Figure: 16 (a) contact pressure Figure: 16(b) Shear stress Figure:16(c) Deformation
The maximum contact pressure is 579.3 kPa. The maximum shear stress is 195.4 kPa. The deformation of the tire is more at the contact patch.
c) Camber-
The camber test was conducted. The results were obtained for contact patch pressure, shear and deformation are as shown in Figure: 17 below-
The maximum contact pressure is 546.5 kPa and the maximum shear stress is 144 kPa. The maximum deformation is observed at the contact patch but there is more deformation to the side where the camber is increased.
2.3 Acrylonitrile Rubber (ACN)
The rubber material is changed to Acrylonitrile Rubber (ACN) and then simulations were conducted. The Braking, Slip angle and Camber test were conducted.
a) Braking-
The results were obtained for contact patch pressure, shear and deformation are as shown in Figure.18.
Figure: 18(a) contact pressure Figure: 18(b) Shear stress Figure:18(c) Deformation
The maximum contact pressure is observed to be 493.9 kPa. The maximum shear stress is 493.9 kPa. The deformation is concentrated at the centre of contact patch.
b) Slip angle-
The slip angle test was conducted. The results were obtained for contact patch pressure, shear and deformation are as shown in Figure.19.
Figure: 19(a) contact pressure Figure: 19(b) Shear stress Figure:19(c) Deformation
The maximum contact pressure is 544.1 kPa. The maximum shear stress is 168.4 kPa. The deformation of the tire is more at the contact patch.
c) Camber-
Figure: 20(a) contact pressure Figure: 20(b) Shear stress Figure:20(c) Deformation
The maximum contact pressure is 511.1 kPa and the maximum shear stress is 129.7 kPa.
V.RESULTSANDDISCUSSION
1) Braking:
Table 2: Results of braking test
Material Contact pressure(kPa) Shear stress(kPa) Inflation Pressure
Natural Rubber 374 365 200
SBR 455 452.2 200
ACN 391.4 391.4 200
Natural Rubber 484.4 472.4 300
SBR 534.4 545.3 300
ACN 493.9 493.9 300
The contact pressure and shear stress increases with increase in inflation pressure. The contact pressure and the shear stresses are least for Natural Rubber. The results of ACN and natural rubber are quite similar.
2) Slip angle:
Table 3: Result of slip angle test
Material Contact pressure(kPa) Shear stress(kPa) Inflation Pressure
Natural Rubber 468.5 155 200
SBR 515.5 148.7 200
ACN 469.2 160.8 200
Natural Rubber 516.4 146.3 300
SBR 579.3 195.4 300
ACN 544.1 168.4 300
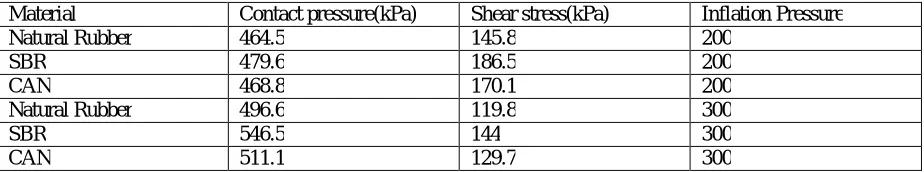
3) Camber:
Table 4: Result of camber test
Material Contact pressure(kPa) Shear stress(kPa) Inflation Pressure
Natural Rubber 464.5 145.8 200
SBR 479.6 186.5 200
CAN 468.8 170.1 200
Natural Rubber 496.6 119.8 300
SBR 546.5 144 300
CAN 511.1 129.7 300
In camber test after increasing the inflation pressure the contact pressure increases but the shear stress decreases. Again the natural rubber gives better performance than the other material.
VI. CONCLUSION
Simulations were done at different road conditions. From the results we can conclude the following parameters-
1) Least contact pressure and shear stress were generated in Natural rubber tire. It shows superior characteristics than the other two synthetic rubbers.
2) As the inflation pressure increases the contact patch size decreases, the reduction in the contact patch size leads to increase in contact pressure.
3) During braking the forces are transferred to the rear side of the contact patch, due to which in-symmetric contact pressure is generated.
4) As the vehicle slip angle increases the contact patch is deviated from the tire longitudinal axis to the side in which slip is occurring.
5) The contact patch of the tire is more deviated to that side in which camber is increased. 6) Shear stress in camber test decreases with increase in inflation pressure.
REFERENCES
[1] Olivier Le Maître, Manfred Sussner and Cesar Zarak, “Evaluation of Tire Wear Performance”, SAE Technical Paper Series, 980256, 1998. [2] Shahyar Taheri, Corina Sandu, and Saied Taheri Virginia Tech Finite Element “Modelling of Tire Transient Characteristics in Dynamic
Manoeuvres.”
[3] Chen Liang, Guolin Wang and Zhou Zheng ,Jiangsu University “An Effect Study of Passenger Car Radial Tire Contour Design Theory on Tire Force and Moment Properties.”
[4] Jin Changa, Hou Chenyuana and Jin Xiaoxionga “FE simulation of tire wear with complicated tread pattern” Procedia Engineering 15 (2011) 5015 – 5019
[5] William Blythe and Debra E. Seguin, “Friction, Tread Depth and Water; Laboratory Investigations of Passenger Car Tire Cornering Performance under Minimally Wet Conditions”, SAE Technical Paper Series, 01, 0789, 2013.
[6] Dihua Guan, L. H. Yam, Aiqian Zhang, Jin Shang “Modeling of Tire Rolling Properties by Using Experimental Modal Parameters”, SAE Technical Paper Series, 2000-01-0361.
[7] Cristobal Gonzalez Diaz , Peter Kindt, Jason Middelberg, Stijn Vercammen, Christophe Thiry, Roland Close, Jan Leyssens “Dynamic behaviour of a rolling tyre: Experimental and numerical analyses”, Elsevier- Journal of Sound and Vibration 364 (2016) 147–164
[8] Yi Xiong, Ari Tuononen “Rolling deformation of truck tires: Measurement and analysis using a tire sensing approach”, Elsevier-Journal of Terramechanics 61 (2015) 33–42.
[9] P. Kindt, P. Sas, W. Desmet “Measurement and analysis of rolling tire vibrations”, Elsevier- Optics and Lasers in Engineering 47 (2009) 443– 453.
[10] Sakthivel Palanivelu, Narasimha Rao K.V, Krishna Kumar Ramarathnam “Determination of rolling tyre modal parameters using Finite Element techniques and Operational Modal Analysis”, Elsevier- Mechanical Systems and Signal Processing 64-65 (2015) 385–402.
[11] Nobutaka Tsujiuchi, Takayuki Koizumi, Akira Oshibuchi “Rolling Tire Vibration Caused by Road Roughness” , SAE Technical Paper Series, 2005-01-2524.