99
Textural Changes in Carrot during Cooking
Alica Bobková
1, Marek Šnirc
2, Tomáš Fekete
1,
Ľubomír Belej
1*, Marek Bobko
2, Ivana
Mezeyová
3, Andrea Mendelová
4, Miroslava Hausová
1
Slovak University of Agriculture, Faculty of Biotechnology and Food Sciences, Department of Hygiene and Food Safety, Tr. A. Hlinku 2, 949 76 Nitra, Slovakia
2
Slovak University of Agriculture, Faculty of Biotechnology and Food Sciences, Department of Evaluation and Processing of Animal Products, Tr. A. Hlinku 2, 949 76 Nitra, Slovakia
3
Slovak University of Agriculture, Horticulture and Landscape Engineering Faculty, Department of Vegetable production, Tr. A. Hlinku 2, 949 76 Nitra, Slovakia
4
Slovak University of Agriculture, Faculty of Biotechnology and Food Sciences, Department of Storing and Processing of Plant Products, Tr. A. Hlinku 2, 949 76 Nitra, Slovakia
Abstract
The aim of the study was to evaluate textural changes in carrots during cooking and to find optimal cooking time of carrots. Using a TA.XT Plus Texture Analyser, texture profile analysis (TPA) of carrot hardness, springiness, cohesiveness, gumminess and chewiness after 5, 10, 15 and 20 minutes of cooking was performed. The highest value for hardness was observed in raw carrot (10167.5 g). The lowest value for hardness (1378.92 g) was observed after 20 minutes of thermal processing. Using the Analysis of Covariance (ANCOVA), it was found out how carrot hardness during cooking varies with the other textural parameters from TPA analysis. The coefficient of determination was 0.9955 and it explained 99.55% of total variability for the TPA analysis results. The highest differences in hardness were observed in the first 5 minutes of cooking. The significance of the model was determined by The Fisher´s F test. The probability corresponding to the F value was lower than 0.0001, it would be taking a lower than 0.01% risk in assuming that there was no effect of the explanatory variables. The results implied that the optimal cooking time of carrots lies in range of 10 and 15 minutes.
Keywords: Carrot, cooking, hardness, TPA analysis
1. Introduction
Carrots in Slovak Republic are among most popular root vegetables. It is the most important crop of Apiaceae family. Members of this family have small, mostly white, 5-parted flowers arranged in umbrella-like inflorescence called umbel [1].
Carrots contain nutrients that are needed by the body, especially vitamins and minerals [2].
It is an important source of dietary fiber, carotenoids, vitamin K and magnesium, as well as many other important nutrients. Carrot root
* Corresponding author: Ľubomír Belej, +421 37 641 4603, [email protected]
contains approximately 86–89% water, 0.7–0.9% protein, 0.2–0.5% fat, 6–10.6% carbohydrates, 1.2–3.6% dietary fiber and 1.2% ash. After harvest, carrot quality is gradually lowered by reducing their sweetness, content of the carotenoids and also by forming a bitter taste and unpleasant smell due to oxidation processes. During storage, carrot also loses firmness, changes its colour and covers with a white coating. The result of these changes is lower acceptability of the product by the consumers [3].
100 damaged because of after harvested, this plan still doing respiration. The damage occurred during post-harvest is unavoidable. Therefore, the possibly efforts can be made by giving them the proper packaging [2].
Texture is one of the important quality attributes of raw [4] or thermally processed fruit and vegetables [5]. It is defined as “the sensory manifestation of food structure and its way of reacting to a force used” [6]. Texture can be defined as ‘the group of physical characteristics that arise from the structural elements of the food, sensed by the feeling of touch, related to the deformation, disintegration and flow of the food under a force and measured objectively by functions of mass, time and distance’ [5].
Changes in the composition of cell wall polymers may result from the action of hydrolytic enzymes, mostly pectinases, and the activities of these enzymes often increase during ripening of fruits. In carrots, research has been focused on pectinmethylesterase (PME) in relation to its influence on texture. Endogenous polygalacturonase (PG), which depolymerizes PME demethylated pectin molecules, occurs in low amounts in carrots. It, therefore, has a minor influence on the texture of carrots [7].
Textural changes during processing of fruits and vegetables are often intensive during processing [5].
In vegetables and fruits, thermal processing causes a pronounced degradation of the pectic polysaccharides resulting in reduced intercellular adhesion and consequently in increased softening [8].
Understanding the effect of processing on the chemistry of cell wall polymers, in relation to texture of the final product, is important issue. Cooking-induced softening of carrots is due to an initial loss of turgor followed by an increase in the ease of cell separation [9].
To reduce the losses caused by some of these cooking methods, mainly due to degradation at high temperatures and leaching into cooking water, different cooking techniques have been tried. An example is sous-vide cooking, which differs from traditional cooking mainly in that the product is vacuum-packed and cooked in a sealed plastic bag at lower temperatures. Unlike other products, such as meat, for which the temperature can be reduced to 65–70 °C, sous-vide cooking of vegetables must be performed at temperatures
closer to 100 °C. The cell walls of vegetables remain almost intact during sous-vide cooking, but they are softened by dissolution of the structural material that holds the cells together [7].
2. Materials and methods
Nine discs of carrot with an approximate height of 10 mm were taken; three from the upper part of the carrot root, three from the middle part, and three from the lower part. Height of each carrot disc was measured using a Vernier scale. The discs were put in a sufficiently large volume (about 1.5 L for 9 discs) of boiling water (100 °C) for 5, 10, 15, and 20 min. After heat treatment, they were immediately submersed in cold tap water for a few minutes, after which discs were put on the paper towel to soak up the water according to [11].
TPA was performed to measure cooked carrot hardness, springiness, cohesiveness, gumminess and chewiness, at the same time. Carrot disc was placed on the heavy-duty platform (HDP/90) and compressed twice with a 35 mm diameter stainless steel cylinder, using a 50 kg load cell. Instrumental settings taken from the sample project (TPA.PRJ) of the software package (Texture Exponent Software TEE32, version 6.0.6.0, Stable Micro Systems, England, UK) were modified so that the cylinder compressed the discs to 30% of their height (strain 30%) [9]. Therefore, the probe height had been calibrated to 15 mm before this test was performed.
Texture analysis of carrot was conducted using a TA.XT Plus Texture Analyser (Stable Micro Systems, England, UK). Measurements were performed on three carrots from each sample, using a 50 kg load cell.
All statistical analyses were performed using XLSTAT (Addinsoft, 2016) software.
3. Results and discussion
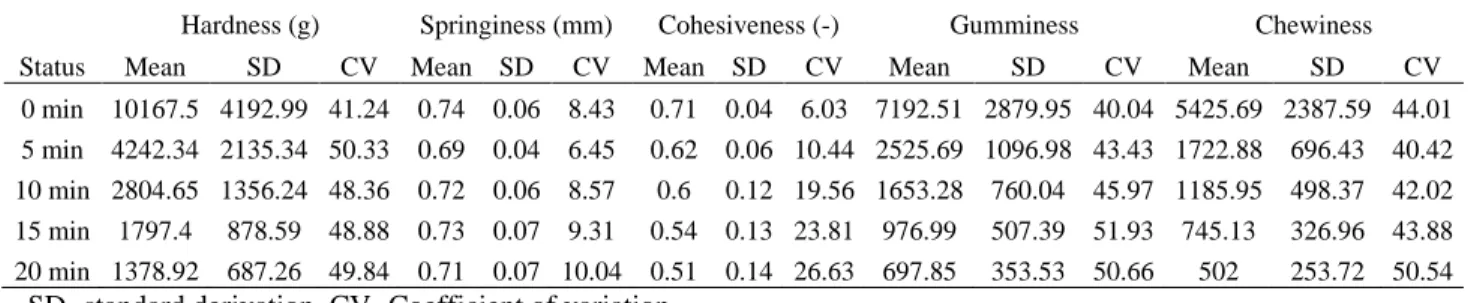
101 coefficients of variation were higher than 30%, such as coefficients of variation for hardness in all cooking procedure. The value of gumminess degreased from 7192.51 (0 min) to 697.85 (20 min). The value of chewiness degreased from 5425.69 (0 min) to 502.00 (20 min). Figure 1 shows the mean chart of parameter hardness during 20 minutes of cooking. Belović et al., [11] found, that chewiness determined by TPA test is the least suitable parameter for determining
cooked carrot texture because of very high CVs and low discrimination between different cooking times. Penetration test, which differentiated 10th and 15th min of cooking of carrot is the most suitable for determining the texture of fresh carrots [12]. However, penetration tests should be performed in the same measuring point in order to decrease the variation between the measurements [11, 13].
Table 1. Results from TPA analysis
Status
Hardness (g) Springiness (mm) Cohesiveness (-) Gumminess Chewiness
Mean SD CV Mean SD CV Mean SD CV Mean SD CV Mean SD CV
0 min 10167.5 4192.99 41.24 0.74 0.06 8.43 0.71 0.04 6.03 7192.51 2879.95 40.04 5425.69 2387.59 44.01 5 min 4242.34 2135.34 50.33 0.69 0.04 6.45 0.62 0.06 10.44 2525.69 1096.98 43.43 1722.88 696.43 40.42
10 min 2804.65 1356.24 48.36 0.72 0.06 8.57 0.6 0.12 19.56 1653.28 760.04 45.97 1185.95 498.37 42.02 15 min 1797.4 878.59 48.88 0.73 0.07 9.31 0.54 0.13 23.81 976.99 507.39 51.93 745.13 326.96 43.88 20 min 1378.92 687.26 49.84 0.71 0.07 10.04 0.51 0.14 26.63 697.85 353.53 50.66 502 253.72 50.54
SD- standard derivation, CV- Coefficient of variation
Using the Analysis of Covariance (ANCOVA), it was found out how carrot hardness during cooking varies with the other textural parameters from TPA analysis (springiness, cohesiveness, gumminess, chewiness). The table 2 displays the goodness of fit coefficients of the model. The R2 (coefficient of determination) indicates the % of variability of the dependent variable (hardness) which is explained by the explanatory variables (springiness, cohesiveness, gumminess, chewiness). The coefficient of determination was 0.9955 and it explained 99.55% of total variability for the TPA analysis results. The highest differences in hardness were observed in the first 5 minutes of cooking. For comparison, Belie et al. [14] found out that hardness decreases exponentially during first 15 minutes of cooking. Besides, hardness and crispness were positively and very strongly correlated (r2 = 0.980). Moreover, PCA analysis of the data implied that cooking up to first 5 minutes is crucial for a range of structural changes that occur during heat treatment of the carrot. In the paper published by Belović et al. [11], all texture parameters showed significant change between 5th and 10th minutes of cooking. However, none of them changed significantly between 15th and 20th minutes, indicating that optimal cooking time of carrots lies between 10 and 15 minutes. The results correspond with those obtained in present study.
Figure 1.Mean chart of hardness during cooking
Table 2.Goodness of fit statistic
Observations 106
Sum of weights 106
DF 98
R2 0.9955
Adjusted R2 0.9952
MSE 75478.57
RMSE 274.73
102 The table 3 displays the results of the analysis of variance which determine whether the explanatory variables bring significant information for the model. The Fisher´s F test was used. The probability corresponding to the F value was lower than 0.0001, it would be taking a lower than 0.01% risk in assuming that there was no effect of the explanatory variables. The variables of TPA analysis do bring a significant amount of information for the model. The critical F value was 3127.05.
In the Table 4 are placed the parameters of the model. The p-value for the Status-05 in parameter is 0.59 and the confidence range for the Status- 20 min is 0. There is weak impact of the TPA analysis data after 5 minutes of cooking and the status of the TPA analysis data after 20 minutes of cooking. The strongest impact for the model had
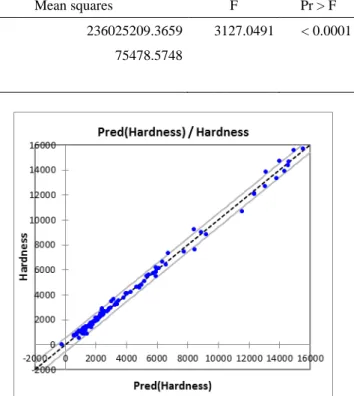
explanatory textural variables and the raw textural data (Status-0 min). The figure 2 shows the predicted values versus the observed values for parameter hardness with the 95% confidence interval.
Figure 2. Observed values versus the predicted values for parameter hardness
4. Conclusions
Texture profile analysis is a suitable instrumental method for determining the textural characteristics of cooked carrots. Textural changes during cooking can help to find the optimal cooking time. Experiments should be conducted on larger number of carrot varieties to draw general conclusions. Results should be correlated with texture profile evaluated by a trained panel. Table 3.Results of ANOVA analysis
Source DF Sum of squares Mean squares F Pr > F
Model 7 1652176465.561 236025209.3659 3127.0491 < 0.0001
Error 98 7396900.3334 75478.5748
Corrected Total 105 1659573365.8945
Table 4. Model parameters for TPA analysis results
Source Value Standard error t Pr > |t| Lower bound
(95%)
Upper bound (95%)
Intercept 1609.5676 148.7095 10.36 < 0.0001 1314.4584 1904.6769
Cohesiveness -2655.5901 262.8372 -10.1036 < 0.0001 -3177.1819 -2133.9983
Gumminess 2.03 0.1088 25.2707 < 0.0001 2.43 2.63
Chewiness -1.5835 0.1369 -11.5667 < 0.0001 -1.8552 -1.3119
Status-0 min -742.2848 157.1756 -4.7226 < 0.0001 -1054.1946 -430.375
Status-05 min 53.7581 101.382 0.5303 0.5971 -147.4311 254.9474
Status-10 min 117.9266 90.5793 1.19 0.196 -61.8251 297.6783
Status-15 min 122.1407 85.3467 1.11 0.1556 -47.227 291.5084
103 References
1. Bystrická J, Kavalcová P, Musilová J, Vollmannová A, Tóth T, Lenková M., Carrot (Daucus carota L. ssp. sativus (Hoffm.) Arcang.) as source of antioxidants. Acta agriculturae Slovenica. 2015, pp. 303-311. doi:10.14720/aas.2015.105.2.13.
2. Albaar N, Budiastra I, Hariyadi Y., Influence of Secondary Packaging on Quality of Carrots During Transportation. Agriculture and Agricultural Science Procedia. 2016,pp. 348-352. doi:10.1016/j.aaspro.2016.02.149.
3. Nowacka M, Wedzik M., Effect of ultrasound treatment on microstructure, colour and carotenoid content in fresh and dried carrot tissue. Applied Acoustics. 2016, pp. 163-171. doi:10.1016/j.apacoust.2015.06.011.
4. Bobková A,Šnirc M,Král M, Ošádalová M, Pokorná J, Fekete T,Belej Ľ., Texture quality of muskmelons (Cucumis melo L.) from different retailers during storage. Potravinarstvo, 2016, pp.578-584
5.Vu T, Smout C, Sila D, LyNguyen B, Van Loey A, Hendrickx M., Effect of preheating on thermal degradation kinetics of carrot texture. Innovative Food Science & Emerging Technologies. 2004, pp.37-44. doi:10.1016/j.ifset.2003.08.005.
6. Xu C, Yu C, Li Y., Effect of blanching pretreatment on carrot texture attribute, rheological behavior, and cell structure during cooking process. LWT - Food Science and Technology. 2015, pp. 48-54. doi:10.1016/j.lwt.2015.01.033.
7. Guillén S, Mir-Bel J, Oria R, Salvador M., Influence of cooking conditions on organoleptic and health-related properties of artichokes, green beans, broccoli and carrots. Food Chemistry. 2017, pp. 209-216. doi:10.1016/j.foodchem.2016.08.067.
8. Deroeck A, Sila D, Duvetter T, Vanloey A, Hendrickx M., Effect of high pressure/high temperature processing on cell wall pectic substances in relation to firmness of carrot tissue. Food Chemistry. 2008, pp. 1225-1235. doi:10.1016/j.foodchem.2007.09.076. 9. Ng A, Waldron K., Effect of Cooking and Pre-Cooking on Cell-Wall Chemistry in Relation to Firmness of Carrot Tissues. Journal of the Science of Food and Agriculture. 1997, pp. 503-512. doi:10.1002/(sici)1097-0010(199704)73:4<503::aid-jsfa762>3.0.co;2-z.
10. Peng J, Tang J, Barrett D, Sablani S, Powers J., Kinetics of carrot texture degradation under pasteurization conditions. Journal of Food Engineering. 2014, pp. 84-91. doi:10.1016/j.jfoodeng.2013.09.004. 11. Belović M, Psetorić M, Mastilović J, Kevrešan Ž., Changes in carrot texture during cooking, Journal on Processing and Energy in Agriculture, 2014, pp. 36-39 12. Pestorić, M, Belović M., Mastilović J, Kevrešan Ž., Different instrumental methods for measuring the textural characteristics of fresh carrots. Proceedings of the III International Congress “Engineering, Environment and Materials in Processing Industry”, Jahorina, Bosnia and Herzegovina, 2013, pp. 755-763.
13. Bajkin, A., Ponjičan, O., Babić, M., Radomirović, D., Dedović, N., Radojčin, M., Interaction between carrot root dimensions and puncture force. Journal on Processing and Energy in Agriculture (former PTEP), 2011, pp. 59-62.