Pittaya Phamonvaechavan, M.D., Ratchapong Nitiapinyasagul, M.D.
Department of Ophthalmology, Faculty of Medicine Siriraj Hospital, Mahidol University, Bangkok 10700, Thailand.
A Comparison between Effect of Viewing Text on
Computer Screen and iPad
®
on Visual Symptoms
and Functions
Correspondence to: Pittaya Phamonvaechavan E-mail: [email protected]
Received 2 December 2016 Revised 10 February 2017 Accepted 14 February 2017 doi:10.14456/smj.2017.37
ABSTRACT
Objective: To compare the ocular symptoms following sustained near vision between laptop computer and iPad®. Methods: Forty normal subjects read text from a laptop computer screen and an iPad® screen for a continuous 20 min period. Similar text was used in both sessions, which was matched for size and contrast. After finishing viewing text, subjects immediately completed a written questionnaire categorizing symptom scores into three groups: Dry eye, Pain and Blurred vision score. The accommodative amplitude and fusional convergence amplitude at near vision were also assessed before and after reading.
Results: In both conditions, mean symptom scores were higher during iPad use. When comparing the computer and iPad conditions, mean scores were statistically significant different in Pain score (6.30 vs 8.70; p=0.025) and Blurred vision score (10.13 vs 12.03; p=0.041) but no statistically significant difference in Dry eye score (6.30 vs 6.60; p=0.71). There were significant change in accommodative amplitude and fusional convergence amplitude with near vision when compared before and after near-vision tasks in both cases.
Conclusion: Pain and Blurred vision symptoms following sustained iPad use were significantly worse than those reported after computer use under similar viewing conditions. However, both computer screen and iPad cause ocular symptoms having an impact on quality of life.
Keywords: Computer vision syndrome; iPad®; eyestrain (Siriraj Med J 2017;69: 185-189)
INTRODUCTION
Computers and modern electronic devices such as smartphones, and tablets are extensively used for many purposes including email, entertainment and internet access is now in modern daily life. Recently, estimation of internet usage ranged from 49.6% of Asia to 8.8% of North America with an estimated 3,611,375,813 users worldwide (or 49.5% of the world’s population).1 Several
investigators have indicated that as many as 90% of people working on computer tasks encounter both ocular and non-ocular computer-related symptoms.2,3 These
symptoms may be associated with non-ocular problems including setup of equipment or ocular problems such as refractive error, accommodation to the computer screen,4-8 or convergence fatigue.4,8
Nowadays design of digital electronic devices is not only limited to desktop computers, but probably includes laptop computers, tablets and smartphones which can operate in any location. Various ocular symptoms from increased use of computers have been termed computer vision syndrome (CVS). CVS is defined by the American Optometric Association as the combination of eye and vision problems associated with the use of computers such as eyestrain, ocular discomfort, headache, dry eye sensation, and blurring at near and double vision.4,7,9
This condition has a significant impact not only on visual symptoms, but also occupational productivity.10
population. Advantages of iPad® over computer are lightweight, portabile, less expensive and other functions. Although iPad® has less functions than a computer, it seems likely that iPad® usage is more convenient because of flexibility and other functions such as internet access, GPS navigation, social networking, etc. However, both machines can cause ocular symptoms and reduce capability. Therefore, the aim of this present study is to compare the ocular symptoms after near-vision task between desktop computer and iPad® as well as accommodative and convergence ability at near vision.
MATERIALS AND METHODS
This study was carried out as experimental clinical research and was approved by the Committee for the Protection of Human Participants in Research at the Faculty of Medicine Siriraj Hospital, Mahidol University, Bangkok, Thailand (Si. 530/2011). All informed consents were obtained before initiating the study.
Forty visually-normal subjects having a range age of 18-30 years were enrolled in this study. All subjects had habitual visual acuity of at least 6/6 in each eye. Demographic data including sex, age, underlying diseases, and ocular problems were recorded. Subject with history of strabismus, amblyopia, and other ocular diseases such as cataract, glaucoma, retinal diseases or previous ocular surgery were excluded from this study. Visual acuity testing of each eye was performed by using ETDRS4
chart.
Before starting to read the text, accommodative amplitude was measured by one eye looking at a near
chart from 50 cm then slowly moving the near chart close to the eye until the subject saw blur. This distance from eye to near chart was converted to diopters. Fusional convergence amplitude at near vision was performed by placing base-out prism in front of either eye while subject was looking at near chart and then the amount of prism was gradually increased until subject saw double. The amount of prism that was just less than one before subject saw double was defined as fusional convergence amplitude at near vision.
Each subject was required to read text either from a computer screen (Dell computer with 17” flat panel monitor) or an iPad® screen in random order at a viewing distance of 50 cm for a continuous 20-min period. The computer text was displayed using Microsoft Word Software with the monitor set at a pixel setting of 1,024 by 768 the text was Angsana UPC font of 14 point size with a contrast of approximately 60%. Identical passages were used in both sessions, which was matched for size and contrast. The order of the conditions was counterbalanced (with alternate subjects performing either the computer or iPad® condition first), and the two sessions for each subject were separated by a period of at least 24 hours. After each reading session, subjects immediately completed a questionnaire. The 10-symptom questions score were categorized into three groups: Dry eye, Pain and Blurred vision score as shown in Fig 1. Visual acuity, accommodative amplitude and fusional convergence amplitude at near vision were measured after completing the questionnaire.
1, 2, 3, 9 Blurred vision score 4,5,10 Dry eye score 6, 7, 8 Pain score
Fig 1. Questionnaire administered to subjects immediately following the reading task.
1. Blurred vision while viewing the text 0 1 2 3 4 5 6 7 8 9 10 2. Blurred vision when looking into the distance at the end 0 1 2 3 4 5 6 7 8 9 10
of the near task
3. Difficulty in refocusing my eyes from one distance to another 0 1 2 3 4 5 6 7 8 9 10 4. Irritated or burring eyes 0 1 2 3 4 5 6 7 8 9 10
5. Dry eyes 0 1 2 3 4 5 6 7 8 9 10
6. Eye strain 0 1 2 3 4 5 6 7 8 9 10
7. Headache 0 1 2 3 4 5 6 7 8 9 10
8. Tired eyes 0 1 2 3 4 5 6 7 8 9 10
9. Double vision while viewing the text or at the end 0 1 2 3 4 5 6 7 8 9 10 of the near task
Statistical computations were performed with Statistical Package for the Social Sciences software, version 11.0 (SPSS Inc., Chicago, IL, USA). Continuous data were expressed as mean and standard deviation, and median, minimum and maximum. Number and percentage were described for categorical data. Wilcoxon Signed Ranks test was used to compare continuous data between two groups.
RESULTS
Forty subjects, 31 female and 9 male with mean age 25.9 years old, were enrolled in this study. There
was no dropout subject. Table 1 shows mean symptom scores immediately following a near vision viewed either on a computer or an iPad® screen. Symptom of pain score in iPad® was statistically significant higher than computer screen (iPad® 8.7 ± 8.19, computer 6.30 ± 6.93, p = 0.025). Also, symptom of blurred vision score was statistically significant higher in iPad® than computer screen (iPad® 12.03 ± 8.93, computer 10.13 ± 9.61, p = 0.041). However, symptom in dry eye score in iPad® was higher than computer screen but not statistically significant (iPad® 6.6 ± 7.09, computer 6.33 ± 6.90, p = 0.71).
TABLE 1. Mean symptom scores immediately following a near task viewed either on a computer or an iPad® screen.
TABLE 2. Changes in accommodative amplitude and fusional convergence amplitude at near before and after viewing text between iPad® and computer.
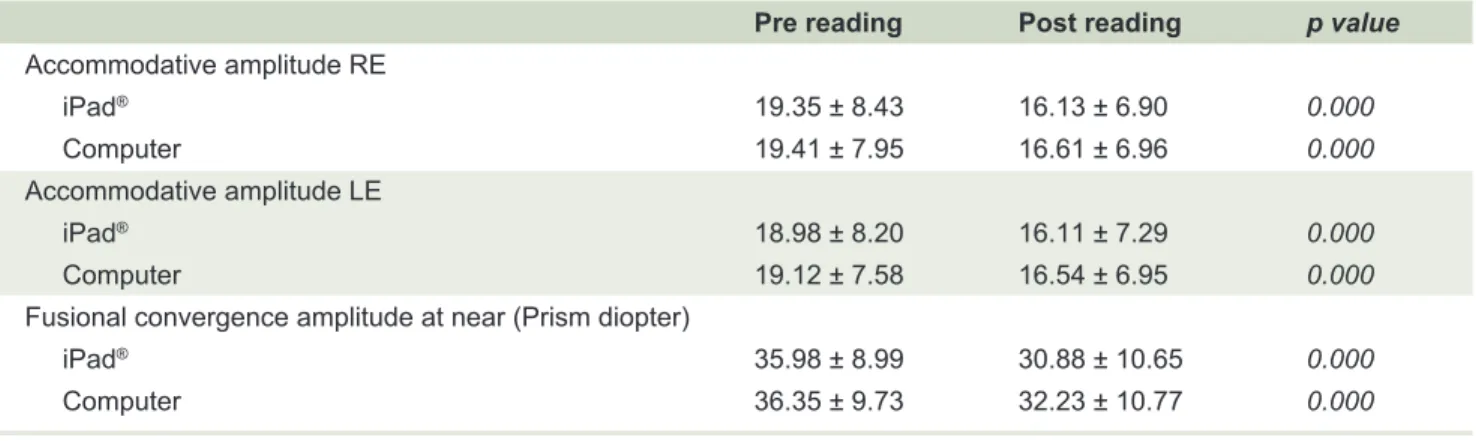
TABLE 3. Mean accommodative amplitude and fusional convergence amplitude at near before and after viewing text.
iPad® Computer p value
Dry eye score (mean ± SD ) 6.6 ± 7.09 6.33 ± 6.90 0.71
Pain score (mean ± SD ) 8.7 ± 8.19 6.30 ± 6.93 0.025
Blurred vision score (mean ± SD ) 12.03 ± 8.93 10.13 ± 9.61 0.041
Both accommodative amplitude and fusional convergence amplitude at near decreased after sustained reading text in both devices. However, when comparing accommodative amplitude before and after viewing the text, there was no statistically significant change between the two devices as shown in Table 2 ( p = 0.248 in right eye, p = 0.342 in left eye). Also, there was no statistically significant change in fusional convergence
amplitude at near vision when comparing both screen types (-4.13 ± 6.12 computer vs -5.10 ± 6.20 iPad®, p = 0.372). Significant change in accommodative amplitude and fusional convergence amplitude at near vision compared before and after near-vision task in both screens was demonstrated in Table 3 (p = 0.000). Changes in visual acuity after reading was not found in this study.
iPad® Computer p value
Accommodative amplitude
Right eye (mean ± SD ) -3.22 ± 2.53 -2.80 ± 4.26 0.248
Left eye (mean ± SD ) -2.87 ± 2.86 -2.58 ± 3.84 0.342
Fusional convergence amplitude at near (mean + SD) -5.10 ± 6.20 -4.13 ± 6.12 0.372
Pre reading Post reading p value Accommodative amplitude RE
iPad® 19.35 ± 8.43 16.13 ± 6.90 0.000
Computer 19.41 ± 7.95 16.61 ± 6.96 0.000
Accommodative amplitude LE
iPad® 18.98 ± 8.20 16.11 ± 7.29 0.000
Computer 19.12 ± 7.58 16.54 ± 6.95 0.000
Fusional convergence amplitude at near (Prism diopter)
iPad® 35.98 ± 8.99 30.88 ± 10.65 0.000
DISCUSSION
The present study compared ocular symptoms after viewing text on computer screen to iPad® screen and the result showed that all 3 ocular symptom scores following sustained iPad® use were significantly higher than those reported after computer use under similar viewing conditions especially Pain and Blurred vision scores. Several previous researches5,9,11-12 have demonstrated
various ocular symptoms resulting from use of computers and modern electronic devices. Rosenfield concluded that 64-90% of computer users experience visual symptoms such as eyestrain, dry eye, diplopia, and/or blurred vision after prolonged computer use.2 Also, the prevalence of
dry eye symptoms is greater during computer operation. Chu et al reported that symptoms following sustained computer use were significantly worse than those reported after hard copy fixation especially blurred vision during the task.12 To the author’s knowledge, no previous study
reported the effect of iPad® use on ocular symptoms and also compared the symptoms after prolonged use between computer and iPad®.
Computer vision syndrome (CVS) has many symptoms including eye and vision problems; for example, eyestrain, headaches, ocular discomfort, dry eye, diplopia and blurred vision after prolonged computer use.13 To
simplify the analysis of ocular symptom scores, this study categorized these into 3 ocular symptom scores: Dry eye, Pain and Blurred vision score. All 3-symptom scores in iPad® group were higher than in computer group, although only Pain and Blurred vision score were statistically significant higher during iPad® operation. The latter is probably due to screen size and reflection from iPad® screen. Although identical text was used in the two sessions, which was matched for size and contrast, screen size of computer was larger than of iPad® so subjects were able to see text more comfortably. Two reasons that iPad® screen had much more reflection than computer screen were more bright light from iPad® screen and glass used as material for iPad monitor has more reflection than computer monitor. Dry eye symptom was not statistically significantly different between two groups due to similar reading position to the screen in primary gaze resulting in corneal exposure; whereas other investigators showed significant difference in symptom scores following near-task viewed either on a computer monitor or in hard copy format.12 Another reason was the relatively short
duration of viewing text in this study (20 min) probably not enough to create dry eye symptoms. Additionally, young healthy subjects may have experienced a lower
effect of dry eyes. Thus, other eye examinations such as blink rate, completeness of blinks and examination of the tear film would also be useful in evaluating dry eye, but were beyond the scope of the present study.
The finding of this study indicated no statistically significant change in accommodative amplitude and fusion convergence amplitude at near vision between iPad® and desktop computer. This is consistent with previous reports noting only minimal differences in either accommodation or convergence responses between hard copy and computer viewing.14-18 Accommodative amplitude
and fusional convergence amplitude at near vision after reading text in both iPad® and computer significantly decreased compared to before reading in this current study because of sustained near-task viewing of text for a long period of time. This is contrary to several previous investigators, who have reported no significant change in near point of convergence and accommodation during computer task.16-19 Even though all subjects had normal
accommodation and fusional convergence amplitude, it was not possible to rule out other computer vision syndrome etiologies that might result from eye movement disorders or tear layer abnormalities. Therefore, vision-related symptoms can be caused by multiple etiologies rather than a single underlying cause.20
REFERENCES
1. Available from: http://www.internetworldstats.com/stats.htm. 2. Salibello C, Nilsen E. Is there a typical VDT patient? A demographic
analysis. J Am Optom Assoc 1995; 66: 479-83.
3. Rossignol AM, Morse EP, Summers VM, Pagnotto LD. Video display terminal use and reported health symptoms among Massachusetts clerical workers. J Occup Med 1987; 29: 112-8. 4. Lie I, Watten RG. VDT work, oculomotor strain, and subjective
complaints: an experimental and clinical study. Ergonomics 1994; 37: 1419-33
5. Wiggins NP, Daum KM. Visual discomfort and astigmatic refractive errors in VDT use. J Am Optom Assoc 1991; 62: 680-4.
6. Collins M, Davis B, Atchison D. VDT screen reflections and accommodation response. Ophthal Physiol Opt 1994; 14: 193-8.
7. Burns DH. Characteristics of visual display units that may cause visual difficulties. Ophthal Physiol Opt 1995; 15: 99-104. 8. Gur S, Ron S, Heicklen-Klein A. Objective evaluation of visual
fatigue in VDU workers. Occup Med (Lond) 1994; 44: 201-4. 9. Hayes JR, Sheedy JE, Stelmack JA, Heaney CA. Computer use,
symptoms, and quality of life. Optom Vis Sci 2007; 84: 738-44. 10. Daum KM, Clore KA, Simms SS, Vesely JW, Wilczek DD,
Spittle BM, et al. Productivity associated with visual status of computer users. Optometry 2004; 75: 33-47.
11. Rosenfield M. Computer vision syndrome: a review of ocular causes and potential treatments. Ophthal Physiol Opt 2011; 31: 502-15.
12. Chu C, Rosenfield M, Portello JK, Benzoni JA, Collier JD. A comparison of symptoms after viewing text on a computer screen and hardcopy. Ophthal Physiol Opt 2011; 31: 29-32. 13. Thomson DW. Eye problems and visual display terminals - the
facts and the fallacies. Ophthal Physiol Opt 1998; 18: 111-9. 14. Wick B, Morse S. Accommodative accuracy to video display
monitors. Optom Vis Sci 2002; 79s: 218.
15. Penisten DK, Goss DA, Philpott G, Pham A, West RW. Comparisons of dynamic retinoscopy measurements with a print card, a video display terminal, and a PRIO system tester as test targets. Optometry 2004; 75: 231-40.
16. Nyman KG, Knave BG, Voss M. Work with video display terminals among office employees. Scand J Work Environ Health 1985; 11: 483-7.
17. Yeow PT, Taylor SP. Effects of short-term VDT usage on visual functions. Optom Vis Sci 1989; 66: 459-66.
18. Yeow PT, Taylor SP. Effects of long-term visual display terminal usage on visual functions. Optom Vis Sci 1991; 68: 930-41. 19. Jaschinski-Druza W. Fixation disparity at different viewing
distances of a visual display unit. Ophthal Physiol Opt 1993; 13: 27-34.