Crowdsourcing for Query
Processing on Web Data: A Case
Study on the Skyline Operator
Kinda El Maarry, Christoph Lo
fi
and Wolf-Tilo Balke
Technische Universit¨at Braunschweig, Braunschweig, Germany
In recent years, crowdsourcing has become a powerful tool to bring human intelligence into information pro-cessing. This is especially important for Web data which in contrast to well-maintained databases is almost always incomplete and may be distributed over a variety of sources. Crowdsourcing allows to tackle many problems which are not yet attainable using machine-based algo-rithms alone: in particular, it allows to perform database operators on incomplete data as human workers can be used to provide values during runtime. As this can be-come costly quickly, elaborate optimization is required. In this paper, we showcase how such optimizations can be performed for the popular skyline operator for preference queries. We present some heuristics-based approaches and compare them to crowdsourcing-based approaches using sophisticated optimization techniques while especially focusing on result correctness.
Keywords: incomplete web data, preference queries, skyline queries, crowdsourcing
1. Introduction
Crowdsourcing has become a popular approach to many problems of the Web that cannot be eas-ily addressed by automated methods and algo-rithms, or problems that explicitly require sig-nificant amount of human intelligence or human feedback. Here, human workers are recruited to perform small tasks, usually in exchange for monetary compensation. Crowdsourcing can be applied to a multitude of different problems from artificial intelligence to e-commerce. Here crowd-enabled data processing [1] demands a special mention as it tackles a frequently re-occurring problem in modern information sys-tems: allowing to perform database operators
So far, whenever the underlying dataset is in-complete, only simple heuristics are used to de-cide whether a tuple is dominated by another with respect to the Pareto semantics. Typically, such heuristics range from: assuming some de-fault value for missing attributes, slightly alter-ing the definition of Pareto dominance seman-tics, or to deciding the Pareto test with some de-fault result. Moreover, the main focus of these heuristics is again on efficient computation, and no particular attention is paid to the “quality” and “correctness” of the resulting skyline set. Therefore, in this paper, we discuss the chal-lenging question of how to run skyline queries on incomplete datasets while focusing on high result quality. To address this question, we thor-oughly present two different approaches. • Advanced heuristic approach: In contrast to
other heuristics, this heuristic approach fo-cuses on the correctness of a skyline. Ac-cordingly, the main aim is to compute a sky-line result that resembles the skysky-line which would have been computed had the underly-ing dataset been complete as closely as pos-sible. Typically, the correctness of a skyline degrades when relying on heuristics for de-ciding Pareto dominance as some tuples will be: 1) wrongfully included in the skyline result (false positives), or 2) left out when they ought to be in the skyline(false nega-tives). Identifying false negatives and rein-troducing them into the skyline would not only improve the recall of the skyline, but also the precision, since the introduced false negatives would in turn dominate the false positives. Therefore, the advanced heuris-tic focuses on identifying false negatives for reintroducing them into the skyline.
• Crowd-based approach: This approach is based oncrowd-enabled databasesfor com-pleting values of incomplete tuples during runtime. Instead of naively crowdsourcing all missing data, we aim at selective hy-brid approaches which rely on crowdsourc-ing only those tuples where heuristics will most likely introduce errors, but fall back to using(cheap)heuristics when their applica-tion is safe. We present two different strate-gies, as studied in previous works a) sur-rogating missing data with predicted values
[2], b) surrogating missing data with min-max values[3].
This paper mainly summarizes and unifies pre-vious work discussed in [2] and [3], but also provides new insights, especially with respect to processing skylines heuristically. The rest of this paper is organized as follows: in the next section we discuss related work and give an overview of the theoretical foundations of sky-line queries. In Section 3 we introducecommon heuristicsfor handling incomplete data and their effect on the result’s quality. This is followed in Section 4 with a detailed and extensive de-scription of the two proposed approaches. Ex-periments are carried out in Section 5, and we finally conclude with a summary.
2. Foundations and Related Work
In the following, we present the theoretical foundations of skyline queries on incomplete datasets. Furthermore, we introduce how the quality of a skyline result set for incomplete datasets can be measured, which allows us to evaluate both commonly used heuristics and our proposed approaches. For the crowd-based ap-proach, we give an overview on crowd-enabled databases.
2.1. Crowdsourcing
Crowdsourcing has become a popular approach to many problems that cannot be easily ad-dressed by automated methods and algorithms, or problems that explicitly require significant amount of human intelligence or human feed-back.
for example, recommender systems which uti-lize the input provided by the crowd [Be07]. Thus, the Social Web is also based on an ex-tensive, but mostly uncontrolled crowdsourcing effort. We will use a much narrower definition of crowdsourcing in the course of this paper: We will only focus on explicit crowdsourcing for general tasks based on controlled task ex-ecution as provided by Web services such as Amazon’s Mechanical Turk, CrowdFlower, or ClickWorker, bringing crowdsourcing more in line with alternative concepts of ‘work’. These Web platforms allow a complex task to be exe-cuted by dividing it into many smaller and sim-pler sub-tasks, i.e., HITs (Human Intelligence Tasks) – the smallest unit of crowdsourceable work, which are distributed to a human worker pool. In these platforms, workers are recruited and retained with payment, and the platform it-self acts as a marketplace for different tasks and jobs. Hence, in theory, such platforms can be used to perform any divisible tasks that require human intelligence.
These platforms have successfully been used by researchers from many different domains and knowledge processing tasks, e.g., disaster re-sponse[4], providing training data for machine-learning-based approaches [5], or performing large scale user studies for evaluating new pro-totype implementations [6], or performing sur-veys with a large and diverse number of partici-pants for investigating general human behavior or preferences[7].
One of the main issues related to crowdsourc-ing is output quality[8][9][10]. Incentive mech-anisms are also tightly linked to quality [11]. Different scenarios may require different incen-tive mechanisms. For instance, an industrial environment may require to provide economic incentives to motivate the crowd to perform cer-tain tasks. The work presented in[12]presents some results that confirm the importance of money compared to other motivations in cer-tain domains. The crowdsourcing scenarios dis-cussed in this paper, i.e. completing of incom-plete data records, is luckily one of the easiest scenarios with respect to quality management. As our scenario is only concerned with factual data that can be looked up on the Web without requiring expert knowledge(e.g., product spec-ifications, telephone numbers, addresses, etc.),
effective and simple quality control techniques like majority voting or Gold sampling, where questions whose known answers are injected in the HIT, [13] can be applied. Previous stud-ies on crowdsourcing have shown that within certain bounds, missing values in database tu-ples can be elicited with reliable efficiency and quality as long as the information is generally available. For example,[13]reports that crowd-sourced manual look-ups of movie genres in IMDB.com are correct in ∼ 95% of all cases with costs of $0.03 per tuple(including quality assurance). Therefore, while quality issues are a severe concern for crowdsourcing in general, in this paper we simply assume that established quality control techniques are sufficient.
2.2. Skyline Queries and Incomplete Data
Definition 1 (Numerical Preferences and Pareto Dominance): A numerical preference Pi
over attribute Ai with a numerical domain Diis a total order over Di. If attribute value a ∈Di
is preferred over value b ∈ Di, then(a,b)∈ Pi,also written as a >i b(“a dominates b wrt. to
Pi”). Analogously, we define ab for a >
∼ib or a =i b.
We define the concept of Pareto dominance t1 >P t2 between tuples t1, t2 ∈D1×. . .×Dn by
t1>
∼it2with respect to all attributes, and t1dominates t2with respect to at least one attribute:
t1 >P t2⇐⇒ ∀i∈ {1, . . . ,n}:t1> ∼it2
∧∃i ∈ {1, . . .n}:t1 >it2
A skyline query is given by a set of preferences P={P1, . . . ,Pn},with one preference for each
attribute. Accordingly, on the complete dataset R and a set of preferences P, the skyline sky is defined as:
sky :=skyline(R,P) ={t1∈R| ∃t2∈R:t2>P t1}
On the other hand, when a dataset is incomplete, as is often the case in Web sources, the test for Pareto dominance cannot be directly performed, and no skyline can be computed without relying
Definition 2 (Incomplete Dataset). An incomplete dataset R is an instance of a database relation R⊆D1×. . .×Dnon n attributes A1, . . . ,Anwith Dias domain of attribute Aiusing
to denote a missing value, i.e. Di =Di∪ {}. Each tuple t is denoted by t:= (t1, . . . ,tm).
For each tuple, at least one attribute value is known. The subset of all complete tuples RCis given by
RC :={t∈R| ∀i∈ {1, . . . ,m}:ti= }
and the incomplete tuples are denoted as RI :=R\RC.
2.3. Measuring Skyline Errors
For measuring the error introduced by a heuris-tic used in the case of missing information, we compare the skyline set obtained by heuristic handling to the set that would have been ob-tained had all information been available (i.e. compared to the skyline of the complete dataset). Basically, each heuristically handled tuple can be one of four cases: true positive (tuple is correctly included in the skyline), true nega-tive (tuple is correctly excluded from the sky-line), false positives (tuple is included in the skyline, but if all values had been available, it would have been excluded. This can result from the heuristic over-estimating the missing values, or from under-estimating another tuple, which under complete information would not
on additional heuristics. An incomplete dataset can be defined as follows, where missing values are denoted by .
have been dominated, but now fails to do so due to heuristic handling), false negatives ( analo-gous to false positives, an incorrectly excluded tuple resulting from under-estimating this tuple or over-estimating another one).
Definition 3 (Skyline Error): Let skyHbe a skyline computed by a chosen heuristic applied to
an incomplete dataset, and skyR be the real skyline computed from the complete dataset. The
error between both sets is given by (some arguments omitted):
error(skyH,skyR) =1−informdness(..)
inform.(skyH,skyR) =recall(..) +invRecall(..)−1
recall(skyH,skyR) = #truePositives(..)
#truePositives(..) +#falseNegatives(..)
invRecall(skyH,skyR) = #trueNegatives(..)
#trueNegatives(..)+#falsePositives(..)
3. Simple Skyline on Incomplete Data
In this section we take a close look at commonly used heuristics that have been so far utilized to support skyline computation on incomplete datasets. This allows us to select a suitable base heuristic for further improvement. For self-containment, we present the evaluation as carried out in previous work[3].
3.1. Basic Heuristics
For handling missing information in skyline computation, several commonly used basic heu-ristics are at hand, which provide default han-dling for the Pareto dominance test. These heuristics can be classified into two general cat-egories, optimistic and pessimistic heuristics. Pessimistic heuristics assume that missing val-ues actually mask inferior valval-ues, and incom-plete tuples will rarely be part of the skyline. In contrast, optimistic heuristics assume that in-complete tuples might actually be very good, and thus often promote them to be part of the skyline to avoid missing out on any potential good candidate.
We evaluated these heuristics on the same data-sets which we used for all other experiments in this paper. We will abstain from experimenting with synthetic data, and evaluate instead using three real-world datasets from the area of sports and e-commerce for judging the performance of heuristics under realistic circumstances. Like most real life datasets, our practical datasets also show a higher degree of correlation. All our datasets were originally complete, and their values were artificially removed for the experi-ments. The datasets are:
1. The NBA dataset contains the NBA player statistics and has been frequently used within skyline research. The dataset comprises 21,961 tuples. For each player, only the following 5 attributes were retained: games played, points scored, rebounds, assists, and goals. With maximum preferences used for all attributes, a skyline of 75 tuples is yielded.
2. Anotebooks datasetwhose data was crawled from Dooyoo.de back in 2010. The dataset is made up of a total of 1,697 tuples, consisting of 6 attributes: CPU frequency, CPU type
(categorical preference encoded by a score), RAM, HD, display size, weight (minimum preference). Unless stated otherwise, maxi-mum preferences were used, yielding a sky-line of 35 tuples.
3. A cars dataset holding information about different car models. The data crawled in 2011 from Heise.de spans over 7,755 tu-ples of 6 attributes; price, power(maximum preference), acceleration(maximum prefer-ence), fuel consumption, CO2 emission and
taxes. Minimum preferences were used un-less explicitly stated otherwise, resulting in a skyline of 268 tuples.
Using these datasets, we covered the following heuristics(more detail about the result quality can be found in[3]):
will result in both false negatives and false posi-tives. In our evaluation, this heuristic shows er-ror rates which are consistently worse than the pessimistic surrogation heuristic, but are con-siderable better than ISkyline or optimistic sur-rogation.
Treat incompleteness as incomparable: This conservative optimistic heuristic aims at min-imizing false negatives, i.e. no tuple should be excluded from the skyline unless it can be clearly shown that it is dominated by another tuple. As the test for dominance cannot be per-formed when an incomplete tuple is involved, incomplete tuples do not dominate any other tu-ples, but also cannot be dominated themselves. Therefore, incomplete tuples will be in the sky-line result, as there is no reliable information available, indicating that they should be ex-cluded. This potentially leads to many false positives, but only rarely to false negatives. The evaluation results of this heuristic, in terms of error rates, are comparable to treating incom-plete tuples as a failure.
Surrogate with maximal values (optimistic surrogation): This optimistic heuristic differs from the previous two heuristics. Instead of pro-viding a default decision for the dominance test, it heuristically provides the values of missing at-tributes, i.e. it simply surrogates every missing value with the best possible value. Then, the usual Pareto dominance semantics are applied for computing the skyline. The rationale behind this heuristic is that missing values might mask very good values, and in the best case, they might even be maximal. By assuming maximal values, this heuristic tries to retain these good tuples, yet at the same time leading to both( po-tentially many) false positives and false nega-tives. This is also clearly evident in our eval-uations where this heuristics shows error rates which are often 6x higher for all datasets than the best heuristic.
Surrogate with minimal values (pessimistic surrogation): This heuristic is similar to the previous heuristic, but takes a pessimistic ap-proach surrogating missing values with the min-imal value. This allows incomplete tuples to be in the skyline, but only if the tuple shows superior values for at least one of the known attributes. Therefore, this heuristic will mostly induce false negatives(incomplete tuples which should be in the skyline, but are now dominated
because their missing attribute values were as-sumed to be the minimal ones). In our eval-uations, this heuristic was always producing significantly better results with respect to sky-line quality, overshadowing the others by far. However, it severely discriminates against in-complete tuples, which consequently have only slim chances to be included in the result. This drawback is rectified by our hybrid skyline ap-proach, which diminishes this imbalance and further improves the result’s quality by obtain-ing additional information usobtain-ing crowdsourc-ing.
Surrogate with expected values (value impu-tation): This approach relies on various sta-tistical means to predict the expected values of incomplete tuples, i.e. missing values are re-placed by their estimated “real” values. In the following survey, in subsection 3.2, k-nearest neighbor value(KNN)imputation will be used as it has been shown to be quite robust when the percentage of the missing values increases[17]. However, this heuristic works well only when the dataset is highly predictable. As a conse-quence, we could observe very good results for the NBA dataset, but only mediocre error-rates for the cars and notebook dataset.
ISkyline Semantics: Among the recent stud-ies,[18]defines a different skyline semantic that essentially alters the Pareto dominance defini-tion to take missing values into consideradefini-tion. This however, forsakes the skyline transitivity property and leads to cyclic dominance behav-ior. Accordingly, an alternative skyline compu-tation algorithm ISkyline is introduced. Unfor-tunately, from a quality perspective, this heuris-tic fares surprisingly badly. Its performance is comparable to optimistic surrogation.
4. High-Quality Skylines on Incomplete Data
4.1. Advanced Heuristic Approach
The low quality of skyline sets computed over incomplete data can be attributed to one of the two errors in handling incomplete tuples: a)the unjustified inclusion of tuples(false positives)
and b)the omission of tuples that should be there
(false negatives). False positives are present because they are not dominated by any other tu-ple i.e. tutu-ples which should dominate the false positive are incomplete and the heuristic han-dling the test for Pareto domination missed this dominance. Such incomplete tuples end up be-ing false negatives Accordbe-ingly, the aim is to reintroduce these false negatives in the skyline, which would in turn dominate the false positives and discard them.
Relying on the previous study results in sub-section 3.2, missing values are surrogated as per theMinimal value surrogationand the sky-line is computed. Since the focus is on finding and reintroducing false negatives, the advanced heuristic operates only on the set of dominated tuples. Tuples identified as skyline tuples are ignored, since they can only be false (or true) positives.To pinpoint these false negatives, the advanced heuristic operates more or less as a filter, getting rid of the tuples deemed as true negatives. By discarding the true negatives, the remaining set of tuples then constitute the set of potential false negatives. The task of deciding whether a tuple is a false negative or a true nega-tive becomes the main problem and can be based on three given guidelines. The guidelines can be thought of as consecutive sub filters, which are to be followed in that respective order. First Guideline– exploits the implicit effect of the minimal value surrogation. Namely, an in-complete tuple’s real missing value will never be worse than the minimum value it is surrogated with. In other words, minimally surrogated skyline tuples will be more often than not true positives. In contrast, complete skyline tuples remain potential false positives. The ability to distinguish between those two classes within the skyline yields two domination scenarios for the set of dominated tuples and, more specifically, the complete dominated tuples which could be either 1) dominated by a true positive, which implies that it is indeed a true negative, or 2)
dominated by a false positive, which implies that there exists a tuple (currently a false neg-ative) that should dominate this false positive
and transitively dominate the complete tuple in question. Accordingly, completely dominated tuples are always true negatives and can be fil-tered out. As will be demonstrated in the eval-uation section, 80% of the dominated tuples are on average discarded, with only 5% of that mass being false negatives(i.e. 95% of the false neg-atives are preserved).
Second Guideline – enforces two bounds: an upper and a lower bound on the so-called min-imum skyline membership value. A minmin-imum skyline membership value is simply the small-est value assigned to a tuple’s missing attribute upon which this tuple becomes a skyline point. Investigating whether an incomplete tuple has a minimum skyline membership value or not al-lows us to easily discard all those tuples which do not have this property, i.e. regardless of the missing attribute value, they’ll never be in the skyline. Instead of surrogating with the mini-mum value, we start to search for the minimini-mum skyline membership value for each incomplete tuple in the set of dominated(non-skyline) tu-ples. Finding this minimum value involves an iterative approach. Starting with the worst pos-sible valuem, the value incrementally increases bym+x(wherexis some fixed value referred to as the minimum skyline membership gran-ularity) until the tuple under inspection quali-fies into the skyline. A valid minimum skyline membership value must abide to the following lower and upper bounds.
• Lower bound: A potential false negative’s minimum skyline membership value shouldn’t qualify the tuple into the skyline by dominating a true positive(an incomplete tuple), but rather only false positives( com-plete tuples).
A subspace skyline is a skyline that is com-puted on a subset of the dataset’s attributes. Ex-amining the different subspaces aligns with the definition of semantic importance, where some tuples may appear as skyline points in one or more subspaces or in none. The focus here is on those potentially false negatives, which specifically emerge as non-exclusive subspace skyline points, i.e. a tuple that does not ex-clusively appear as a subspace skyline point in subspaces comprising its originally missing at-tributes. Such exclusivity would imply that the tuple’s skyline-membership is based solely on the minimum skyline membership value that’s been surrogated with, and that none of the tu-ple’s other attributes were good enough to qual-ify the false negative into the skyline set of any other subspace. On the other hand, non-exclusivity (i.e. appearing as skyline point in other different subspaces not comprising the originally missing attribute’s value)would im-ply that the tuple’s overall attributes’ value is good.
4.2. Crowdsourcing-Based Approaches
Crowd-enabled algorithms can be exploited to obtain missing values on the Web. Basically, HITs of incomplete tuples are issued during run-time to crowdsourcing services. While each in-dividual HIT might be cheap, monetary cost and time needed to complete each HIT can quickly sum up. Accordingly, the na¨ıve approach of crowdsourcing all missing attribute values of an incomplete dataset is prohibitively expensive, especially if most of the tuples completed by the crowd will not be part of the final result set, i.e. the skyline set.
The next two approaches, which were inves-tigated in previous works balance these costs against the desired improvements by selectively crowdsourcing the most relevant incomplete tu-ples, while relying on heuristics for all others.
4.2.1. Approach A – Surrogating with Predicted Values
This approach, first introduced in[2], surrogates missing values by (potentially unreliable) pre-dictions before a skyline is computed. Tuples that are considered high impact(risk)have their predicted values superseded with real values via crowdsourcing Eventually, the skyline can be computed with high accuracy.
For predicting missing values of tuples, a li-brary containing several predication algorithms is available. Different algorithms(e.g. k-nearest neighbour imputation [23], regression imputa-tion[24], etc.) will perform differently, depend-ing on the properties of the underlydepend-ing dataset. In a system tuning phase during start-up, the best prediction algorithms for the current dataset have to be determined. A test sampleRS ⊆RC
(whereasRCis the subset of complete tuples)is
prepared by removing some values in a similar pattern in which information is missing in the base dataset Then, a prediction quality assess-ment is computed for each algorithm by measur-ing the error between original values in this test sample and the current algorithm’s predictions for the same values. The algorithm showing the smallest overall mean squared error is selected for predicting all missing values
During evaluation we only consider k-nearest neighbour imputation (KNN) prediction algo-rithm, as it has been shown to be quite robust when the percentage of missing values increases
(see[17], which also evaluates other imputation techniques)Additionally, more detailed statis-tics on the behavior of each algorithm is stored to be used later. In particular, for each attribute ai we elicit the mean error e¯i between the
pre-dictions and the real values, and the standard deviatione
i of those errors.
Definition 4 (Error Vector): For prediction algorithm PA and base dataset R, an error analysis vector EPA
R with e−2as mean squared error of all attributes,e¯ias mean error of attribute ai,and
e
i as respective standard deviation is given by:
After the selected prediction algorithm has been used to predict all missing values for the current dataset, the system has to decide for each tu-ple, whether the tuple’s missing values will be replaced by the predicted values during skyline processing or by accurate values that are ob-tained from crowdsourcing judgements. When surrogating with predicted values, a certain er-ror is introduced. To control and minimize that error, we introduce the notion of predic-tion risk, i.e. the risk quantified by the proba-ble impact each tuple may have on the skyline correctness whenever a predicted value is used without crowdsourcing the correct values. By computing this risk factor, we can restrict the crowdsourcing efforts to exactly those tuples that will strongly affect the result quality with high probability (i.e. have high risk), and use suitable value predictions for all remaining tu-ples posing only a limited threat to the overall result quality. Eventually, we only crowdsource the mostriskytuples and rely on predicted val-ues for all the othersafetuples.
Therefore, the next crucial step is to assess and classify the risk of each predicted tuple as be-ing “risky” or “safe”. To that end, we rely on the corresponding prediction algorithm ac-curacy statistics EPA
R that were elicited earlier.
With these statistics, we quantify the prediction interval oftpassuming that the algorithm has
es-timated any missing value including the respec-tive systematic prediction errore¯iand
addition-ally overestimated or underestimated each value by the standard deviation, i.e. ±e
i Then, the
two interesting cases become the upper bound tuplet+and the lower bound tuplet−, because these two tuples dominate the largest / lowest number of other tuples when finally computing the skyline under normal error assumption. Focusing on the expected errors for each pre-dicted tupletp when computing the skyline of RC∪ {tp}, while assuming that the real values for tp are bounded by t+ and t−, we identify
for any given tuple the following four scenar-ios for all the possible false negatives and false positives.
Definition 5 (Upper/Lower Bound Tuple): Lett∈RI be a tuple with incomplete values, andtp
be the predicted tuple using some prediction algorithm. Then the upper/lower bound tuplest+ andt−are defined attribute-wise as follows:
t+i =
if (ti= ):ti
if(ti= ):(tpi+¯ei)+ie
t−i =
if (ti= ):ti
if(ti= ):(tpi+¯ei)−ie
Definition 6 (Set of False Positives): Let tp =PA(t)be a predicted tuple with its upper/lower
bound tuples t+and t−. Also, skycis the skyline of all tuples in RCwith respect to the preferences
P. Then, the set of possible false positives fp(tp)can be computed by one of these four rules: – If ( ∃s∈skyc :(s>ptp))∧( ∃s∈skyc:(s>p t−))
then fp(tp) ={s∈sky
c|(t+ >p s)∧(tp>p s)}
– If ( ∃s∈skyc :(s>ptp))∧(∃s∈skyc :(s>p t−))
then fp(tp) ={s∈sky
c|(t+ >p s)∧(tp>p s)} ∪ {tp}
– If (∃s∈skyc :(s>ptp))∧(∃s∈skyc :(t+ >ps))
then fp(tp) ={s∈skyc|(t+ >p s)}
– If (∃s∈skyc :(s>ptp))∧( ∃s∈skyc :(t+ >ps))
Definition 7 (Set of False Negatives): Let tp be a predicted tuple with its upper/lower bound
tuples t+ and t−. Let skyc be the skyline of all tuples in RC with respect to the preferences P.
Then, the set of possible false negatives fn(tp)can be computed by one of these four rules:
– If ∃s∈skyc :s>p tp∧∀s∈skyc :tp >ps⇒t−>p s
then fn(tp) =∅
– If ∃s∈skyc :s>p tp∧∃s∈skyc :tp >ps ⇒t−>p s
then fn(tp) =s∈sky
c|tp>p s∧(t− >ps)
– If ∃s∈skyc :s>p tp∧ ∃s∈skyc :s>pt+
then fn(tp) ={tp}
– If ∃s∈skyc :s>p tp∧∃s∈skyc :s>pt+
then fn(tp) =∅
Using the cardinalities of the sets of false neg-atives fn(tp)and false positivesfp(tp) for each
predicted tupletp, we can finally assign a score
Definition 8 (Tuple Score): Given the set of false negatives fn(tp),false positives fp(tp),and a
weighting factor ∈[0,1],the score of a tuple tpcan be computed as:
score(tp) = ∗ |fn(tp)|+ (1−)∗ |fp(tp)|
Finally, the top-kmost risky tuples can be crowd-sourced. Different strategies for selecting a suit-ablekare detailed in[2], wherekcould be cho-sen in accordance to quality requirements or additional meta-data provided by the user.
4.2.2. Approach B – Surrogating with Min-Max Values
In this second crowdsourcing based approach
[3], we rely on the previous study results in Subsection 3.2, and surrogate all missing values with minimal values for a simple, but still strong starting situation. As illustrated by the first guideline of the advanced heuristic, every tuple in the skyline’s result set that has been surro-gated with minimal values has now a very high probability to be a true positive and shouldn’t be crowdsourced.
Next we introduce an error model for identify-ing only those tuples with the highest potential to negatively affect quality, and select only those to be crowdsourced. The error model relies on
that reflects the potential severity of the intro-duced error and accordingly rank the tuples with respect to their crowdsourcing priority.
counting the number of tuples dominated by a given tuple when its missing values have been surrogated. Though minimal values surroga-tion proves to be the best baseline heuristic and has its advantages, na¨ıvely surrogating the tu-ples values with the minimum value becomes less effective underneath this error model’s set-ting, where only few or even no other tuples are usually dominated when surrogating with min-imal values. Furthermore, it would also ignore the possible potential of tuples, as usually most real values are better than the worst value. Ac-cordingly, we temporarily surrogate the current tuple’s missing values with maximum values, while retaining the minimal values surrogation for all the other incomplete tuples to be ranked with minimal values. All incomplete tuples are then ranked by this count, and the top tuples
Definition 9 (Minimal Maximal Replacement Error Model): For a dataset R = RC ∪RI containing complete and incomplete tuples with n attributes A1, . . . ,An,the number of potentially
dominated tuples for a given tuple t∈RI can be computed by:
maxDomCount(t) =|{td∈RC |tˆ>Ptd}|withtˆi=
1 : if ti=
ti: if ti=
Furthermore, we incorporate the notion of miss-ing attributes’ skyline impact, argumiss-ing that not all attributes have an equal impact on the sky-line’s result, and that some attributes can be more influential for deciding a tuple’s membship in the skyline than the others. In this er-ror model, the potential impact of all attributes is measured in an initial dataset analysis step. Here, we focus on measuring the skyline error introduced when a given attribute is completely ignored. Using the subset of all complete tuples,
Definition 10 (Missing Attribute’s Skyline Impact): For a dataset R =RC∪RI containing
complete and incomplete tuples with n attributes A1, . . . ,Anand corresponding attribute impact
error vector(I1, . . . ,In),the total impact error Itof a tuple t∈RI is given by
It :=
x∈{i|ti=}Ix
Finally, all incomplete tuples t∈RI are ranked by their weighted minimal-maximal domination
count:
weightedCount(t) =maxDomCount(t)×It
5. Evaluation
In this section, we evaluate both advanced heuris-tic and crowdsourcing based approaches and investigate which approach produces a higher quality result Unless stated otherwise, we as-sume that 20% of the values are missing. For efficiency reasons, all attribute values are nor-malized to the interval [0,1], with 1 being the best and 0 being the least desirable value. Fur-thermore, seeking to avoid dataset bias, all ex-periments were executed for a total of 100 sim-ulation runs. The presented results are an ag-gregation of these runs. For the crowdsourcing based approach an initial dataset analysis step is required to measure both the KNN’s prediction quality(for approach A: Surrogating with pre-dicted values)and the missing attributes’ sky-line impact (for approach B: Surrogating with Min-Max values). These measurements are
we compute the skyline. Then, we iteratively ignore each attribute, treating it as completely absent and re-compute the skyline. Comparing both skylines and computing the skyline error, we get the error this attribute is responsible for introducing into the skyline’s result. This im-pact measure can then be combined with the previous minimal-maximal replacement error model for an improved ranking. Eventually, tuples are ranked by their weighted minimal-maximal domination count as follows:
necessary prerequisites which give insight into the nature and predictability of the datasets.
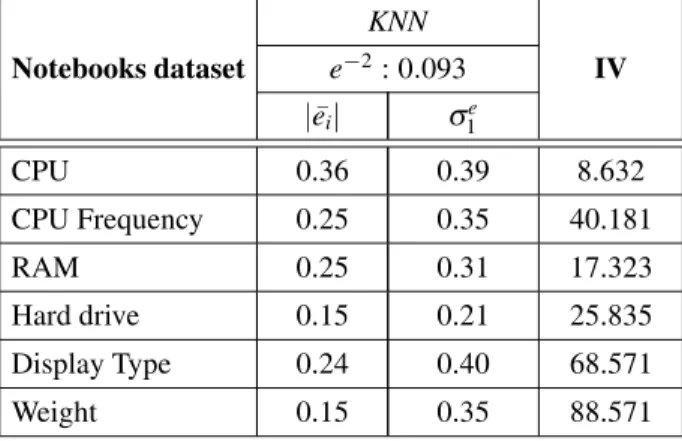
5.1. Initial Dataset Analysis Step
Furthermore, the prediction error of the KNN’s algorithm, given by the error vectorEKNN
R for all
the datasets is also shown in Tables 1,2, and 3. It becomes clear that, on average, missing values within the NBA dataset can be predicted sig-nificantly better than those of the other datasets. Moreover, even within a dataset, some attributes can be predicted more accurately than others, e.g., games played in the NBA set has a mean error of ∼ 0.34, while most other attributes of the NBA set have mean errors of∼0.07. Eval-uations with other prediction algorithms can be found in[2].
KNN
Notebooks dataset e−2: 0.093 IV
|e¯i| e
1
CPU 0.36 0.39 8.632
CPU Frequency 0.25 0.35 40.181
RAM 0.25 0.31 17.323
Hard drive 0.15 0.21 25.835 Display Type 0.24 0.40 68.571
Weight 0.15 0.35 88.571
Table 1.Initial data analysis(notebooks dataset).
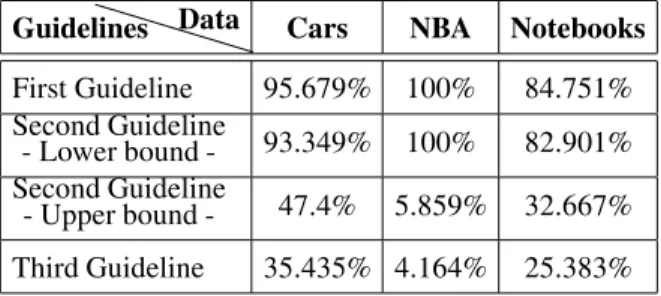
Guidelines Data Cars NBA Notebooks
First Guideline 95.679% 100% 84.751% Second Guideline
- Lower bound - 93.349% 100% 82.901% Second Guideline
- Upper bound - 47.4% 5.859% 32.667% Third Guideline 35.435% 4.164% 25.383%
Table 2. Average % of false negatives retained.
Guidelines Data Cars NBA Notebooks
First Guideline 79.653% 79.97% 79.814% Second Guideline
- Lower bound - 84.042% 91.202% 85.487% Second Guideline
- Upper bound - 97.212% 99.99% 98.89% Third Guideline 98.948% 99.99% 99.558%
Table 3.Average % of discarded data.
5.2. Evaluating the Proposed Approaches
5.2.1. Advanced Heuristic Approach
Ideally, a high percentage of semantically im-portant false negatives should be retained, while discarding as many true negatives as possible. To conduct a comprehensive evaluation, the data set produced after each of the three guidelines is analyzed by inspecting: 1) the percentage of false negatives retained(see Table 4), which was inferred by comparing the data returned af-ter following each guideline against the original skyline on the complete dataset and 2)the per-centage of tuples discarded(see Table 5), which was inferred by comparing the data returned af-ter following each guideline against the initial set of dominated tuples(i.e. non-skyline tuples)
from the minimally surrogated dataset that was used as input.
On average, 82 tuples remain for the Cars dataset, 2 tuples for the NBA dataset and 7 tuples for the Notebooks dataset. Simultaneously, as depicted in Table 4, 35% for the Cars dataset(∼18 false negatives)and 25% for the Notebooks dataset false negatives are retained.
Furthermore, we closely examine the semantic importance of the retained tuples. Using the
ID CPU Freg. RAM HDCPU DisplayType Weight
1415 0.8 0.751 0.5 0.4 0.846 0.628 156 0.502 0.751 0.5 0.4 0.846 0.667 1292 0.8 0.863 1 0.64 0.666 0.79 1332 0.8 0.737 0.5 0.32 0.851 0.603
Table 4.Advanced heuristic’s skyline quality.
Datasets Cars dataset NBA dataset Notebooksdataset
skyA 380 80 48
skyDmin 296 75 35
original complete dataset and its skyline, we can check which tuples from the set of real false negatives were kept and compare them with those that weren’t. The earlier experi-ments already illustrated how many false nega-tives were retained, but the main aim here is to check whether the false negatives that were kept are indeed more interesting ones than those dis-carded. Without loss of generality we show the results of a single run on the Notebooks dataset. For the current simulation run, the computed skyline lacks a total of 4 false negatives (note that the original skyline is also small in size, in-cluding only 35 tuples.) Table 6 represents the attribute values of those four false negatives. Out of 1,658 tuples, the advanced heuristic ap-proach returns only 7 data points, including two false negative, namely, data points with IDs: 1415 and 156 and misses out on: 1292 and 1332. Keeping in mind that the highest attributes with impact are in the order as follows (as per the initial dataset analysis step): Weight, Display type and CPU frequency; a closer look at the four false negatives arguably demonstrates that the two returned false negatives are the most in-teresting. Although the Notebook with ID 1292 has the highest CPU frequency, it still has the smallest display and is the heaviest. On the other hand, for Notebook ID 1332, though – compared to the retained Notebooks 1415 and 156 – it is the lightest and has the biggest dis-play, it is not included as the difference in terms of weight and display type isn’t that big, while at the same time, it ranks equally or smaller in terms of all the other attributes.
KNN
Cars dataset e−2: 0.077 IV
|e¯1| ie
Price 0.25 0.5 78.534
Power 0.10 0.12 90.312
Acceleration 0.22 0.34 33.609 Fuel Consumption 0.20 0.35 28.758 CO2Emission 0.21 0.35 10.848
Taxes 0.26 0.4 47.775
Table 6.Initial data analysis(cars dataset).
5.2.2. Crowdsourcing Based Approaches
To examine the effectiveness of the two pro-posed crowdsourcing based approaches, we mea-sure the skyline error every time a tuple is crowdsourced.
5.2.3. Approach A – Surrogating with predicted values
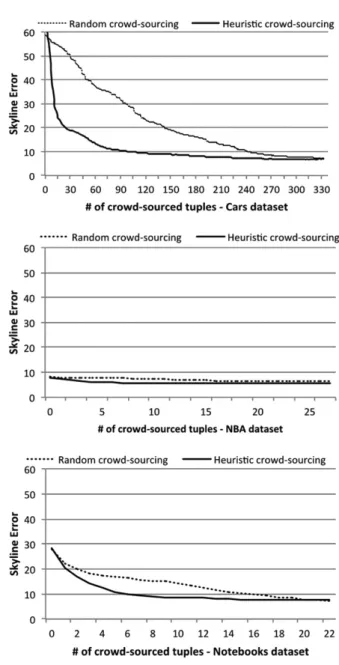
Figure 1 depicts the results of the selecting the next tuple to be crowdsourced instead of randomly selecting any incomplete tuple for
Figure 1.Decreasing skyline error while crowdsourcing
crowdsourcing. With the notable exception of the NBA dataset, it is clearly visible that by pure prediction (i.e. no crowdsourcing)the skyline quality over incomplete Web sources is very low
(error for NBA 7.2%, Notebooks 28.4%, Cars 62%). However, the skyline error is signifi-cantly reduced when using this heuristic after just a few crowdsourced tuples, while this ef-fect is much less pronounced if tuples are ran-domly selected. For example, consider the Cars dataset: for decreasing the error from 60% down to 20%, only 27 tuples need to be crowdsourced on average, while for reaching a similar im-provement with randomly selected tuples, 145 tuples need to be crowdsourced. Also note that 20% missing values translate to an absolute of 4,392 tuples missing in the NBA dataset, 319 tuples in the Notebooks dataset, and 1,551 tu-ples in the Cars dataset. Therefore, tremendous effort can be saved if users are willing to accept minor reductions with respect to skyline qual-ity. The high prediction accuracy of the NBA dataset leads to an already low initial skyline error when only relying on prediction, leaving only limited room for improvement. Further-more, this experiment shows another interest-ing effect which can be exploited: when usinterest-ing our heuristic, the error is reduced very quickly for the first few crowdsourcing operations, but the quality improvements will slow down after a while. This means, for most datasets, there is a k, for which we have the optimal trade-off between low error rates, and low query execu-tion costs. We can use this observaexecu-tion to auto-matically determine the most efficient kduring sampling runs prior to the actual crowdsourc-ing. This can be attained by deter mining the error curve’s inflection point. E.g. using the Cars dataset, by crowdsourcing 36 or 76 tuples
(both being inflection points), a very good ratio between quality and costs can be achieved.
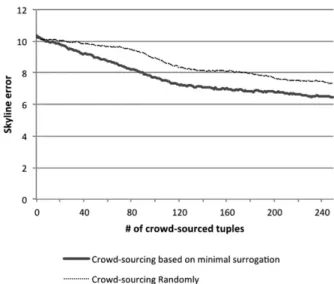
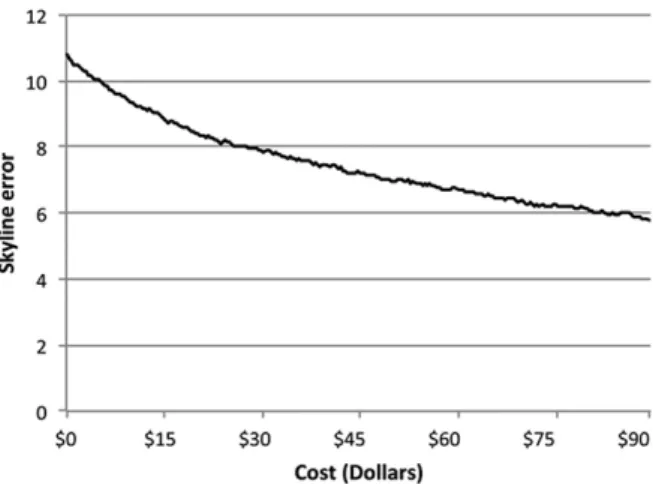
5.2.4. Approach B – Surrogating with min-max values
As shown in Figure 2, applying this model on the Cars dataset, the skyline error decreases from 10.8 to 9.8 instead of to only 10.4 for just 25 crowdsourcing operations. This signif-icantly outperforms the KNN-predicted values surrogation variant whose skyline error starts high at 61.8 and decreases to only 19.8 after 25 crowdsourcing operations.
Figure 2.Crowdsourcing based on min-max value surrogation versus random crowdsourcing.
5.3. Crowdsourcing Based Approaches Versus Advanced Heuristic Approach
In the next set of experiments, we compare the advanced heuristic approach to the second out-performing crowdsourcing approach: surrogat-ing with min-max values in terms of: precision, recall, skyline error, and skyline size. We ex-amine the skyline size to keep track of how big the skyline gets when we add the potential false negatives to it, where big skylines would over-whelm the user.
5.3.1. Skyline size
As shown in Table 7, the skyline size of the advanced heuristic(skyA), post min-max values
KNN
NBA dataset e−2: 0.0510 IV
|e¯1| ie
Games played 0.34 0.38 62.667 Points scored 0.08 0.08 2.667 Total rebounds 0.05 0.07 50.667
Assists 0.08 0.07 78.667
Field goals made 0.06 0.07 6.667
surrogation baseline skyline(skyDmin), are
com-pared for the three datasets. As expected,skyA is bigger thanskyDmin since it reintroduces new
tuples into the skyline. However, the difference in size isn’t considerable for both the Notebooks dataset (13 tuples more) and the NBA dataset
KNN
Notebooks dataset e−2: 0.093 IV
|e¯i| e
1
CPU 0.36 0.39 8.632
CPU Frequency 0.25 0.35 40.181
RAM 0.25 0.31 17.323
Hard drive 0.15 0.21 25.835 Display Type 0.24 0.40 68.571
Weight 0.15 0.35 88.571
Table 8.Initial data analysis(notebooks dataset).
KNN
Cars dataset e−2: 0.077 IV
|e¯1| ie
Price 0.25 0.5 78.534
Power 0.10 0.12 90.312
Acceleration 0.22 0.34 33.609 Fuel Consumption 0.20 0.35 28.758 CO2Emission 0.21 0.35 10.848
Taxes 0.26 0.4 47.775
Table 9.Initial data analysis(cars dataset).
KNN
NBA dataset e−2: 0.0510 IV
|e¯1| ie
Games played 0.34 0.38 62.667 Points scored 0.08 0.08 2.667 Total rebounds 0.05 0.07 50.667
Assists 0.08 0.07 78.667
Field goals made 0.06 0.07 6.667
Table 10. Initial data analysis(NBA dataset).
(5 tuples more). This increased size comes at the expense ofskyAhaving more correct skyline points thanskyDmin.
5.3.2. Precision, recall and skyline error
Table 8 holds the computational results for the precision, recall and skyline error. Notably skyA’s recall is higher than skyDmin’s as it
suf-fers from less false negatives in total. On the other hand, becauseskyA’s has more false posi-tives and so exhibits a slightly smaller precision than that ofskyDmin’s, the skyline error based on
the informedness measure attests thatskyA has smaller or roughly equal associated error.
Furthermore, compared to the crowdsourcing strategy, a real crowdsourcing experiment on the Cars dataset required 109 crowdsourcing oper-ations to reach the same skyline error achieved by the advanced heuristic strategy(8.5%).
5.4. Crowdsourcing’s Costs and Time
Figure 3.Time required for Crowdsourcing – Cars dataset.
skyA skyDmin
Cars Precision 0.658 0.818 dataset Recall 0.932 0.901 Skyline error 8.5% 11.34% NBA Precision 0.872 0.89 dataset Recall 0.93 0.927
Skyline error 7.5% 7.59% Notebooks Precision 0.7 0.791 Skyline error 9.06% 11.23%
Table 11.Advanced heuristic’s skyline quality.
6. Conclusion
In this paper, we studied the problem of sky-line query computations on incomplete Web datasets. Two strategies were proposed: ad-vanced heuristic and crowdsourcing-based strat-egy. Whereas the crowdsourcing strategy ex-ploits the current trend of crowd-enabled DBMS, which can attain strong results by incorporating human workers, the advanced heuristic offers an alternative offline solution for times when crowdsourcing might not be a feasible option, e.g. when the missing data is not easily avail-able for the crowd or the costs of crowdsourcing are prohibitive. A survey of the most common established heuristics was conducted, showcas-ing how each of these heuristics fare in terms of the resulting skyline quality. We conducted all our experiments on three originally complete
Figure 4.Cost for Crowdsourcing in dollars – Cars dataset.
real world Web datasets, where 20% of the data were later artificially removed to induce incom-pleteness. This allowed us to examine the qual-ity of heuristically computed skylines, as the error with regard to the corresponding complete dataset’s skyline can be computed. Experiments illustrate how the advanced heuristic surpasses all current basic heuristics employed in the lit-erature. On the other hand, for the crowdsourc-ing based approach, min-max values tion is significantly better than KNN surroga-tion. Moreover, when comparing the advanced heuristic to the crowdsourcing approaches, it becomes clear that for some datasets, like NBA and Notebooks, the simple advanced heuristic outperforms the crowdsourcing alternative in terms of skyline quality, though at the expense of an arguably insignificant skyline size growth.
References
[1] M. FRANKLIN, D. KOSSMANN, T. KRASKA, S. RAMESH, R. XIN, CrowdDB: Answering queries with crowdsourcing.ACM SIGMOD Int. Conf. on Management of Data, Athens, Greece, 2011.
[2] C. LOFI, K. EL MAARRY, W. T. BALKE, Skyline Queries in Crowd-Enabled Databases.
[3] C. LOFI, K. EL MAARRY, W. T. BALKE, Skyline Queries over Incomplete Data – Error Models for Focused Crowd-Sourcing.
[5] J. SELKE, C. LOFI, W. T. BALKE, Pushing the Bound-aries of Crowd-Enabled Databases with Query-Driven Schema Expansion. Proc. VLDB, 5, pp. 538–549, 2012.
[6] A. KITTUR, E. H. CHI, B. SUH, Crowdsourcing user studies with Mechanical Turk. SIGCHI Conf. on Human factors in computing systems, 2008.
[7] L. BENTIVOGLI, M. FEDERICO, G. MORETTI, M. PAUL, Getting expert quality from the crowd for machine translation evaluation.Proceedings of the MT Summmit, pp. 521–528, 2011.
[8] P. VENETIS, H. GARCIA-MOLINA, Quality control for comparison microtasks.Int. Workshop on Work-shop on Crowdsourcing and Data Mining, Bejing, China, 2012.
[9] M. HIRTH, T. HOFELD, P. TRAN-GIA, Cost-Optimal Validation Mechanisms and Cheat-Detection for Crowdsourcing Platforms. Int. Conf. on Innova-tive Mobile and Internet Services in Ubiquitous Computing (IMIS), Soul, South Korea, 2011.
[10] G. KAZAI, J. KAMPS, N. MILIC-FRAYLING, The face of quality in crowdsourcing relevance labels: de-mographics, personality and labeling accuracy.Int. Conf. on Information and Knowledge Management (CIKM), Maui Hawaii, USA, 2012.
[11] E. KAMAR, E. HORVITZ, Incentives for truthful re-porting in crowdsourcing.Int. Conf. on Autonomous Agents and Multiagent Systems (AAMAS), Valencia, Spain, 2012.
[12] M. S. SILBERMAN, L. IRANI, J. ROSS, Ethics and tac-tics of professional crowdwork.XRDS Crossroads,
17, pp. 39–43, 2010.
[13] C. LOFI, J. SELKE, W. T. BALKE, Information Extrac-tion Meets Crowdsourcing: A Promising Couple. Datenbank-Spektrum,12, 2012.
[14] S. B ¨ORZSONYI¨ , D. KOSSMANN, K. STOCKER, The Skyline Operator. Int. Conf. on Data Engineering (ICDE), Heidelberg, Germany, 2001.
[15] R. FAGIN, A. LOTEM, M. NAOR, Optimal aggregation algorithms for middleware.Symposium on Princi-ples of Database Systems (PODS), Santa-Barbara, California, USA, 2001.
[16] D. M. W. POWERS, Evaluation: From Precision, Re-call and F-Factor to ROC, Informedness, Marked-ness & Correlation.Sch. Informatics Eng. Flinders Univ. Adelaide Aust. Tech Rep SIE07001, 2007.
[17] E. ACU, The treatment of missing values and its effect in the classifier accuracy.Classif. Clust. data Min. Appl, pp. 1–9, 2004.
[18] M. E. KHALEFA, M. F. MOKBEL, J. J. LEVANDOSKI, Skyline Query Processing for Incomplete Data. Int. Conf. on Data Engineering (ICDE), Canc´un, M´exico, 2008.
[19] W. T. BALKE, J. X. ZHENG, U. G ¨UNTZER, Approach-ing the Efficient Frontier: Cooperative Database Re-trieval Using High-Dimensional Skylines.Int. Conf. on Database Systems for Advanced Applications (DASFAA), Beijing, China, 2005.
[20] P. GODFREY, Skyline cardinality for relational pro-cessing. How many vectors are maximal?Symp. on Foundations of Information and Knowledge Systems (FoIKS), Vienna, Austria, 2004.
[21] J. PEI, W. JIN, M. ESTER, Y. TAO, Catching the best views of skyline: a semantic approach based on decisive subspaces.31st Int. Conf. on Very Large Databases (VLDB’05), Trondheim, Norway, 2005.
[22] A. VLACHOU, M. VAZIRGIANNIS, Ranking the sky: Discovering the importance of skyline points through subspace dominance relationships. Data Knowl. Eng.,69, pp. 943–964, 2010.
[23] E. ACU, The treatment of missing values and its effect in the classifier accuracy.Classif. Clust. data Min. Appl.pp. 1–9, 2004.
[24] Z. GHAHRAMANI, M. I. JORDAN, Supervised learn-ing from incomplete data via an EM approach. In: J. D. Cowan, G. Tesauro, J. Alspector,(eds.) Ad-vances in Neural Information Processing Systems,
6, pp. 120–127. Morgan Kaufmann Publishers, Inc., 1994.
Received:October, 2014
Accepted:October, 2014
Contact addresses:
Kinda El Maarry Christoph Lofi Wolf-Tilo Balke Technische Universit¨at Braunschweig M¨uhlenpfordtstr. 23 38114 Braunschweig Germany e-mail:{elmaarry,lofi,balke}@ifis.cs.tu-bs.de
KINDAELMAARRYis currently a PhD Research Assistant at the Infor-mation Systems Institute of Technische Universit¨at Braunschweig, Ger-many. She earned her B.Sc. degree in computer science from the Faculty of Computers and Information, Cairo University in 2008, majoring in information systems and minoring in computer science. In 2010, she worked as an IT Administrator/Application Support at Taalum’s group in Doha, Qatar. From 2011 till 2013, she continued with her studies and received her M.Sc. degree with a focus on Data and Information from the Technische Universit¨at Braunschweig, Germany. In 2012, she received the Nieders¨achsische Technische Hochschule. scholarship for excellent female ITIS students.