1Postdoctoral Research Fellow at International Islamic University Malaysia. Email: [email protected]
35
PLANNING MALAYSIA:
Journal of the Malaysian Institute of Planners
VOLUME 18 ISSUE 1 (2020), Page 35
–
44
THE IMPACT OF PERSONALITY AND LIFESTYLE ON
INTERACTION WITH NATURE
Aisyah Abu Bakar
1, Mariana Mohamed Osman
2& Mizan Hitam
31,2
Kulliyyah of Architecture and Environmental Design
INTERNATIONAL ISLAMIC UNIVERSITY MALAYSIA
3
Faculty of Architecture, Panning and Surveying
UNIVERSITI TEKNOLOGI MARA
Abstract
Awareness on the complex interdepending systems between individuals and their
contexts is a fundamental understanding of sustainable well-being. Collectivist
beliefs and biospheric values translate the normative behaviours when
environmental decisions are being made. Issue: Existing research has limited
empirical evidence on the impact of personality and lifestyle (PL) on interaction
with nature (IN) for Malaysia. Purpose: This paper aims to verify the statistical
predictability of IN based on PL. Approach: Multiple Correlation and Multiple
Linear Regression were carried out to assess linear associations and parameters
of linear equations to predict IN components based on PL items. Findings: IN
components were predictable by the majority of the PL items and ‘feeling
affected by the environmental loss of other countries’ was the strongest predictor
of IN.
INTRODUCTION
Human interdependence with the environment (HIE) is one of the strong sources
of subjective sustainable well-being (SSWB). Personality and lifestyle (PL) and
interaction with nature (IN) are dimensions of HIE that mutually stimulate one
another (Abu Bakar et al., 2017a, 2017b, 2017c, 2018). Human beings willingly
influence their surroundings directly and indirectly. The direct influence is often
demonstrated in the willingness to assist each other in pursuing worthy life goals
by helping and nurturing others and being good role models. The indirect
influence is revealed in contagious emotions, empathic resonance and imitation
of empathy towards the surrounding environment. This paper assesses the
statistical predictability of IN based on PL.
LITERATURE REVIEW
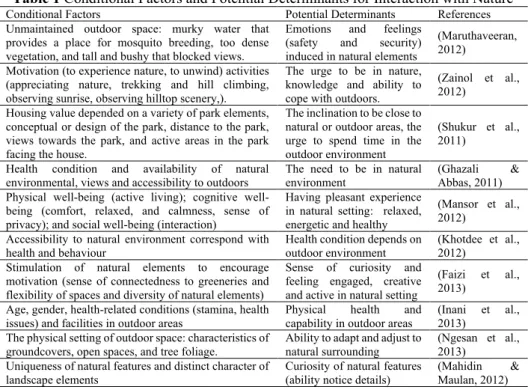
Case studies based on articles from selected Asian Journals from the year 2011
onwards highlight conditional factors and potential determinants of Interaction
with Nature (IN). Table 1 summarizes these findings.
Table 1
Conditional Factors and Potential Determinants for Interaction with Nature
Conditional Factors Potential Determinants References Unmaintained outdoor space: murky water thatprovides a place for mosquito breeding, too dense vegetation, and tall and bushy that blocked views.
Emotions and feelings (safety and security) induced in natural elements
(Maruthaveeran, 2012)
Motivation (to experience nature, to unwind) activities (appreciating nature, trekking and hill climbing, observing sunrise, observing hilltop scenery,).
The urge to be in nature, knowledge and ability to cope with outdoors.
(Zainol et al., 2012)
Housing value depended on a variety of park elements, conceptual or design of the park, distance to the park, views towards the park, and active areas in the park facing the house.
The inclination to be close to natural or outdoor areas, the urge to spend time in the outdoor environment
(Shukur et al., 2011)
Health condition and availability of natural environmental, views and accessibility to outdoors
The need to be in natural environment
(Ghazali & Abbas, 2011) Physical being (active living); cognitive
well-being (comfort, relaxed, and calmness, sense of privacy); and social well-being (interaction)
Having pleasant experience in natural setting: relaxed, energetic and healthy
(Mansor et al., 2012)
Accessibility to natural environment correspond with
health and behaviour Health condition depends on outdoor environment (Khotdee et al., 2012) Stimulation of natural elements to encourage
motivation (sense of connectedness to greeneries and flexibility of spaces and diversity of natural elements)
Sense of curiosity and feeling engaged, creative and active in natural setting
(Faizi et al., 2013)
Age, gender, health-related conditions (stamina, health issues) and facilities in outdoor areas
Physical health and capability in outdoor areas
(Inani et al., 2013)
The physical setting of outdoor space: characteristics of
groundcovers, open spaces, and tree foliage. Ability to adapt and adjust to natural surrounding (Ngesan et al., 2013) Uniqueness of natural features and distinct character of
landscape elements
Curiosity of natural features (ability notice details)
PLANNING MALAYSIA
Journal of the Malaysia Institute of Planners (2020)
37
©
2020 by MIP
Table 2
Components and Determinants of Interaction with Nature
Definition of IN Components Indicators Code
The internal and external emotions
and aptitudes towards the
natural environment expressed in the contact between human and the ecological nature
Nature Attachment
outdoor environment determining own health and wellness INa being able to recall experiences in the natural environment
Knowledge and Capability
being able to adapt to various outdoor surroundings
INb being able to see and hear what others usually miss in nature being able to notice scientific details of nature
being able to cope with the outdoor environment
Inclination towards
Nature
feeling the urge to spend time in the natural environment
INc tending to lose concentration without contact with nature tending to have objects from the outdoors in personal space spending time planting at home
Personal Lifestyle (PL) manifests in the personal outlook and approach
to life in relation to environmental consciousness (Abu Bakar et al., 2017a,
2017b, 2017c, 2018). Qualities adhere to PL include (i) moral stance in
collectivistic values (Laurens, 2012; Clark et al., 2014; Caesar, 2016), (ii)
commitment to modest and environmental choices (Horayangkura, 2012;
Laurens, 2012; Khare, 2015; Ming et al., 2015), and (iii) environmental concerns
through knowledge and awareness (Horayangkura, 2012; Ming et al., 2015).
Table 3
Determinants of Personal Lifestyle
Definition of PL Indicators Code
The personal orientation that portrays collectivistic worldviews, modesty and humility towards others as well as
consciousness of environmental issues
favouring relationships with others over personal success PL1 choosing to disappointing self over disappointing family PL2 taking account others' opinions in making life decisions PL3 taking the pleasure of working with others PL4 practising moderation in purchasing and using resources PL5 feeling unconcerned if not being able to afford things PL6 believing that having many assets does not lead to happiness PL7 being mindful about environmental destruction PL8 feeling affected by the environmental loss of other countries PL9 urging media to raise more environmental awareness PL10
According to theoretical fundamentals, the research hypothesizes that
IN components are predictable by PL. The following sections provide empirical
evidence on the predictability of INa, INb and INc based on PL items.
METHOD
RESULTS AND DISCUSSION
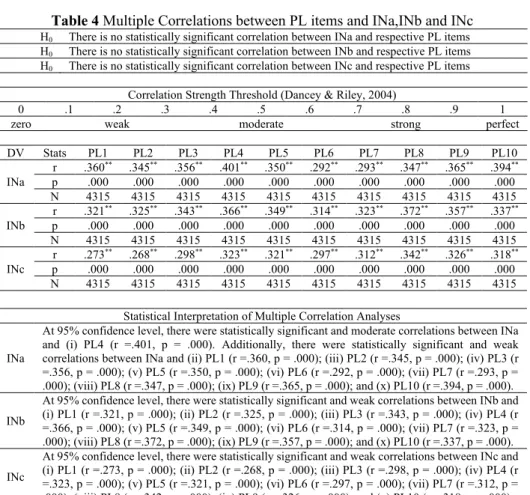
Table 4
Multiple Correlations between PL items and INa,INb and INc
H0 There is no statistically significant correlation between INa and respective PL items H0 There is no statistically significant correlation between INb and respective PL items H0 There is no statistically significant correlation between INc and respective PL itemsCorrelation Strength Threshold (Dancey & Riley, 2004)
0 .1 .2 .3 .4 .5 .6 .7 .8 .9 1
zero weak moderate strong perfect
DV Stats PL1 PL2 PL3 PL4 PL5 PL6 PL7 PL8 PL9 PL10
INa
r .360** .345** .356** .401** .350** .292** .293** .347** .365** .394** p .000 .000 .000 .000 .000 .000 .000 .000 .000 .000 N 4315 4315 4315 4315 4315 4315 4315 4315 4315 4315
INb
r .321** .325** .343** .366** .349** .314** .323** .372** .357** .337** p .000 .000 .000 .000 .000 .000 .000 .000 .000 .000 N 4315 4315 4315 4315 4315 4315 4315 4315 4315 4315
INc
r .273** .268** .298** .323** .321** .297** .312** .342** .326** .318** p .000 .000 .000 .000 .000 .000 .000 .000 .000 .000 N 4315 4315 4315 4315 4315 4315 4315 4315 4315 4315
Statistical Interpretation of Multiple Correlation Analyses
INa
At 95% confidence level, there were statistically significant and moderate correlations between INa and (i) PL4 (r =.401, p = .000). Additionally, there were statistically significant and weak correlations between INa and (ii) PL1 (r =.360, p = .000); (iii) PL2 (r =.345, p = .000); (iv) PL3 (r =.356, p = .000); (v) PL5 (r =.350, p = .000); (vi) PL6 (r =.292, p = .000); (vii) PL7 (r =.293, p = .000); (viii) PL8 (r =.347, p = .000); (ix) PL9 (r =.365, p = .000); and (x) PL10 (r =.394, p = .000).
INb
At 95% confidence level, there were statistically significant and weak correlations between INb and (i) PL1 (r =.321, p = .000); (ii) PL2 (r =.325, p = .000); (iii) PL3 (r =.343, p = .000); (iv) PL4 (r =.366, p = .000); (v) PL5 (r =.349, p = .000); (vi) PL6 (r =.314, p = .000); (vii) PL7 (r =.323, p = .000); (viii) PL8 (r =.372, p = .000); (ix) PL9 (r =.357, p = .000); and (x) PL10 (r =.337, p = .000).
INc
At 95% confidence level, there were statistically significant and weak correlations between INc and (i) PL1 (r =.273, p = .000); (ii) PL2 (r =.268, p = .000); (iii) PL3 (r =.298, p = .000); (iv) PL4 (r =.323, p = .000); (v) PL5 (r =.321, p = .000); (vi) PL6 (r =.297, p = .000); (vii) PL7 (r =.312, p = .000); (viii) PL8 (r =.342, p = .000); (ix) PL9 (r =.326, p = .000); and (x) PL10 (r =.318, p = .000).
At 95% confidence level, there were statistically significant positive
correlations between (i) INa and each of PL items, (ii) INb and each of PL items,
and (iii) INc and each of PL items. The null hypotheses claiming there are no
statistically significant correlations between (i) INa and respective PL items, (ii)
INb and respective PL items, and (iii) INc and respective PL items were all
rejected.
PLANNING MALAYSIA
Journal of the Malaysia Institute of Planners (2020)
39
©
2020 by MIP
Table 5
Multiple Linear Regression
–
PL predicting INa
H0There will be no significant prediction of INa by PL1, PL2, PL3, PL4, PL5, PL6, PL7, PL8, PL9 and PL10
Model Summary
Model R R Square Adjusted R Square Std. Error of the Estimate Durbin-Watson
1 .471a .222 .220 1.54620 1.648
ANOVA Model Sum of
Squares df Mean Square F Sig.
Regression 2934.876 10 293.488 122.761 .000b
Residual 10289.671 4304 2.391 Total 13224.547 4314
Coefficients
Model
Unstandardized Coefficients
Standardized Coefficients
t Sig.
95.0% Confidence Interval for B
B Error Std β Lower Bound Bound Upper
(Constant) 3.253 .152 21.433 .000 2.955 3.550
PL1 .098 .022 .096 4.360 .000 .054 .142
PL2 .029 .024 .028 1.211 .226 -.018 .077
PL3 .020 .026 .018 .787 .431 -.030 .071
PL4 .153 .025 .143 6.027 .000 .103 .203
PL5 .043 .025 .041 1.717 .086 -.006 .092
PL6 -.009 .022 -.009 -.406 .685 -.052 .034
PL7 .014 .023 .013 .623 .533 -.030 .058
PL8 -.012 .025 -.011 -.481 .631 -.060 .036
PL9 .115 .021 .118 5.425 .000 .073 .156
PL10 .145 .020 .149 7.313 .000 .106 .183
A multiple regression was generated to predict INa based on PL items.
R value of .471 indicated adequate level of prediction (R > 0.4). The
Durbin-Watson statistic was 1.648 which is greater than 1.0 and therefore the data was
not autocorrelated. A significant regression equation was found, F (10, 4304) =
122.761, p = .000, with an R
2of .222; indicating that the proportion of variance
in INa that can be explained by PL items was 22.2%.
At 95% confidence level, PL1 (B = .098, t = 4.36, p = .000); PL4 (B =
.153, t = 6.027, p = .000); PL9 (B = .115, t = 5.425, p = .000); and PL10 (B =
.145, t = 7.313, p = .000) were significant predictors of INa. On the contrary, it
was found that PL2 (B = .029, t = 1.211, p = .226); PL3 (B = .020, t = .787, p =
.431); PL5 (B = .043, t = 1.717, p = .086); PL6 (B = -.009, t = -.406, p = .685);
PL7 (B = .014, t = .623, p = .533) and PL8 (B = -.012, t = -.481, p = .631) were
not significant predictors of INa.
Table 6
Multiple Linear Regression
–
PL predicting
INb
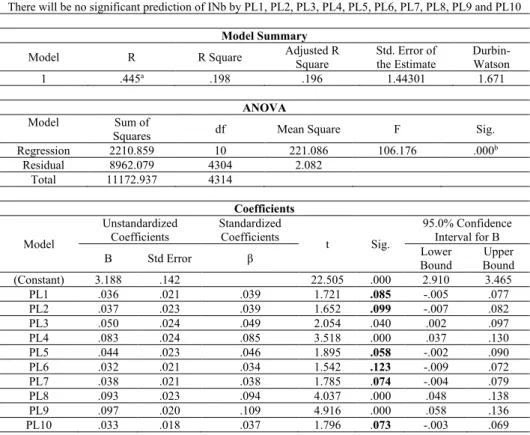
H0There will be no significant prediction of INb by PL1, PL2, PL3, PL4, PL5, PL6, PL7, PL8, PL9 and PL10
Model Summary
Model R R Square Adjusted R Square Std. Error of the Estimate Durbin-Watson
1 .445a .198 .196 1.44301 1.671
ANOVA
Model Sum of
Squares df Mean Square F Sig.
Regression 2210.859 10 221.086 106.176 .000b
Residual 8962.079 4304 2.082 Total 11172.937 4314
Coefficients
Model
Unstandardized Coefficients
Standardized
Coefficients t Sig.
95.0% Confidence Interval for B
B Std Error β Bound Lower Bound Upper
(Constant) 3.188 .142 22.505 .000 2.910 3.465
PL1 .036 .021 .039 1.721 .085 -.005 .077
PL2 .037 .023 .039 1.652 .099 -.007 .082
PL3 .050 .024 .049 2.054 .040 .002 .097
PL4 .083 .024 .085 3.518 .000 .037 .130
PL5 .044 .023 .046 1.895 .058 -.002 .090
PL6 .032 .021 .034 1.542 .123 -.009 .072
PL7 .038 .021 .038 1.785 .074 -.004 .079
PL8 .093 .023 .094 4.037 .000 .048 .138
PL9 .097 .020 .109 4.916 .000 .058 .136
PL10 .033 .018 .037 1.796 .073 -.003 .069
A multiple regression was generated to predict INb based on PL items.
R value of .445 indicated an adequate level of prediction (R > 0.4). The
Durbin-Watson statistic was 1.671 which is greater than 1.0 and therefore the data was
not autocorrelated. A significant regression equation was found, F (10, 4304) =
106.176, p = .000, with an R
2of .198; indicating that the proportion of variance
in INb that can be explained by PL items was 19.8%.
At 95% confidence level, PL3 (B = .050, t = 2.054, p = .040); PL4 (B
= .083, t = 3.518, p = .000); PL8 (B = .093, t = 4.037, p = .000) and PL9 (B =
.097, t = 4.916, p = .000) were significant predictors of INb. On the contrary, it
was found that PL1 (B = .036, t = 1.721, p = .085); PL2 (B = .037, t = 1.652, p =
.099); PL5 (B = .044, t = 1.895, p = .058); PL6 (B = .032, t = 1.542, p = .123);
PL7 (B = .038, t = 1.785, p = .074) and PL10 (B = .033, t = 1.796, p = .073) were
not significant predictors of INb.
PLANNING MALAYSIA
Journal of the Malaysia Institute of Planners (2020)
41
©
2020 by MIP
Table 7
Multiple Linear Regression
–
PL predicting INc
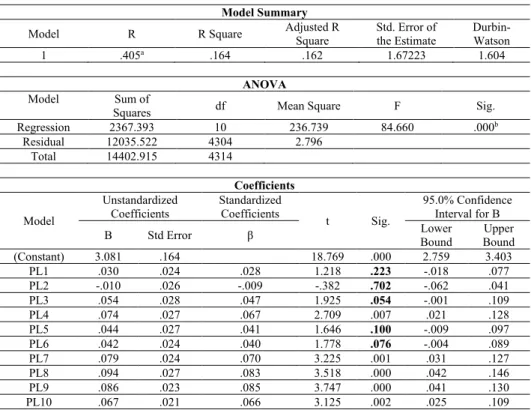
H0There will be no significant prediction of INc by PL1, PL2, PL3, PL4, PL5, PL6, PL7, PL8, PL9 and PL10
Model Summary
Model R R Square Adjusted R Square Std. Error of the Estimate Durbin-Watson
1 .405a .164 .162 1.67223 1.604
ANOVA
Model Sum of
Squares df Mean Square F Sig.
Regression 2367.393 10 236.739 84.660 .000b
Residual 12035.522 4304 2.796 Total 14402.915 4314
Coefficients
Model
Unstandardized Coefficients
Standardized Coefficients
t Sig.
95.0% Confidence Interval for B
B Std Error β Bound Lower Bound Upper
(Constant) 3.081 .164 18.769 .000 2.759 3.403
PL1 .030 .024 .028 1.218 .223 -.018 .077
PL2 -.010 .026 -.009 -.382 .702 -.062 .041
PL3 .054 .028 .047 1.925 .054 -.001 .109
PL4 .074 .027 .067 2.709 .007 .021 .128
PL5 .044 .027 .041 1.646 .100 -.009 .097
PL6 .042 .024 .040 1.778 .076 -.004 .089
PL7 .079 .024 .070 3.225 .001 .031 .127
PL8 .094 .027 .083 3.518 .000 .042 .146
PL9 .086 .023 .085 3.747 .000 .041 .130
PL10 .067 .021 .066 3.125 .002 .025 .109
A multiple regression was generated to predict INa based on PL items.
R value of .405 indicated an adequate level of prediction (R > 0.4). The
Durbin-Watson statistic was 1.604 which is greater than 1.0 and therefore the data was
not autocorrelated. A significant regression equation was found, F (10, 4304) =
84.660, p = .000, with an R
2of .164; indicating that the proportion of variance in
INc that can be explained by PL items was 16.4%.
At 95% confidence level, PL4 (B = .074, t = 2.709, p = .007); PL7 (B
= .079, t = 3.225, p = .001); PL8 (B = .094, t = 3.518, p = .000); PL9 (B = .086, t
= 3.747, p = .000) and PL10 (B = .067, t = 3.125, p = .002) were significant
predictors of INc. On the contrary, it was found that PL1 (B = .030, t = 1.218, p
= .223); PL2 (B = -.010, t = -.382, p = .702); PL3 (B = .054, t = 1.925, p = .054);
PL5 (B = .044, t = 1.646, p = .100) and PL6 (B = .042, t = 1.778, p = .076) were
not significant predictors of INc.
Table 8
Summary of Findings
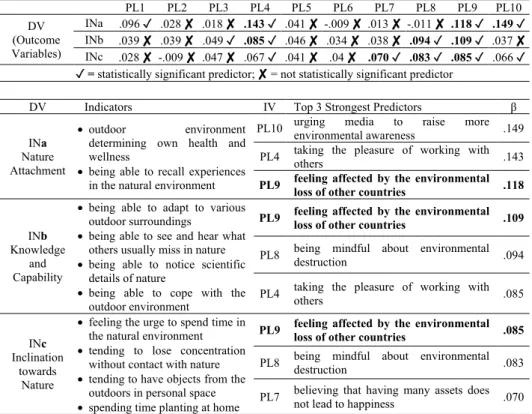
IV (Predictor Variables) - βPL1 PL2 PL3 PL4 PL5 PL6 PL7 PL8 PL9 PL10 DV
(Outcome Variables)
INa .096 ✓ .028 ✘ .018 ✘ .143 ✓ .041 ✘ -.009 ✘ .013 ✘ -.011 ✘ .118 ✓ .149 ✓
INb .039 ✘ .039 ✘ .049 ✓ .085 ✓ .046 ✘ .034 ✘ .038 ✘ .094 ✓ .109 ✓ .037 ✘
INc .028 ✘ -.009 ✘ .047 ✘ .067 ✓ .041 ✘ .04 ✘ .070 ✓ .083 ✓ .085 ✓ .066 ✓ ✓ = statistically significant predictor; ✘ = not statistically significant predictor
DV Indicators IV Top 3 Strongest Predictors β
INa
Nature Attachment
•outdoor environment determining own health and wellness
•being able to recall experiences in the natural environment
PL10 urging environmental awareness media to raise more .149
PL4 taking the pleasure of working with others .143
PL9 feeling affected by the environmental loss of other countries .118
INb
Knowledge and Capability
•being able to adapt to various outdoor surroundings
•being able to see and hear what others usually miss in nature
•being able to notice scientific details of nature
•being able to cope with the outdoor environment
PL9 feeling affected by the environmental loss of other countries .109
PL8 being mindful about environmental destruction .094
PL4 taking the pleasure of working with others .085
INc
Inclination towards
Nature
•feeling the urge to spend time in the natural environment
•tending to lose concentration without contact with nature
•tending to have objects from the outdoors in personal space
•spending time planting at home
PL9 feeling affected by the environmental loss of other countries .085
PL8 being mindful about environmental destruction .083
PL7 believing that having many assets does not lead to happiness .070
The findings revealed that some of the PL items significantly account
for INa, INb and INc. PL9, designating
‘
feeling affected by the environmental
loss of other countries
’
was in the top three strongest predictors across IN
components. The sense of moral responsibilities and concerns on global
environmental problems implicitly and profoundly translate into emotions
towards and aptitudes in the natural environment. Reaching out to people in
different countries to inform on environmental issues are difficult due to language
barriers, illiteracy and cultural differences. Local outreach, media outlets and
classroom education can ease the communication barriers, spread messages and
foster sense of proactive citizenships hence deepen shared empathy towards the
natural surroundings.
CONCLUSION
PLANNING MALAYSIA
Journal of the Malaysia Institute of Planners (2020)