Hungarian Association of Agricultural Informatics European Federation for Information Technology in Agriculture, Food and the Environment
Journal of Agricultural Informatics. Vol. 9, No. 1 journal.magisz.org
A Genetic Programming Study on Classification of Cassava Plant
Indra Laksmana1, Rosda Syelly2, Nurzarah Tazar 3, Perdana Putera 4
I N F O
Received 16 Oct 2017 Accepted 7 Jan 2018
Available on-line 26 Mar 2018 Responsible Editor: M. Herdon
Keywords:
Cassava Varieties, Genetic programming, HCN content, System identification.
A B S T R A C T
Cassava (Manihot esculentaCrantz) is an important plant that is consumed in many forms. It could be processed as vegetable, chips, fodder, or bioethanol through a fermentation process. The cyclic acid HCN of cassava varies based on the varieties. Cassava with high HCN is toxic when it is consumed directly. This research designed a system to identify the cassava varieties based on HCN content by applying a heuristic search algorithm, using genetic operations. The identification of HCN content by applying Generic programming produced a structured classification rule and represents in tree form. The experiment in this study used binary code data generated from booleanizing process. Binary code data is divided into training data and test data using 5-fold cross-validation, and then the process of genetic operation. Rules are derived from repeated experiments to get the best rule. The best rule to identify with an average accuracy of 95.26%, obtained on population parameters of 10,000, 20-30 nodes. The node consists of Function set of AND, OR, NOR and 96 terminal sets (attributes / identifiers); in addition, the best classification rules are obtained on the crossover probability of 0.9 and 0.1 mutations of 10 generations. The resulting Rule can be utilized by the community in identifying the class of HCN cassava content.
1. Introduction
The problems of classification often occur in daily life, such as choosing a vehicle, diagnosing the disease, looking for foods or drugs. It requires someone’s skilled, so the mistakes in the classification of decisions could be minimized. The limitation of skilled increase the error in classifying, therefore an alternative method is needed in determining a solution to classification problem. The selection of appropriate classifier requires consideration of many factors, namely classification accuracy, algorithm and computational performance (Qurat-ul-ain et al. 2010). According to Wahyudi (2013) Classification is a collection of a record in the form of training data set, where each record contains a set of attributes and one attribute is a class.
The concept of artificial intelligence can be used to answer the classification problem. Artificial intelligence has the ability to think, guess an answer or perform the certain tasks such as human behavior that allow beyond human capabilities (Nakamura et al.2017). One of the artificial intelligence solutions that can be used in classification problems is genetic programming. Genetic programming (GP) is used to study patterns of data (Sudharmono. 2012). GP is a variant of the genetic algorithm which uses simulated evolution to discover functional programs to solve some task (Luke 2000). According to Sakprasat and Sinclair (2007), the main motivation for using genetic programming in classification rule mining is robustness and an adaptive search method making it more effective in finding patterns. Laksmana et al (2013) has applied GP programming method in identification of family of medicinal plants with an accuracy of 86.32%, resulting in a hierarchy in identifying medicinal plants.
1 Department Agricultural Engineering, Payakumbuh State Polytechnic of Agriculture [email protected]
2 Computer Engineering Department, Payakumbuh School of Technology [email protected]
3 Department of Food Technology, Payakumbuh State Polytechnic of Agriculture [email protected]
Cassava (Manihot esculenta Crantz)is the third food crop in Indonesia after rice and corn. Cassava in Indonesia, has many regional names such as singkong, ubi jendral, ubi inggris, telo puhung, kasape, bodin, telo jendral, sampeu, huwi dangdeur, huwi jendral, kasbek and ubi perancis. Cassava is frequently used as industrial raw materials, fodder and bioethanol (Purwono and Heni, 2009). Its leaves are used as vegetables and fodder. Its stem used as a fence and planting materials, its seeds can be used as oil and its tuber can be processed as tapioca flour and as bioethanol through the fermentation process. Cassava could directly process directly as West Sumatra traditional food. For example; the boiled cassava as Getuk Kacimuih, the fried cassava as Sanjai chips or Balado chips, etc. The waste of cassava peel can be used to feed goat/sheep (Hanifah 2010). Cassava has many benefits; it encourages the government of West Sumatra to increase the production and productivity of cassava. There are some types of cassava based on the level of cyanide acid (HCN); low, medium, high and very high. Cassava with a large HCN content of 80 mg / kg fresh bulbs tastes bitter and should not be consumed directly. Generally, this cassava is used as flour (Sundari 2010). Cassava has many varieties with varying levels of HCN (Unigwe et al. 2017). The diversity of cassava varieties in Indonesia is quite high. Bank Gen BB-Biogen Bogor recorded as many as 600 germplasm accessions, 452 of which are in the data base (BB-Biogen, 2010). This condition causes a variety of cassava varieties in the field. Therefore, people have to choose which varieties to plant and to consume.
Therefore, there is a need it is need for the research to determine the best rule of classification. This study attempted to apply GP to identify the varieties of tubers based on HCN level of contention. The rule of classification or hierarchy in identifying varieties of yams makes the identification process easier, faster and structured. There is a hope to help people to recognize the varieties of cassava easily so that the selection of cassava varieties to be planted can be adjusted on the allocation.
2. Method
C# programming language was used for running GP. Data collected entirely from the field, it directly taken from 15 people who planted cassava. The types of cassava that taken as the data called by the names given by the local farmers and the community. They are ubi roti, ubi sanjai, ubi putih, ubi lantak, ubi keriting, ubi kuning, ubi hijau, ubi mentega, ubi roti tiakar, ubi BW, ubi merah, ubi hitam, ubi thailand merah, ubi tailan putih and ubi kasesat.
In this study the researchers used 129 cassava plants; consisting of 15 species of cassavaes from various plant locations. Then they are planted in the same location. 10 samples are taken sistematically as the data and used in this study. The content of HCN (Cyanide acid) of the cassava plants data are calculated by using the following formula:
𝑙𝑙𝑙𝑙𝑙𝑙𝑙𝑙𝑙𝑙
𝑜𝑜𝑜𝑜
𝐻𝐻𝐻𝐻𝐻𝐻
=
�
(𝑏𝑏𝑏𝑏𝑏𝑏𝑏𝑏𝑏𝑏𝑏𝑏𝑏𝑏 (𝑚𝑚𝑏𝑏)−𝑡𝑡𝑡𝑡𝑡𝑡𝑡𝑡𝑏𝑏𝑡𝑡𝑡𝑡𝑏𝑏𝑏𝑏(𝑚𝑚𝑏𝑏))𝑥𝑥 𝑁𝑁 𝑥𝑥 27𝑥𝑥100𝑠𝑠𝑏𝑏𝑚𝑚𝑠𝑠𝑏𝑏𝑠𝑠 (𝑏𝑏𝑡𝑡𝑏𝑏𝑚𝑚) 𝑥𝑥 1000� 𝑥𝑥
10.000
Booleanize Fitness evaluation Classification rule Data division Generate rule
Is stop condition fulfiled? Genetic Operation Yes No Evaluation Genetic Programming Test data Training Data Fitness evaluation Classification rule Generate rule
Is stop condition
fulfilled? GenetiC operation Yes No Evaluasi Genetic Programming Test Data Training Data Medium HCN Fitness Evaluation Classification Generate rule
is stop condition
fulfiled Genetic operation Yes No Evaluation Genetic Programming Test data Training data High HCN Low HCN Rule combination Data Collection Data processingf
1st Analyzing
Figure 1. Research stages for identification cassava
2.1. Booleanize
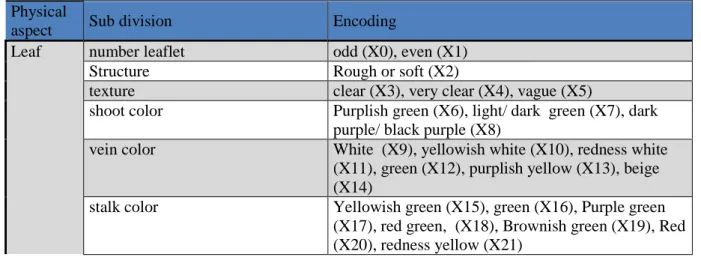
The booleanize performs the encoding which changes the attributes of the identifier to X0, X1 through Xn. The information of each cassava plant will be changed to the binary values of 0 and 1. The number 0 indicates the absence of any characteristics in a variety while the number 1 indicates existence of the characteristic. Each identifier is encoded from X0 to X95. Booleanize of all data used in this study can be seen in Table 1
Table 1. Booleanizing of data Physical
aspect Sub division Encoding
Leaf number leaflet odd (X0), even (X1)
Structure Rough or soft (X2)
texture clear (X3), very clear (X4), vague (X5)
shoot color Purplish green (X6), light/ dark green (X7), dark purple/ black purple (X8)
vein color White (X9), yellowish white (X10), redness white (X11), green (X12), purplish yellow (X13), beige (X14)
high stalk color Green (X22), Brownish green (X23), Redness green (X24), Yelowish green (X25), Green with slightly purple (X26), Redness yellow (X27), Red (X28) leaf stalk length (PTD) cm PTD <=15.5 (X29), 15.6 >PTD>21.5 (X30), PTD
>=21.5 (X31)
leaf width (LHD) cm LHD<=3.7 (X32), 3.7>LDH>5 (X33), LHD>=5 (X34)
leaf length (PHD) cm PHD<=14.3 (X35), 14.3>PHD>17.4 (X36), PHD>=17.4 (X37)
leaf form thick (X38), thin (X39)
leaf weight (BD) gr BD<=0.39 (X40), 0.39>BD>0.62 (X41), BD>=0.62 (X42)
leaf tip form Wide tapered (X43), wide rounded (X44), taper (X45)
Stem stem height (TB) cm TB<=241 (X46), 241>TB>304 (X47), TB>=304 (X48)
young stem color light green (X49), dark green (X50), rednes/purplish green (X51)
old stem color grey (52), light yellow (X53), dark brown green (X54), whitish/redness brown (X55), silver brown (X56), silver and red (X57)
distance of young stem segment (JRBM) mm
JRBM<=35.78 (X58), 35.7>JRBM>45.1 (X59), JRBM>=45.1 (X60)
distance of old stem segment Tua (JRBT) mm
JRBT<=74.5 (X61), 74.5>JRBT>121.8 (X62), JRBT>=121.8 (X63)
stem diameter (DB) mm DB>=21.51 (X64), 21.51>DB>28.47 (X65), DB>=28.47(X66)
number of branch 1 dan 2 (X67), more than 2 (X68) branch form straight (X69), buckle (X70)
tuber outer peel color beige (X71), light brown (X72), Pink (X73), dark brown (X74), light red (X75)
inner peel color white (X76), beige (X77), yellowish (X78) flesh color white (X79), beige (X80), yellowish (X81) thickness of peel (TKU) mm TKU<=1.01 (X82), 1.01>TKU>1.33 (X83),
TKU>=1.33 (X84)
epidermis color brown (X85), dark brown (X86), yellowish (X87) epidermis thicknes (TKA) mm TKA>=0.28 (X88), 1.01>TKA>1.33 (X89),
TKA>=0.54 (X90) Fruit and
Flower
fruitish dan flowerish fruitish (X91), flowerish (X92)
Amount of sap a little (X93), medium (X94), much (X95)
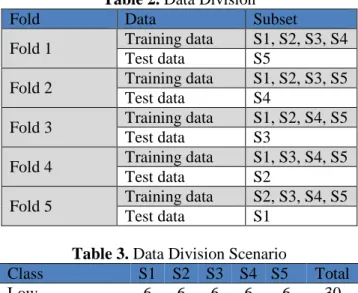
2.2. Data Division
K-fold Cross-validation is used to conduct training and testing. The data is divided equally into K sections and then perform as much as K iteration. If the amount of data (N) is not divisible by K, then the end of the data will have more data than the previous data (K-1). Each iteration, K alternately will be the test data and the K-1 section is used as training data. (Bramer 2007).
Table 2. Data Division
Fold Data Subset
Fold 1 Training data S1, S2, S3, S4 Test data S5
Fold 2 Training data S1, S2, S3, S5 Test data S4
Fold 3 Training data S1, S2, S4, S5 Test data S3
Fold 4 Training data S1, S3, S4, S5 Test data S2
Fold 5 Training data S2, S3, S4, S5 Test data S1
Table 3. Data Division Scenario
Class S1 S2 S3 S4 S5 Total
Low 6 6 6 6 6 30
Medium 12 12 12 12 11 59
High 8 8 8 8 8 40
Total 26 26 26 26 25 129
2.3. Genetic Programming
The Genetic Programming algorithm is designed based on Charles Darwin's theory of evolution by Jhon R. Koza. He was inspired by John Holland who created the Genetic Algorithm. In 1992 Koza applied GP to create a system or computer program that is able to create its own program (Automatic Programming). The method is called Genetic Programming (Lukas 2008), that creates computer program in computer language Lisp, draft scheme as its solution (Koza 1992).
Genetic Programming (Koza 1992) is a search algorithm based on natural system mechanism that is genetic and natural selection (Lukas 2008). The solution variables in GP are encoded into a string structure that represents the gene sequence, which is characteristic of the solution. This set is called population. All individuals in the population are representatives of the solution. Part of the individual is called a chromosome. These chromosomes evolve in a continuous iteration process called a generation. In every generation, the individual is evaluated based on an evaluation function until the genetic programming generation will converge to the best individual. In the hope that this is the optimal solution (Laksmana et al. 2013). Genetic Programming by Poly et al. (2008) is an evolutionary computational technique to automatically solve a problem without the need to be told clearly what to do by determining the shape or structure of the solution at the beginning of the problem.
Gen :=0
Create Initial Random Population
Termination Crite rion Satisfied ?
Designate Result
End
i :=0
Evaluate Fitness of Each Individual in Population
i:=i+1 i=M? Gen := Gen+1
No Yes
Yes
No
Sele ct Genetic Operation Probabilistically
Select One Individual Based on Fitness
Perform Reproduction
Copy into New Population
Sele ct Tw o Individuals Based on Fitness
Perform Crossover
Insert Offspring into New Population
i:=i+1 Sele ct One Individual
Based on Fitness
Perform Mutation
Insert Mutant into New Population Pr
Pc
Pm
Figure 2. Genetic Programming diagram (Koza 1992)
2.3.1. Create initial random population
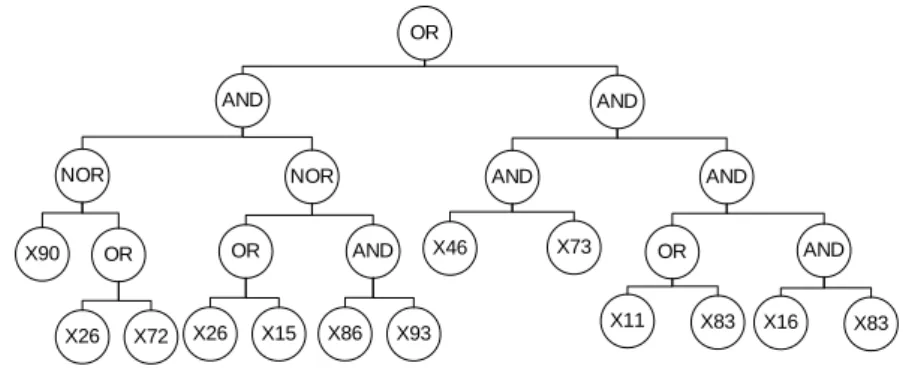
Create initial random population process will generate a number of individuals within a population consisting of set functions and terminal sets that are generated randomly. One individual describes a form of model or rule to be sought. An example of the rules is shown in Figure 3.
AND AND
AND OR
X73 X46
NOR
AND AND
NOR
OR
X83 X11
OR AND
X86 X93 X90 OR
X26 X15 X16 X83
X26 X72
2.3.2. Evaluate fitness
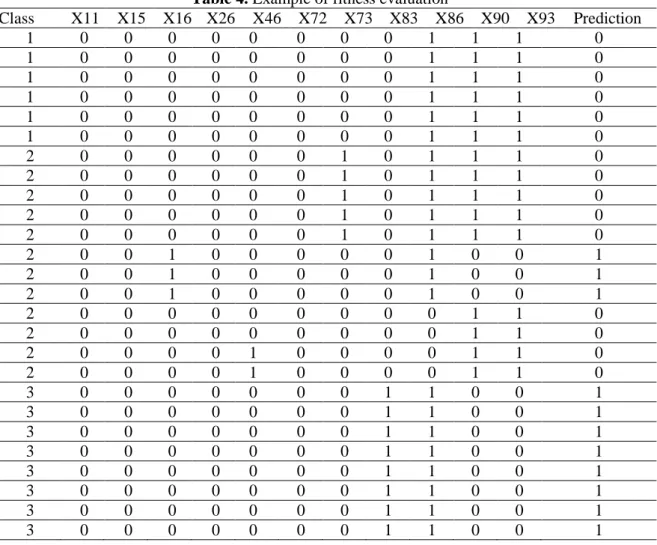
Fitness evaluation is the ratio of the number of errors in predicting the actual results. The fewer number of errors in an individual, the better the individual values are formed. In this research, the fitness value search algorithm by inserting data booleanize results to the rules or individuals selected from the process ‘Create initial random population’. For example the rules generated in Figure 3 and the evaluation data in Table 4, the rules are consist of into 26 data. Six individuals in class 1, 12 individuals in class 2 and 8 individuals in class 3. In the evaluation process the rules in Figure 3 do predictions with result 11 is high class. This means that the rule has 3 strokes with an accuracy of 72.73%
Table 4. Example of fitness evaluation
Class X11 X15 X16 X26 X46 X72 X73 X83 X86 X90 X93 Prediction
1 0 0 0 0 0 0 0 0 1 1 1 0
1 0 0 0 0 0 0 0 0 1 1 1 0
1 0 0 0 0 0 0 0 0 1 1 1 0
1 0 0 0 0 0 0 0 0 1 1 1 0
1 0 0 0 0 0 0 0 0 1 1 1 0
1 0 0 0 0 0 0 0 0 1 1 1 0
2 0 0 0 0 0 0 1 0 1 1 1 0
2 0 0 0 0 0 0 1 0 1 1 1 0
2 0 0 0 0 0 0 1 0 1 1 1 0
2 0 0 0 0 0 0 1 0 1 1 1 0
2 0 0 0 0 0 0 1 0 1 1 1 0
2 0 0 1 0 0 0 0 0 1 0 0 1
2 0 0 1 0 0 0 0 0 1 0 0 1
2 0 0 1 0 0 0 0 0 1 0 0 1
2 0 0 0 0 0 0 0 0 0 1 1 0
2 0 0 0 0 0 0 0 0 0 1 1 0
2 0 0 0 0 1 0 0 0 0 1 1 0
2 0 0 0 0 1 0 0 0 0 1 1 0
3 0 0 0 0 0 0 0 1 1 0 0 1
3 0 0 0 0 0 0 0 1 1 0 0 1
3 0 0 0 0 0 0 0 1 1 0 0 1
3 0 0 0 0 0 0 0 1 1 0 0 1
3 0 0 0 0 0 0 0 1 1 0 0 1
3 0 0 0 0 0 0 0 1 1 0 0 1
3 0 0 0 0 0 0 0 1 1 0 0 1
3 0 0 0 0 0 0 0 1 1 0 0 1
2.3.3. Genetic operation
NOR NOR
OR AND
X86 X93
X90 OR
X26 X15 X26 X72
NOR NOR
OR OR
X26 X72
X90 AND
X26 X15 X86 X93
Figure 4. Crossover evaluation example
The mutation process will take one best rule to make a gene change from the rule. The mutation process can be seen in Figure 5
NOR
OR AND
X86 X93 X26 X15
NOR
OR AND
X86 X93 X9 X15
X9
Figure 5. Mutation operation example
3. Results and discussion
All physical aspects of morphology that have been coded using booleanization process and have been divided into training data and test data using k-fold cross validation according to proportion, then the training process from trainer data according to genetic operation to produce model or classification rules in each class. The parameters used in this training process as shown in Table 5. The results of this process will be done in the next process for examining the data test which has been previously divided.
Table 5. Operation value of Genetic Programming
Parameter Trial
Number of generations 5, 10, 20 Population Size 1000, 10.000
Crossover 0.9
Mutation 0.1
Depth of the tree 5, 7
Max node 25, 30
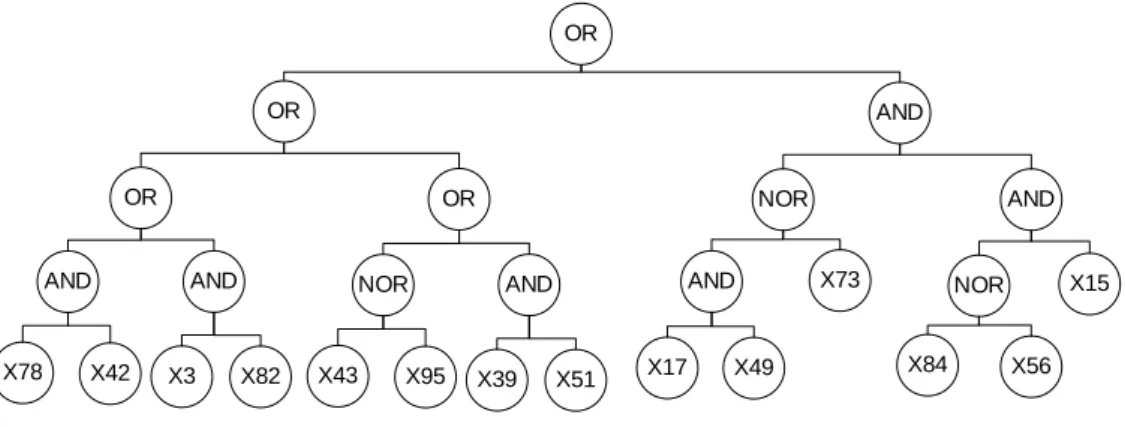
Three classes consisting of 129 cassava plants, 96 attributes of the founder of the training process of Genetic Programming produce the model or classification rules shown in Figure 6 below.
a) High class
NOR AND
OR AND
OR OR
OR OR
AND
X74 X8
X87 X22 X75 X28
OR AND
X93 X68 X56 X82
NOR NOR
X73 X77 X92 X6
Figure 6. High class rule IF
The outer peel of the tubers is dark brown (X74)
OR
The color of shoots is dark purple / purple black (X8)
AND
The epidermis color is light yellow (X73) NOR is the color of stalk top beige (X77)
OR
Flowering (X92) NOR the color of shoot of purplish green (X6)
AND
The outer peel of the tubers is yellowish (X87) OR the color of the top stems is green (X22)
AND
Peel color outer pink tuber (X75) OR Color of the upper red leaf stalk (X28)
OR
The sap of the tuber is little (X93) AND number of branches more than two (X68)
NOR
The color of the old stem is brownish brown (X56) OR thickness of peel tubers is equal to 1.01mm (X82)
Then High class
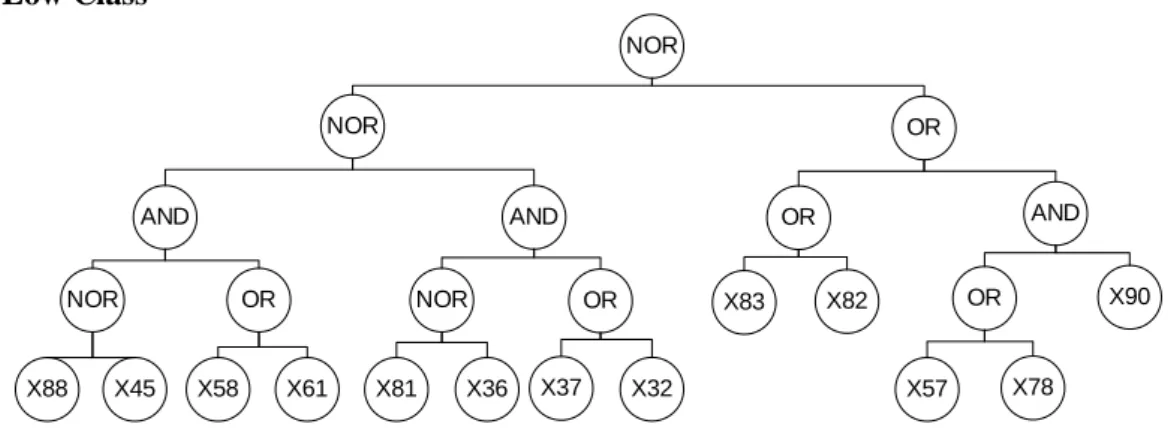
b) Medium Class
AND NOR
AND OR
X73 AND
OR
X15 OR
OR
NOR
X56 X84
X17 X49
AND AND
X78 X42 X3 X82
NOR AND
X43 X95 X39 X51
Figure 7. Medium class rule
IF
The color of the lower stalk leaf yellowish green (X15)
AND
Thickness of tuber peel higher and equal to 1.33mm (X84) NOR Color of stem is dark silver brown (X56)
AND
Outer peel of tuber is dark brown (X73)
NOR
The color of lower stalk green / purple (X17) AND light green stem color (X49))
OR
Peel color inside tuber is yellowish (X78) AND weight of leaf higher than or equal to 0.62 g (X42)
OR
Texture of leaf vein is clear (X3) AND Thickness of peel tuber lower than or equal to 1.01 (X82)
OR
Leaf form is wide tapered (X43) NOR much sap (X95)
OR
Leaf form is thin (X39) AND Color of young stem is redness/ purplish green (X51)
THEN Medium class
C) Low Class
OR
OR NOR
X82 X83
AND AND
NOR
OR NOR
AND
X90 OR
X78 X57
NOR
X45 X88
OR
X61
X58 X81 X36 X37 X32
Figure 8. Low class rule
IF
Thickness of epidermis higher than or equal to 0.54mm (X90)
AND
Colour of inner peel is yellowish (X78) OR Colour of old stem is silver and red (X57)
OR
Thickness of peel is between 1.01mm to 1.33mm (X83)
OR
Thickness of peel lower or equal to 1.01mm (X82))
NOR
Width of leaf lower than or equal 3.7 cm (X32) OR Height of leaf higher than or equal to 17.4 cm (X37)
AND
Flesh of tuber is yellowish (X81) NOR Width of leaf is between 14.3 to 17.4 cm (X36)
NOR
Thickness of epidermis higher than or equal to 0.28 (X88) NOR Form of leaf tip is taper (X45))
AND
Distance of young stem segment is lower than or equal to 35.78 mm (X58) OR Distance of old stem segment is lower than or equal to 74.5 mm (X61)
THEN Low class
4. Evaluation
The Cassava data which are divided into three classes based on its HCN content i.e. low class containing less HCN 50 mg / kg, medium class containing HCN between 50 and 80 mg / kg and high class containing HCN more than 80 mg/ kg. Each class is divided into train data and test data using K-Fold Cross Validation with K = 5. In fold 1 there are 104 data train and 25 data are used as test data. The results of each fold can be seen in Table 6.
Table 6 Experiment result of each class High class
Fold1 0 0 0 0 0 0 0 0 0 0 0 0 0 0 0 0 0 1 1 1 1 1 1 1 1 Fold2 0 0 0 0 0 0 0 0 0 0 0 0 0 0 0 0 0 0 1 1 1 1 1 1 1 1 Fold3 0 0 0 0 0 0 0 0 0 0 0 0 0 0 0 0 0 0 1 1 1 1 1 1 1 1 Fold4 0 0 0 0 0 0 0 0 0 0 0 0 0 0 0 0 0 0 1 1 1 1 1 1 1 1 Fold5 0 0 0 0 0 0 0 0 0 0 0 1 1 1 0 0 0 0 1 1 1 1 1 1 1 1 Medium Class
Fold1 0 0 0 0 0 0 1 1 1 1 1 1 1 1 1 1 1 0 0 0 0 0 0 0 0 Fold2 0 0 0 0 0 0 1 1 1 1 1 1 1 1 1 1 1 1 0 1 0 0 0 0 0 0 Fold3 0 0 0 0 0 0 1 1 1 1 1 1 1 1 1 1 1 1 0 0 0 0 0 0 0 0 Fold4 0 0 0 0 0 0 1 1 1 1 1 1 1 1 1 1 1 1 0 0 0 0 0 0 0 0 Fold5 0 0 0 0 0 0 1 1 1 1 1 0 0 0 1 1 1 1 0 0 0 0 0 0 0 0 Low class
Fold1 1 1 1 1 1 1 0 0 0 0 0 0 0 0 0 0 0 1 0 0 0 0 0 0 0 Fold2 1 1 1 1 1 1 0 0 0 0 0 0 0 0 0 0 0 0 0 0 0 0 0 0 0 0 Fold3 1 1 1 1 1 1 0 0 0 0 0 0 0 0 0 0 0 0 0 0 0 0 0 0 0 0 Fold4 1 1 1 1 1 1 0 0 0 0 0 0 0 0 0 0 0 0 0 0 0 0 0 0 0 0 Fold5 1 1 1 1 1 1 1 1 1 1 1 0 0 0 0 0 0 0 0 0 0 0 0 0 0 0 Experiments conducted repeatedly, and experiments are best taken as classification rules. There are five rules according to the distribution of K-Fold Cross Validation data generated by each class in each fold. The accuracy level generated on each fold using the confusion matrix table of the model or the rules generated by the genetic programming process in each respectively, as shown in Table 7 to Table 11 below
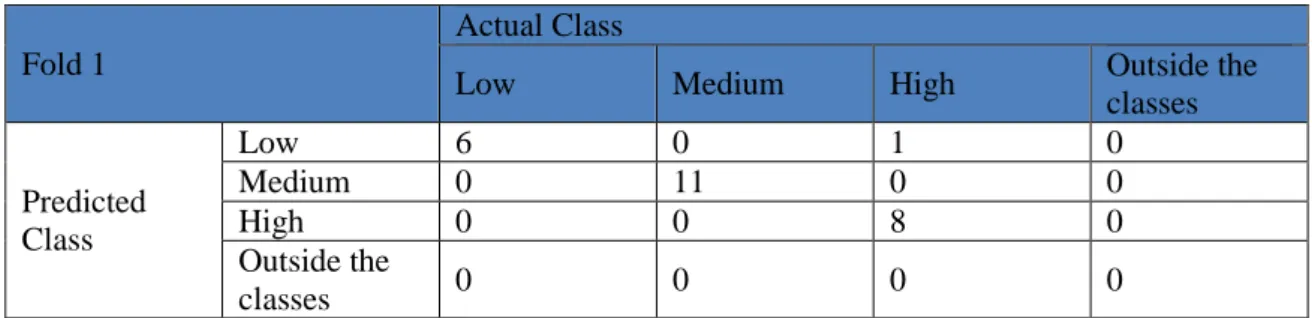
Table 7. Confusion Matrix Fold 1
Fold 1
Actual Class
Low Medium High Outside the
classes
Predicted Class
Low 6 0 1 0
Medium 0 11 0 0
High 0 0 8 0
Outside the
classes 0 0 0 0
In fold 1 there were 25 test data consisting of 6 low class data, 11 medium classes and 8 high classes. As seen in Table 7 above there was one mistake, i.e. one high-class sweet potato data also detected as low class. This error occurs because of the similarity of the data of cinnamon plant founder in high class with low class. This error occurs on the type of cassette tuber. The accuracy for identification in fold 1 is 96.15%, obtained from the following calculations:
Table 8. Confusion Matrix Fold 2
Fold 2
Actual Class
Low Medium High Outside the
classes
Predicted Class
Low 6 0 0 0
Medium 0 12 1 0
High 0 0 8 0
Outside the
classes 0 0 0 0
There are 26 data of cassava that used as test data on fold 2, 26 data that consist of 6 data of low class, 12 medium class and 8 high class. Seen in Table 8 above there was one mistake, one high-quality cassava data also detected as a medium class. This error occurs because of the similarity of the data of cassava cultivator in high class with medium class. This error occurs in the white Tailan cassava type. The accuracy for identification in fold 2 is 96.30%, obtained from the following calculations.
𝐴𝐴𝐴𝐴𝐴𝐴𝐴𝐴𝐴𝐴𝐴𝐴𝐴𝐴𝐴𝐴𝑜𝑜𝐴𝐴𝑜𝑜𝑜𝑜𝑙𝑙𝑓𝑓 2 =6 + 12 + 8 + 16 + 12 + 8 𝑥𝑥 100% = 96.30%
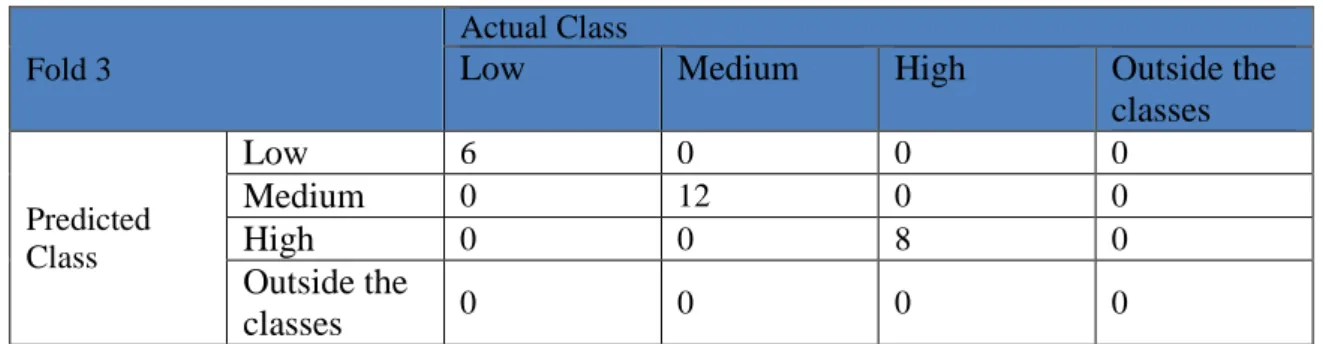
Table 9. Confusion Matrix Fold 3
Fold 3
Actual Class
Low
Medium
High
Outside the
classes
Predicted Class
Low
6 0 0 0Medium
0 12 0 0High
0 0 8 0Outside the
classes
0 0 0 0Test data on the fold 3 contained 26 data of cassavaes consisting of 6 low class yam, 12 medium and 8 high class. In Table 9 above there is no error. The accuracy for identification in fold 3 is 96.15%, obtained from the following calculations
𝐴𝐴𝐴𝐴𝐴𝐴𝐴𝐴𝐴𝐴𝐴𝐴𝐴𝐴𝐴𝐴𝑜𝑜𝐴𝐴𝑜𝑜𝑜𝑜𝑙𝑙𝑓𝑓 3 =6+12+86+12+8x 100% = 100%
Table 10. Confusion Matrix Fold 4
Fold 4
Actual Class
Low Medium High Outside the
classes
Predicted Class
Low 6 0 0 0
Medium 0 12 0 0
High 0 0 8 0
Outside the
classes 0 0 0 0
It can be seen in Table 10, fold 4 with 26 cassava data as test data consisting of 6 low class yam, 12 medium and 8 high class, genetic programming process in generating excellent model or rule, yielding 100% accuracy rate with calculation as following
Table 11. Confusion Matrix Fold 5
Fold 5
Actual Class
Low
Medium
High
Outside the
classes
Predicted Class
Low
6 5 0 0Medium
0 9 0 0High
0 3 8 0Outside the
classes
0 0 0 0Seen in Table 11 there are 2 types of errors from the 26 test data consist of 6 in low class, 12 in medium class and 8 in high class. Both types of these errors occur in the medium class. The first mistake that there are three data of class yam is identified to the high class, this type of cassava is curly curl whose data is taken from Pekanbaru riau. The second mistake is that five data of cassava is being detected as low class, this type of cassava is yam lantak. The accuracy for identification on this fold is 83.87%, obtained from the following calculations.
Accuration fold 5=6+9+8+3+56+9+8 x 100% = 83.87%
Evaluation of the performance of the system obtained can be calculated from the average accuracy value of all the fold very good result that is equal to 95.26%, with the following calculation
𝐴𝐴𝐴𝐴𝐴𝐴𝐴𝐴𝐴𝐴𝐴𝐴𝐴𝐴𝐴𝐴𝑜𝑜𝐴𝐴=96.15+96.30+100+100+83.875 x 100% = 95.26%
5. Conclusion
Cassava contains a toxin called cyanide acid (HCN). In this study the cyanide acid content of cassava was classified into three classes (low containing 50 mg/kg HCN), medium (containing HCN between 50 and 80 mg/kg) and high (containing HCN more than 80 mg/kg).
The cassava identification system by applying a heuristic search algorithm using genetic operations produces a simple and structured identification model and can be used to locate classification rules with good accuracy.
These three classes are divided into training data and test data by using K-fold cross validation technique with K = 5, genetic programming process using AND, OR and NOR operators and as many as 96 identification is done repeatedly to get the best model or rule, the best performance accuracy were derived at 95.26%.
Acknowledgment
The authors would like to thank Ministry of Research Technology and Higher Education of Indonesia for funding this research through applied product research scheme 2017.
References
BB-Biogen 2010 ‘Buku Katalog Plasma Nutfah Tanaman Pangan 2010’ Balai Besar Litbang Biogen. Bogor. Bramer M. 2007 ‘Principles of Data Mining. London (GB)’ Springer.
Carvalho M.G, Laender A.H, Goncalves M.A, and Silvia A.S. 2012 ‘A Genetic Programming Approach to Record Deduplication’ IEEE Transactions on Knowledge and Data Engineering, Vol. 24, No. 3.
https://doi.org/10.1109/TKDE.2010.234
Koza JR 1992 ‘Genetic Programming On the Programming of Computers by Means of Natural Selection’ London (US): MIT Press
Laksmana I, Herdiyeni Y, Zuhud EAM. 2013 ‘Genetic Programming for Medicinal Plant Family Identification System’ Journal Of Research and Applications, vol 4 no (3), pp. 217-234
Luke S. 2000. Two Fast Tree-Creation Algorithms for Genetic Programming. IEEE Transactions on Evolutionary Computation, Vol. 4, No. 3. USA: Department of Computer Science, University of Maryland. https://doi.org/10.1109/4235.873237
Lukas, Iskandar.A. 2008 ‘Permainan Catur Akhir King-Rook-King (KRK) Menggunakan Pemrograman Genetika’ Konferensi Nasional Sistem dan Informatika (2008 Nov 15); Bali, Indonesia (ID)KNS. 328-334 Nakamura K, Morita T and Yamaguchi. 2017. ‘A User-Centric Platform PRINTEPS to Develop Integrated Intelligent Applications and Application to Robot Teahouse’ Procedia Computer Science. Vol. 112, pp 2309-2318. https://doi.org/10.1016/j.procs.2017.08.266
Purwono and Heni Purnamawati 2009. ‘Budidaya 8 Jenis Tanaman Pangan Unggul’ Penebar Swadaya Qurat-ul-ain, Latif G, Kazmi SB, Jaffar MA, Mirza AM. 2010 ‘Classification and segmentation of brain tumor using texture analysis’ Proceeding AIKED'10 Proceedings of the 9th WSEAS international conference on Artificial intelligence, knowledge engineering and data bases. Wisconsin (US). pp 147-155.
Sakprasat S, Sinclair MC. 2007 ’Classification rule mining for automatic credit approval using genetic programming’ IEEE Congress on Evolutionary Computation 7 pp548-555.
Sudharmono M. 2012 ‘Pengenalan Varietas kunyit berdasarkan ciri fisik menggunakan Genetic Programming dengan Praproses Booleanizing’. Departemen Ilmu Komputer FMIPA Institud pertanian Bogor
Unigwe, Cyprian Robinson, Raji, Ademola Moshood, Ajayi, John Olurotimi, Popoola, Abiola Moshood, Balogun, Fatima Adeola and Adekunle, Femi Olayinka. 2017. ‘Carcass, Organ Weights and Histo-morphology of Internal Organs of Sows Fed Fermented and Enzyme Supplemented Cassava Peels Meal (CPM) Based Diets’ Journal of Plant and Animal Sciences Vol. 2 No 1, pp. 026-036.