The Effect of Play Type and Collision Closing Distance on Head Impact Biomechanics
Karen Elaine Ocwieja
A thesis submitted to the faculty of the University of North Carolina at Chapel Hill in partial fulfillment of the requirements for the degree of Master of Arts in the Department of Exercise and Sport Science (Athletic Training) in the College of Arts & Sciences.
Chapel Hill 2011
Approved by: Jason P. Mihalik, PhD, CAT(C), ATC (Chair) Kevin M. Guskiewicz, PhD, ATC (Reader) Stephen W. Marshall, PhD (Reader) Julianne D. Toler, MA, ATC (Ex Officio)
ii © 2011
iii ABSTRACT
KAREN ELAINE OCWIEJA: The Effect of Play Type and Collision Closing Distance on Head Impact Biomechanics
(Under the direction of Jason P. Mihalik)
Football accounts for 55% of all concussions that collegiate athletes sustain. Kickoffs and punts have a greater risk of concussion than rushing and passing plays. The purpose of this study was to determine the effect of special team plays and closing
distance of collisions on head impact biomechanics. Forty-six collegiate football players participated in the study. We used real-time data collection instrumentation to record head impact biomechanics during games for the three following play types: special teams, offense, and defense. Collisions occurring on special teams over long closing distances were the most severe impacts while collisions occurring on special teams and defense over short closing distances were the least severe impacts. Our findings indicate that impacts following long closing distances result in more severe head impacts;
iv
ACKNOWLEDGEMENTS
v
TABLE OF CONTENTS
LIST OF TABLES ... IX!
LIST OF FIGURES ... X!
CHAPTER I ... 1!
RESEARCH QUESTIONS ... 4!
Research Question 1 ... 4!
Research Question 2 ... 4!
VARIABLES ... 5!
Independent Variables ... 5!
Dependent Variables ... 5!
NULL HYPOTHESES ... 6!
Research Question 1 ... 6!
Research Question 2 ... 6!
RESEARCH HYPOTHESES ... 7!
Research Question 1 ... 7!
Research Question 2 ... 7!
OPERATIONAL DEFINITIONS ... 8!
ASSUMPTIONS ... 9!
vi
DELIMITATIONS ... 10!
SIGNIFICANCE OF THE STUDY ... 10!
CHAPTER II ... 12!
EPIDEMIOLOGY ... 12!
High School Programs ... 13!
College Programs ... 14!
Professional Programs ... 16!
PATHOLOGY ... 17!
MECHANISM OF INJURY ... 19!
High School Programs ... 19!
College Programs ... 20!
Professional Programs ... 21!
RISK PREDICTION ... 22!
High School Programs ... 23!
College Programs ... 23!
Professional Programs ... 24!
METHODOLOGICAL CONSIDERATIONS ... 25!
SUMMARY ... 26!
CHAPTER III ... 29!
PARTICIPANTS AND STUDY DESIGN ... 29!
INSTRUMENTATION ... 29!
vii
Miscellaneous Equipment ... 30!
DATA COLLECTION ... 31!
Synchronization of Time of Day and Game Clock ... 31!
Evaluation of Video Footage ... 32!
DATA REDUCTION ... 33!
DATA ANALYSIS ... 34!
CHAPTER IV ... 37!
RESEARCH QUESTION ONE ... 37!
Effects of Play Type and Closing Distance on Linear Acceleration ... 37!
Effects of Play Type and Closing Distance on Rotational Acceleration ... 38!
Effects of Play Type and Closing Distance on HITsp ... 39!
RESEARCH QUESTION TWO ... 40!
Association between Play Type and Head Impact Severity ... 40!
Association between Closing Distance and Head Impact Severity ... 40!
EXPLORATORY ANALYSES ... 41!
CHAPTER V ... 51!
CLINICAL IMPLICATIONS ... 54!
CLINICAL SIGNIFICANCE ... 57!
LIMITATIONS ... 57!
FURTHER RESEARCH ... 59!
viii
APPENDIX B ... 62!
ix
LIST OF TABLES
Table 3.1: Statistical Analyses ... 35
Table 3.2: Categorized Head Impact Severity Values ... 36
Table 4.1: Descriptive and Statistical Results for Main Effects ... 43
Table 4.2: Categorized Head Impact Severity and Play Type: Linear ... 44
Table 4.3: Categorized Head Impact Severity and Play Type: Rotational ... 45
Table 4.4: Categorized Head Impact Severity and Closing Distance: Linear ... 46
x
LIST OF FIGURES
CHAPTER I INTRODUCTION
Concussions continue to be a difficult condition for many sports medicine professionals to manage. Annually, there are 50,000 deaths, 235,000 hospitalizations, 1,111,000 emergency room visits and an unknown number of concussions that are not reported or treated outside of the hospital setting in the United States (Langlois, Rutland-Brown, & Wald, 2006). Football accounts for 55% of concussions in collegiate athletics (Hootman, Dick, & Agel, 2007). Concussions account for 6.8% of all football-related injuries (Dick, et al., 2007).
Over the past 16 years there has been a 7% increase in concussions (Hootman, et al., 2007). The recent increase in concussions may be explained by an increase in recognition and reporting of the injury. Therefore, there is a concern about the growing number of concussions reported. The incidence rate of concussion has been reported as 2.34 per 1000 athlete-exposures (Dick, et al., 2007). The risks that concussions pose to athletes are significant if the injury is not managed appropriately. The short-term and long-term complications of previous concussions are receiving widespread notice
(Covassin, Elbin, & Nakayama, 2010; Guskiewicz, Marshall, et al., 2007; Kuehl, Snyder, Erickson, & McLeod, 2010). Immediately following a concussion an athlete can
2
and may neglect their school work or treatment (Kuehl, et al., 2010). Negative outcomes occurring in previously healthy athletes following multiple concussions have been shown in professional and college athletes (Guskiewicz, Marshall, et al., 2007; Kuehl, et al., 2010).
Although there is research assessing how concussions affect the ability of the brain to work and process, there is a lack of understanding of the mechanism of injury leading to concussion. To help better understand how concussions occur, many
researchers have quantified head impact severity using linear acceleration and rotational acceleration. Research has and continues to be conducted on high school (Broglio, et al., 2010; Broglio, et al., 2009; Gessel, Fields, Collins, Dick, & Comstock, 2007; Greenwald, Gwin, Chu, & Crisco, 2008; Schnebel, Gwin, Anderson, & Gatlin, 2007), college
(Brolinson, et al., 2006; M. W. Collins, et al., 1999; Duma, et al., 2005; Greenwald, et al., 2008; Guskiewicz, Mihalik, et al., 2007; Kuehl, et al., 2010; McCaffrey, Mihalik,
Crowell, Shields, & Guskiewicz, 2007; McCrea, et al., 2003; Mihalik, Bell, Marshall, & Guskiewicz, 2007), and professional football players (Guskiewicz, Marshall, et al., 2007; Hamberger, Viano, Saljo, & Bolouri, 2009; Pellman, et al., 2004; Pellman, Viano,
Tucker, Casson, & Waeckerle, 2003; Viano, Casson, & Pellman, 2007; Viano & Pellman, 2005; Viano, Pellman, Withnall, & Shewchenko, 2006; Zhang, Yang, & King, 2004).
Previously, a history of multiple concussions has been linked with a higher incidence of depression amongst National Football League players (Guskiewicz,
3
concussions have shown a negative perceived affect on their ability to have a full social life (Kuehl, et al., 2010). Multiple concussions have the potential to affect the quality of life and mental health of athletes, and while it is important to know how to manage concussions when they occur, preventing concussion is the greatest defense.
Previous studies suggest that football players encounter a greater number of head impacts during practice and these impacts tend to be of greater severity than those
sustained during competition (Mihalik, et al., 2007). Although most football concussions occur in practice, football players are 11 times more likely to sustain a concussion during a game than during practice (Dick, et al., 2007). Current literature has not addressed if players on special teams experience more severe impacts than players on either offense or defense. In the National Football League, kickoffs and punts had the greatest risk for concussion at 9.29 per 1000 plays and 3.86 per 1000 plays, respectively. Rushing plays and passing plays had a lower risk for concussion at 2.24 per 1000 plays and 2.14 per 1000 plays, respectively (Pellman, et al., 2004; Viano, et al., 2007). Anecdotally, harder hits occur after traveling a long distance and skill players have been shown to experience more severe impacts than line players (Schnebel, et al., 2007). There is also a concern that special team impacts are more likely to involve a long closing distance, resulting in a greater risk of injury. Therefore, the purpose of this study was to determine if special team players experience more severe head impacts than offensive and defensive players during competitions. A secondary purpose was to determine if collisions occurring after a long closing distance are more severe than those occurring after a short closing
4 Research Questions
Research Question 1 examined three separate dependent variables associated with head impact biomechanics: linear acceleration (expressed relative to gravitational acceleration in g), rotational acceleration (measured in radians/s2), and Head Impact Technology severity profile (HITsp). Research Question 2 examined head impact severity— categorized as mild, moderate, or severe—for both linear acceleration and rotational acceleration.
Research Question 1
Do football players experience significant differences in biomechanical measures of head impact severity across play type and closing distance?
RQ1a: What is the interaction effect of play type and closing distance on biomechanical measures of head impact severity?
RQ1b: What is the main effect of play type on the biomechanical measures of head impact severity?
RQ1c: What is the main effect of closing distance on the biomechanical measures of head impact severity?
Research Question 2
Is there a significant association between play type or closing distance and categorized head impact severity?
5
RQ2B: Is there a significant association between closing distance and categorized head impact severity?
Variables
Independent Variables 1. Play Type
i. Special Teams ii. Offense iii. Defense
2. Collision Closing Distance i. Long Closing Distance ii. Short Closing Distance
3. Categorized Head Impact Severity by Linear Acceleration i. Mild
ii. Moderate iii. Severe
4. Categorized Head Impact Severity by Rotational Acceleration i. Mild
ii. Moderate iii. Severe
Dependent Variables
1. Linear Acceleration (g)
6
3. Head Impact Technology severity profile (HITsp)
Null Hypotheses
Research Question 1
There will be no significant differences on biomechanical measures of head impact severity sustained by football players across play type and closing distance.
Ho 1A: There will be no significant interaction effect of play type and closing distance, on biomechanical measures of head impact severity.
Ho 1B: There will be no significant effect of play type on biomechanical measures of head impact severity.
Ho 1C: There will be no significant effect of closing distance on the biomechanics of head impact severity.
Research Question 2
There will be no significant association between play type or closing distance and categorized head impact severity.
Ho 2A: There will be no significant association between play type and categorized head impact severity.
7 Research Hypotheses
Research Question 1
Players on special teams will experience more severe biomechanical measures of head impact severity during long closing distance collisions than players participating on traditional offensive and defensive plays during short closing distance collisions.
RH1A: Special team’s collisions following long closing distances will experience greater biomechanical measures of head impact severity than those following short closing distances of offensive and defensive plays.
RH1B: Players will experience greater biomechanical measures of head impact severity during special team plays compared to offensive and defensive plays. RH1C: Players will experience greater biomechanical measures of head impact severity following long closing distance impacts compared to short closing distance collisions.
Research Question 2
There will be an association between special team’s plays and closing distance and severe head impacts.
RH2A: There will be an association between play type and severe head impacts, such that there will be a greater number of severe impacts occurring during special teams compared to offensive and defensive plays.
8 Operational Definitions
Head impact: A head impact will be defined as those head impacts measuring greater than or equal to 10g (Guskiewicz, Mihalik, et al., 2007; McCaffrey, et al., 2007; Mihalik, et al., 2007; Schnebel, et al., 2007).
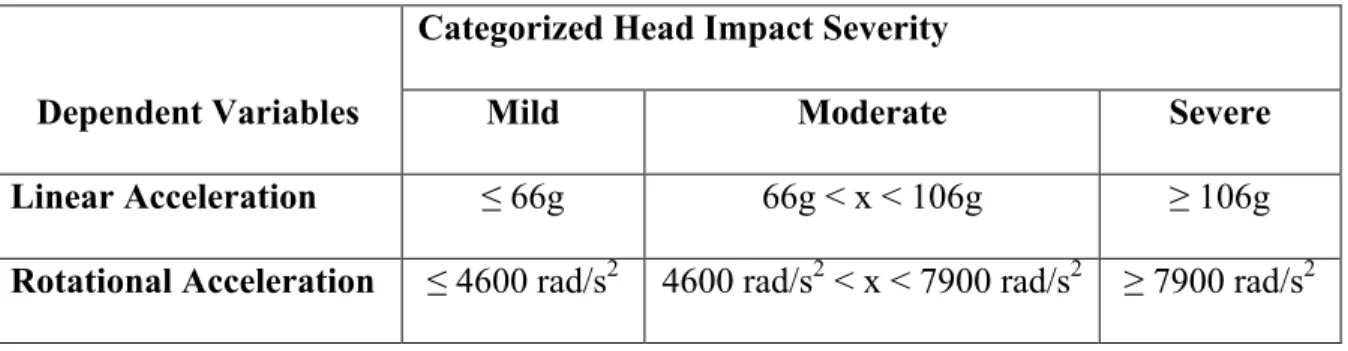
Severe linear acceleration head impact: A severe head impact will be defined as those head impacts measuring greater than or equal to 106 g in linear acceleration (Zhang, et al., 2004).
Moderate linear acceleration head impact: A moderate head impact will be defined as those head impacts measuring greater than 66 g and less than 106 g in linear acceleration (Zhang, et al., 2004).
Mild linear acceleration head impact: A mild head impact will be defined as those head impacts measuring less than or equal to 66 g in linear acceleration (Zhang, et al., 2004). Severe rotational acceleration head impact: A severe rotational head impact will be defined as those head impacts measuring greater than or equal to 7900 rad/s2 in rotational acceleration (Zhang, et al., 2004).
Moderate rotational acceleration head impact: A moderate head impact will be defined as those head impacts measuring greater than 4600 rad/s2 and less than 7900 rad/s2 in rotational acceleration (Zhang, et al., 2004).
Mild rotational acceleration head impact: A mild head impact will be defined as those head impacts measuring less than or equal to 4600 rad/s2 in rotational acceleration (Zhang, et al., 2004).
9
kickoff or punt. Common terms for special team plays are: kickoffs, kickoff return, punt, and punt return.
Miscellaneous special teams: Special team plays outside the “Big 4”, such as extra point attempt and field goals. Common terms for special teams that will be classified are: field goal, field goal block, extra point attempt, and extra point attempt block.
Offense: Offensive plays will be considered to have occurred when the team
participating in the study has possession of the ball and intends to maintain possession of the ball.
Defense: Defensive plays will be considered to have occurred when the team not
participating in the study has possession of the ball and intends to maintain possession of the ball.
Long Closing Distance: All player to player collisions where the combined distance traveled by both players to the collision is greater than or equal to ten yards.
Short Closing Distance: All player-to-player collisions where the combined distance traveled by both players to the collision is less than ten yards.
Assumptions
1. The helmets will be fitted properly at the beginning of the season and remain properly fitted throughout the season.
2. The Head Impact Telemetry (HIT) System accurately records the impacts players sustain.
Limitations
10 Delimitations
1. Data collection is limited to only competitions during one football season. 2. College football players from one institution will be studied.
3. Measurement of ten yards was estimated using the markings on the field.
Significance of the Study
This study will allow us to better understand the nature of head impacts sustained during football competitions. It has recently been speculated that special team plays and long closing distance impacts may explain the disproportionate increase in concussions observed during competitions compared to practice. This study will not look at the effect of play type and closing distance on a concussion, but it will allow us to better understand whether special team plays and long closing distance collisions are more likely to result in severe measures of head impact severity.
Research has shown that offensive backs are the most likely to experience impacts with accelerations greater than 80 g, which may be a result of the distance the athlete covers to prior the line of scrimmage (Mihalik, et al., 2007). However, this study did not examine play type and the analyses did not discriminate between special team players and other playing positions. Previous research has not delineated impacts according to closing distance; this study will allow us to determine if impacts occurring to players after long closing distance are more severe than those impacts occurring to players after a short closing distance.
11
CHAPTER II
REVIEW OF THE LITERATURE
The literature on sport-related concussions delves into the many areas related to the prevention, assessment, diagnosis and treatment of these injuries. Prevention
continues to be the best medicine for concussions (Vastag, 2002). Understanding which types of impacts cause concussions can lead to their prevention. Researchers are
addressing this question in different ways and making recommendations for rule changes and policy changes based upon their findings. Rule changes barring spear tackling have reduced the risk of cervical spine injury (Dick, et al., 2007). Research has shown that head-down tackling increases the concussion injury risk to the player being struck, while decreasing injury risk to the striking player (Viano & Pellman, 2005). While altering playing technique can decrease the risk of injury (Heck et al), football players are at risk for concussions. Football is widely used as a focus due to the high prevalence of
concussions sustained in high school, college, and professional football (Dick, et al., 2007). The purpose of this literature review is to present the current research relating to sport-related concussions with a particular emphasis on head impact biomechanics.
Epidemiology
13
treated outside of emergency departments. Annually, 60 billion dollars are spent on the treatment of concussions (Langlois, et al., 2006). Sport related concussions in the United States occur at a rate of 1.6 to 3.8 million a year (Langlois, et al., 2006). Football has been shown to have the highest concussion rate among sports (Gessel, et al., 2007). Incidence of concussions in football varies across levels of experience and can be broken down into three categories: high school, college, and professional programs.
High School Programs
Concussions account for 8.9% of high school sport injuries (Gessel, et al., 2007). Of those concussions, 65.4% occurred in games and 34.6% in practices (Gessel, et al., 2007). Overall, concussions resulted at a rate of 0.23 per 1000 athlete-exposures. The rate of concussions was higher during games (0.53 concussions per 1000
athlete-exposures) then during practices (0.11 concussions per 1000 athlete-athlete-exposures) (Gessel, et al., 2007).
14
High school and college athletics see more concussions in football than in any other sport at the same level, as well as more concussions in games than in practices (Dick, et al., 2007; Gessel, et al., 2007; Guskiewicz, et al., 2003). Research disagrees on if offense experiences more concussions than defense (Dick, et al., 2007; Pellman, et al., 2004), or vice versa (Gessel, et al., 2007; Guskiewicz, et al., 2003). So far the debate has minimally included special teams.
High school football programs saw more concussions occur during rushing and passing plays (Gessel, et al., 2007). In professional football programs it was found that more concussions occur during special team plays, kickoff coverage and punts rather than during traditional offensive and defensive plays (Pellman, et al., 2004). The added speed and physicality of the professional game can account for the differences observed from high school and when injuries are likely to occur. The differences observed within the varying programs shows the importance for concussion research at all levels of football.
College Programs
15
attributed to the increased number of high-speed collisions that occur in games (Dick, et al., 2007).
During games, the concussion rate is 2.34 to 3.81 per 1000 athlete-exposures (Dick, et al., 2007; Guskiewicz, et al., 2003). Studies differ on incidence of concussions when broken up between positions. Quarterbacks have a high incidence of concussions (0.83 per 1000 athlete-exposures) (Dick, et al., 2007; Guskiewicz, et al., 2003). A 16-year collegiate study, from 1988-2004, indicated quarterbacks had the highest incidence of concussion in football (Dick, et al., 2007). However, a different collegiate study from 1999-2001, indicated that linebackers (0.99 per 1000 athlete-exposures), offensive line (0.95 per 1000 athlete-exposures) and defensive backs (0.88 per 1000 athlete-exposures) had a higher rate of concussions (Guskiewicz, et al., 2003). Running backs and wide receivers have lower rates of concussions (0.71 per 1000 athlete-exposures and 0.54 per1000 athlete-exposures, respectively) (Dick, et al., 2007). A more recent collegiate study showed special teams with a concussion rate in the middle of these ranges (0.77 per 1000 athlete-exposures) (Guskiewicz, et al., 2003), comparing offensive and defensive player positions to special teams as whole.
16
strength of high school athletes leading to a decreased ability to control the head at impact.
Professional Programs
Professional football and risk for concussions is different than college and high school, likely due to the higher speed of play, the higher impact forces, and a player’s concussion history (Dick, et al., 2007; Guskiewicz, et al., 2003). Research has shown that, in professional football, kickoffs have the highest rate of concussions (9.29
concussions per 1000 plays) (Pellman, et al., 2004; Viano, et al., 2007). Punts have the second highest rate of concussions in the professional football (3.86 concussions per 1000 plays) (Pellman, et al., 2004; Viano, et al., 2007). Special teams plays had a greater rate of concussion than traditional rushing and passing plays (2.24 concussions per 1000 plays and 2.14 concussions per 1000 plays, respectively) (Pellman, et al., 2004; Viano, et al., 2007).
17
respectively) (Pellman, et al., 2004). Offensive line, defensive line, linebackers, and return ball carriers showed moderate risk for concussion (0.58 concussions per 100 game-positions). Punters, return units, kickers and holders showed to be at a low risk for concussions (Pellman, et al., 2004). The offensive and defensive backs were three times more at risk of concussions compared to offensive and defensive linemen (Pellman, et al., 2004).
Pathology
A concussion is an injury to the brain and should be taken very seriously.
Concussions have been shown to have an impact on the quality of life of college athletes (Kuehl, et al., 2010). The effect on social life, perception of pain and headache is greater for those who have experienced more than three concussions (Kuehl, et al., 2010). Through research of retired professional football players, an association has been found between the number of concussions and the perception that concussions have a negative impact on an athlete’s life (Guskiewicz, Marshall, et al., 2007). Amongst these players who suffered increased numbers of concussions, there was a higher frequency of
diagnosis for clinical depression when compared to retirees who reported no concussion history (Guskiewicz, Marshall, et al., 2007).
How the brain reacts to impact on the side of the head has been studied in laboratory rats. Bleeding will occur at the site of impact based upon the magnitude of force used to cause the impact, with greater impact causing more bleeding (Hamberger, et al., 2009). These impacts were adjusted for body weight and measured with an
6-18
22% of the impacts with increasing prevalence as the force of the projectile was increased (Hamberger, et al., 2009). Hemorrhaging was not found outside the point of impact (Hamberger, et al., 2009). Diffuse axonal injury was indicated after repeated impacts with the highest velocity projectile (Hamberger, et al., 2009). However, the impacts that led to diffuse axonal injury were greater than what has been shown to lead to concussions in the National Football League (Hamberger, et al., 2009).
Research has found that, at times, cognitive deficits can be found in the brain one month after a mild head injury. When an individual has continued complaints of post-concussive symptoms, functional magnetic resonance imaging (fMRI) shows a deficit in brain functioning during working memory tasks and selective attention tasks: such as the Stroop task and the n-back task (Smits, et al., 2009). The severity of post-concussive symptoms can also play a role on brain function, as shown using an fMRI. Patients who have more severe symptoms tend to show an even greater decrease in fMRI functioning when compared to patients who have more mild symptoms (Smits, et al., 2009).
19
those targeted at identifying (verbal/visual/reaction time/etc) deficits yielded no significant differences between the two groups (Pontifex, et al., 2009).
Mechanism of Injury
The cause of concussions is a complex and addressing this question requires a multifaceted approach. In the past ten years, researchers have begun measuring the force of impacts that occur in football. Concussive and non-concussive impacts are being studied. One approach to the problem involves measuring impacts that occur in football and how they differ across different program levels and situations. In high school and college football programs, this data is being collected using in-helmet accelerometers that record data in real time (Broglio, et al., 2009; Duma, et al., 2005; Greenwald, et al., 2008; Guskiewicz, Mihalik, et al., 2007; McCaffrey, et al., 2007; Mihalik, et al., 2007). In professional football, researchers are reconstructing impacts that occur on the field using crash test dummies (Pellman, et al., 2003; Viano, et al., 2007; Viano & Pellman, 2005; Viano, et al., 2006). The accelerometer data yields a greater number of impacts, particularly greater non-concussive impacts than video reconstruction.
High School Programs
20
number of impacts per session than the offensive line (Broglio, et al., 2009). Offensive and defensive lines experienced lower magnitude impacts, but at the same time they experienced the greatest number of impacts (Broglio, et al., 2009). Linemen are likely to have an impact during every play; however, they may not have the same momentum going into an impact that skill players would possess.
Another important observation to make is that players who experience
concussions are more likely to experience another one in the future (Guskiewicz, et al., 2003). Three previous concussions increases the risk for a concussion by three times (Guskiewicz, et al., 2003). Defensive line and offensive skill positions sustained similar magnitude linear accelerations (Broglio, et al., 2009). Only defensive line athletes had significantly greater linear accelerations than both defensive skill and offensive line players (Broglio, et al., 2009). Offensive and defensive line athletes had greater
rotational accelerations than offensive and defensive skill (Broglio, et al., 2009). Greatest rotational acceleration resulted from impacts to the front of the head while impacts to the back, side, and top of the head had the least rotational acceleration (Broglio, et al., 2009). Impacts to the front of the head are more likely to occur to linemen due to the nature of the position.
College Programs
21
al., 2007; Mihalik, et al., 2007). In addition, no differences were found between helmets only and full-contact practices (Guskiewicz, Mihalik, et al., 2007; McCaffrey, et al., 2007; Mihalik, et al., 2007). However, as previously stated, the risk for concussions is greater in games than in practices (Guskiewicz, et al., 2003).
Offensive line athletes had greater acceleration impacts than both defensive line players and defensive backs (Mihalik, et al., 2007). Offensive backs and linebackers had higher magnitude impacts than defensive line players and defensive backs (Mihalik, et al., 2007). Also, defensive line players and wide receivers had higher magnitude impacts than defensive backs (Mihalik, et al., 2007). Concussions have been found to occur from a wide range of impacts, 55 g up to over 100 g of linear acceleration (Brolinson, et al., 2006). At a 75% correct prediction rate, the thresholds for concussion are at 96 g for linear acceleration (1.6% false prediction rate) and 7235 rad/s2 for rotational acceleration (2.5% false prediction rate) (Greenwald, et al., 2008).
Professional Programs
The use of video reconstruction in studies of professional football players has allowed researchers to detail the difference between striking players and the players being struck. Struck players have higher head accelerations (67.9 + 14.5 g) than striking
players (56.1 + 22.1 g) (Viano & Pellman, 2005). The majority of the time, the player being struck sustains the concussion, not the striking player (Pellman, et al., 2004; Viano, et al., 2007; Viano & Pellman, 2005). When measuring concussions, the highest
22
more of the injuries (31.9%) than the player being tackled (28.6%) (Pellman, et al., 2004).
Concussions are more likely to occur as rotational acceleration and linear acceleration increases. An impact has been shown to lead to a concussion 80% of the time when linear acceleration exceeds 106 g or rotational acceleration exceeds 7.9x10³ rad/s2 (Zhang, et al., 2004). Concussions have been shown to occur from impacts that are less than 66g in linear acceleration or 4.6x10³ rad/s2 in rotational acceleration, although the risk is lower (25%) (Zhang, et al., 2004).
Helmets are designed to decrease the likelihood of injury, particularly skull fractures. Recently, helmets are increasingly designed to increase protection from concussion with new designs in soft, energy absorbing padding that comes down farther around the ears, side and back of the head (Viano, et al., 2006). Newer helmets may reduce the risk of concussion by 10-20% (M. Collins, Lovell, Iverson, Ide, & Maroon, 2006; Viano, et al., 2006).
Risk Prediction
23 High School Programs
In the high school, mean linear acceleration of impacts are similar in practices (23.26g) and games (24.76g) (Broglio, et al., 2009). Linear acceleration was the greatest predictor of concussion, with the lowest false response rate of 1.6%, for a correct
prediction above 70% (Greenwald, et al., 2008). For correct prediction less than 70%, rotational acceleration had the lowest false response rate (Greenwald, et al., 2008). Head Impact Technology severity profile (HITsp), is an index designed to predict impacts that could result in a concussion accounting for greater than 99.99% variability, taking into consideration linear acceleration, rotational acceleration and location of impact
(Greenwald, et al., 2008).
College Programs
24
allow for the impacts to be put into perspective of other severe head injuries (Lockett, 1985).
Typical non-concussive impacts occur between 21 g and 23 g (Mihalik, et al., 2007). This is much lower than suggest injury thresholds of 75-80 g. Offensive backs are more likely to sustain impacts greater than 80g (Mihalik, et al., 2007). At the same time this position does not have the highest concussion rate (Dick, et al., 2007;
Guskiewicz, et al., 2003). While helmets only practice might be to reduce the risk of injury, they do not decrease risk for concussions (Mihalik, et al., 2007).
Professional Programs
Research on professional football utilizes video analysis and reconstruction of concussive impacts. The reconstructed models showed peak head acceleration at 98 ± 28 g for concussed players’ impact (Pellman, et al., 2003). The change in velocity for a concussive impact (7.2 ± 1.8 m/s) was greater than non-concussive impacts (5.0 ± 1.1 m/s) (Pellman, et al., 2003). Struck players with concussions reconstructions showed 9.3 ± 1.9 m/s average impact velocity (Viano, et al., 2007). Players who were struck and sustained a concussion had greater peak head acceleration (94 ± 28 g) than non-concussed struck players (67.9 ± 14.5 g) (Viano, et al., 2007).
25
brace and prepare for the hit (Viano & Pellman, 2005). Players who are struck and do not sustain a concussion have significantly lower head accelerations than struck players who sustain a concussion (Viano & Pellman, 2005). Offensive and defensive linemen are at a lesser risk for concussions than quarterbacks, wide receivers, defensive backs, and special team players (Pellman, et al., 2004).
Methodological Considerations
The Head Impact Technology (HIT) System has been used for many years at varying institutions (Broglio, et al., 2009; Duma, et al., 2005; Greenwald, et al., 2008; Guskiewicz, Mihalik, et al., 2007; McCaffrey, et al., 2007; McCrea, et al., 2003; Mihalik, et al., 2007). This system uses six single-axis accelerometers to collect information on linear acceleration, rotational acceleration and impact location on the helmet. Previous research has shown that the HIT System reliably measures head motion and not helmet motion (DiMasi, 1995; Manoogian, McNeely, Duma, Brolinson, & Greenwald, 2006). Data on multiple players can be collected at real time with the HIT System. This allows for collection of thousands of impacts across the season. Also, the real time component involved with the HIT System allows for identification of impacts that resulted in athlete concussions during a session. Previous research has worked to identify a threshold of impact severity that is likely to lead to a concussion. We used previously reported values by Zhang et al. to classify impacts as mild, moderate, or severe based on linear and rotational acceleration (Zhang, et al., 2004).
26
they occur. This can be achieved by using a single camera and synchronizing the time and date of the camera with the HIT System Sideline Response System before each session (Mihalik, et al., 2009). The researcher was able to match the impact data to the type of collision.
For this study, we used the HIT System and video footage captured by video personnel. The HIT System allowed for real time data collection and for a larger number of impacts to be recorded and analyzed. Incorporating video footage has been used extensively in professional football research, but this only allows for a minimal number of impacts to be included. Video footage synchronized with the HIT System allows for a greater number of impacts to be analyzed. For this study, the video crew captured
competitions with two cameras, allowing for multiple views. This system organizes the video footage by the game clock and not time of day.
Summary
Athletes are susceptible to concussions at every age and in every sport. Football’s high magnitude of contact leads to a higher incidence of concussions than any other sport (Dick, et al., 2007; Gessel, et al., 2007; Hootman, et al., 2007). Concussions are
27
changes in the 1970’s drastically decreased the incidence of cervical spine injuries (Heck, Clarke, Peterson, Torg, & Weis, 2004). Continued implementation of such rules and proper teaching, of not leading with the helmet or dropping the helmet right before impact, is important in order to keep the incidence of concussions low (Heck, et al., 2004).
There is no agreement on the positions of greatest risk for concussion. In the majority of studies, special teams have been left out. All positions are at risk for concussion. While some positions have been shown to be at greater risk, offense and defense have rarely been compared to special teams. Previous research has combined all impacts sustained by one position together and has not delineated between long closing distance collisions and those near the line. These are two gaps in the current research.
Previous research has shown that there are discrepancies between positions and types of plays on the football field (Broglio, et al., 2009; Mihalik, et al., 2007; Pellman, et al., 2004). These trends show that impacts resulting in concussions tend to occur in players who have the ability to gain speed before impact or if the person who hits them is able to gain speed before impact (Broglio, et al., 2009; Guskiewicz, et al., 2003; Viano, et al., 2007; Viano & Pellman, 2005). Skill players are more likely to sustain impacts exceeding 98 g (1 out of every 70 impacts) compared to linemen (1 out of every 125 impacts) (Schnebel, et al., 2007).
28
can. Anecdotally, athletic trainers report a high incidence of injuries during special teams plays in competitions and in the open field. Long closing distance collisions have never been separated out and analyzed. Research has not looked specifically at special team impacts to discern if the impacts sustained on special teams are more severe than impacts sustained on offense of defense.
CHAPTER III METHODOLOGY Participants and Study Design
This study employed a prospective repeated measures design evaluating head impact biomechanics during different play types and collision closing distance. A convenience sample of 46 Division I college football players at the University of North Carolina at Chapel Hill were participating in a larger ongoing prospective study assessing the relationship between head impact biomechanics, clinical measures of concussion, and neuroradiology. Data was collected during six home and six away competitions.
Inclusion criterion included the athlete choosing to wear a Riddell helmet and
participation in games during the 2010 season. The participants were told the purpose of the study and the methods of the study. Informed consent was obtained from each participant. Subject recruitment did not begin until IRB approval had been obtained. Participants were excluded if they were unable to participate in at least one competition during the 2010 season.
Instrumentation
Head Impact Telemetry System
30
are installed in individual player helmets, the RedZone Software, and the Riddell Sideline Response System. The MxEncoders consist of six single-axis accelerometers, a battery pack, and an on-board data collection device. This was designed to collect head impact data and transmit it in real-time to the sideline response system. The accelerometers have a spring system that allowed the accelerometers to stay in contact with the head. The sensors were placed in the VSR4, Speed, and Revolution versions of Riddell helmets (Riddell Corporation, Elyria, OH).
The MxEncoders relayed impact data to a sideline response system at a frequency of 903-927 MHz, which was then transferred and stored on a laptop. Each impact was linked to a player using a unique identifier assigned to the MxEncoder. The MxEncoders were able to store up to 100 additional impacts if the player was out of the system’s 150-yard range. Those impacts were downloaded once the player was within range of the system.
Miscellaneous Equipment
31
necessary for time-synchronizing the game clock and time of day because not all special team plays require time to runoff the clock. In addition, a standard digital video camera time synced to the sideline controller (Model: PV-GS35; Panasonic Corporation of North America; Secaucus, NJ) was used to record the game clock during the competition onto 60-minute miniDV tapes (Model: M-DV60ME; JVC Americas Corp.; Wayne, NJ). The video camera was capable of recording video footage at 120 Hz.
Data Collection
At the start of the season each player was fitted with an MxEncoder-equipped Riddell helmet. A professional equipment manager fit the helmets. Data was collected during 12 games over the course of the 2010 NCAA football season. At each game the sideline system was setup to record impacts from the players enrolled in the study.
Synchronization of Time of Day and Game Clock
The principal investigator synchronized her watch and the standard video camera with the laptop of the HIT System. A research assistant used the standard video camera to record the game clock during the competition. During the game the principal
investigator worked on the field to record the time of day and game clock time for each special team play. Video footage of the game clock, which was recorded by the research assistant, had a time stamp allowing us to assign the correct time of day to the play on the field.
32
each half, the video footage was imported into the database where the video personnel combined both views of each play and organized them by game clock, allowing them to be accessed at a later date. Following each game the principal investigator reviewed the video footage, which was linked with impacts collected with HIT System.
Evaluation of Video Footage
Video analyses were conducted to link impact biomechanical data with game footage. Using the play-by-play summary produced after every game, each play was assigned a game clock time based on the video footage captured by the video personnel. This information was then linked to the time of day based on the standard video footage that was captured by the research assistant. Impacts were evaluated using the ‘Player to Player Collision Type Evaluation Form’ (Appendix A). This form was used as a video evaluation sheet to record play type, closing distance, and additional variables that were not evaluated in this study. During impact observations, the researcher was blinded to the biomechanical data. We selected a subset of our cases (n=75) and re-evaluated these collisions no less than 30 days following the initial evaluation. We report strong intrarater agreement for closing distance (Kappa = 0.88).
33
at least one collision was evaluated to an equal number of offensive and defensive plays through random sampling with replacement and stratified by quarter. In the event randomly selected offensive of defensive play had no observable collisions, we
proceeded to randomly sample another play. Random sampling was accomplished using a random integer sequence generator (source: www.random.org/sequences). There were no statistical differences in the sample between the first four games to the last eight games across play type for linear acceleration (F2,5 = 0.84; P = 0.484), rotational acceleration (F2,5 = 1.35; P = 0.339), or HITsp (F2,5 = 2.09; P = 0.219).
We classified the collision type as either long closing distance or short closing distance. Impacts were classified as “long closing distance collisions” when the striking player and struck player had traveled a combined distance of at least ten yards prior to the collision. Impacts were classified as “short closing distance collisions” when the striking player and the struck player had traveled a combined distance less than ten yards prior to the collision. Impacts occurring on special teams were classified based on the type of special team play: kick off, kickoff return, punt, and punt return. Field goal, field goal block, extra point attempt and extra point attempt block were considered low-risk miscellaneous special teams and excluded from the analyses because few impacts were classified as long closing distance.
Data Reduction
34
impacts (Guskiewicz, Mihalik, et al., 2007; McCaffrey, et al., 2007; Mihalik, et al., 2007). We performed natural logarithmic transformations on these data to render them normally distributed for the purpose of our statistical analyses since many of the impacts occurred in the lower range.
Linear acceleration (g), rotational acceleration (rad/s2), and HITsp were the outcome measures of interest obtained from the HIT System. The HITsp is a component score including Gadd Severity Index, Head Injury Criterion, linear acceleration,
rotational acceleration, and a weighting factor by location of impact on the head (Greenwald, et al., 2008). The Riddell Sideline Response System computes HITsp directly. Impact severity was categorized as mild, moderate, and severe.
Data Analysis
35 Table 3.1: Statistical Analyses
Question Description Data Source Comparison Method
1 Do football
players experience significant
differences in biomechanical measures of head impact severity across play type and closing distance?
Biomechanical measures of head impact severity collected with the HIT System during
competitions of the 2010 football season. Linear acceleration Rotational acceleration HITsp Biomechanical measures of head impact severity during special team plays, offensive plays and defensive plays. Long closing distance to short closing distance on biomechanical measures of impact severity. Three Random intercepts general linear mixed models
2 Is there a
significant association
between play type or closing distance and categorized head impact severity?
Biomechanical measures of head impact severity collected with the HIT System during
competitions of the 2010 football season. -Frequencies of Linear acceleration -Frequencies of Rotational acceleration Biomechanical measures of head impact severity during special team plays, offensive plays and defensive plays. Long closing distance to short closing distance on biomechanical measures of impact severity.
36
Table 3.2: Categorized Head Impact Severity Values (Zhang, et al., 2004)
Dependent Variables
Categorized Head Impact Severity
Mild Moderate Severe
CHAPTER IV RESULTS
The purpose of this study was to determine how head impact biomechanics differ across play type and closing distance during collegiate football competitions. Head impact biomechanical data were collected across 12 games during the 2010 NCAA football season (n = 7992). A total of 2250 impacts were observed for play type and closing distance. Impacts that occurred on special teams (n = 582) were compared to a random sampling of impacts that occurred on offense (n = 889) and defense (n = 779). Each impact was classified as either short closing distance (n = 1472) and long closing distance (n = 774). Provided below are all of the omnibus statistical findings in addition to individual means and 95% confidence intervals. Statistical findings are presented in Table 4.1.
Research Question One
Effects of Play Type and Closing Distance on Linear Acceleration
38
are depicted in Figure 4.1. In exploring the main effect of play type, we did not observe any differences (F2, 31 = 1.00; P = 0.381) between defensive plays (23.9 g; 95% CI: 22.7-25.2), offensive plays (25.2 g; 95% CI: 23.8-26.6), or special team plays (25.2 g; 95% CI: 23.8-26.6). However, a significant difference in linear acceleration was observed
between long closing distance and short closing distance (F1, 37 = 11.90; P = 0.001) such that impacts following short closing distances (23.4 g; 95% CI: 22.7-24.2) resulted in lower linear accelerations than those collisions following long closing distances (26.2 g; 95% CI: 24.8-27.5).
Effects of Play Type and Closing Distance on Rotational Acceleration
39
was significantly greater than that recorded during short closing distances (1355.2 rad/s2; 95% CI: 1301.7-1410.9) in our sample (F1, 37 =13.65; P < 0.001).
Effects of Play Type and Closing Distance on Head Impact Technology severity profile (HITsp)
We observed a significant interaction effect between play type and closing distance on measures of HITsp during competitions (F2,9 = 4.75; P = 0.039). Point estimates and 95% confidence intervals are depicted in Figure 4.3. Employing Tukey-Kramer post hoc analyses, impacts on special team plays over long closing distances (17.0; 95% CI: 16.0-18.2) were significantly more severe (t9 = -4.07; P = 0.024) than impacts occurring during defensive plays over short distances (14.5; 95% CI: 13.6-15.4), when measured by HITsp. Further, impacts occurring on special teams plays occurring over long closing distances were significantly greater (t9 = 4.42; P = 0.015) than special team collisions occurring over short closing distances (13.7; 95% CI: 12.3-15.2).
40 Research Question Two
Association between Play Type and Head Impact Severity (Linear Acceleration)
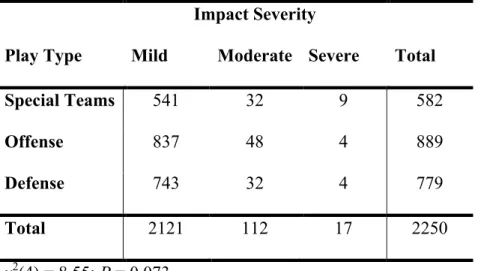
An association between play type and categorized head impact severity for linear acceleration was not observed (!2(4) = 8.55; P = 0.073) (Table 4.2). Given this trend, however, football players in our sample were 3.44 times more likely to sustain a severe impact during a special teams play than an offensive play and 3.04 times more likely than a defensive play. The risk of sustaining a mild or moderate impact during special team plays compared to offensive and defensive plays were approximately the same.
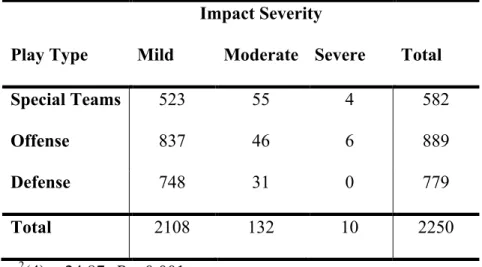
Association between Play Type and Head Impact Severity (Rotational Acceleration) An association between play type and categorized head impact severity for rotational acceleration was observed (!2(4) = 24.87; P < 0.001) (Table 4.3). Football players in our sample were at approximately the same risk (RR = 1.03) for sustaining a severe impact on special team plays compared to offensive plays. No severe rotational acceleration impacts were observed during the randomly selected defensive plays. However, special team players were at a 1.83 times greater risk of sustaining a moderate impact than offensive players and a 2.37 times greater risk than defensive players of the same.
41
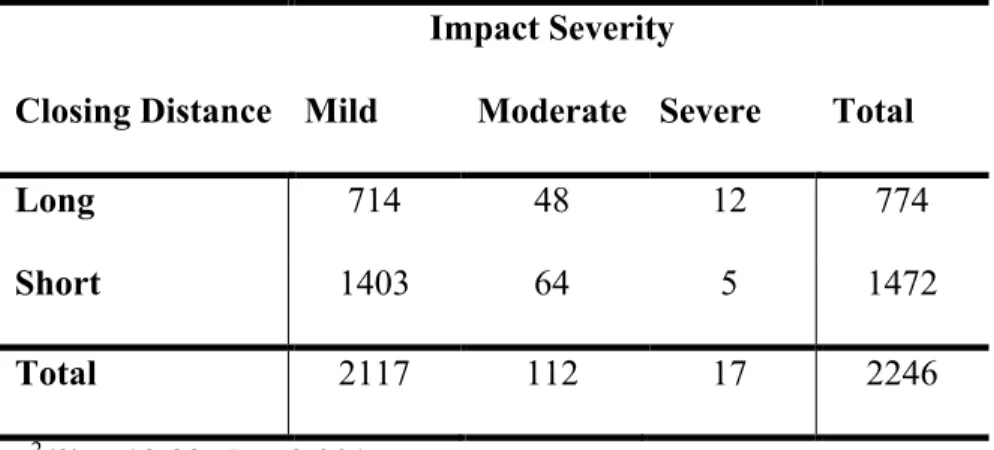
a moderate impact following a long closing distance was 1.43 times more likely than on short closing distance impact. The Football players were 4.56 times more likely to sustain a severe impact during a long closing distance impact than a short closing distance impact.
Association between Closing Distance and Head Impact Severity (Rotational Acceleration)
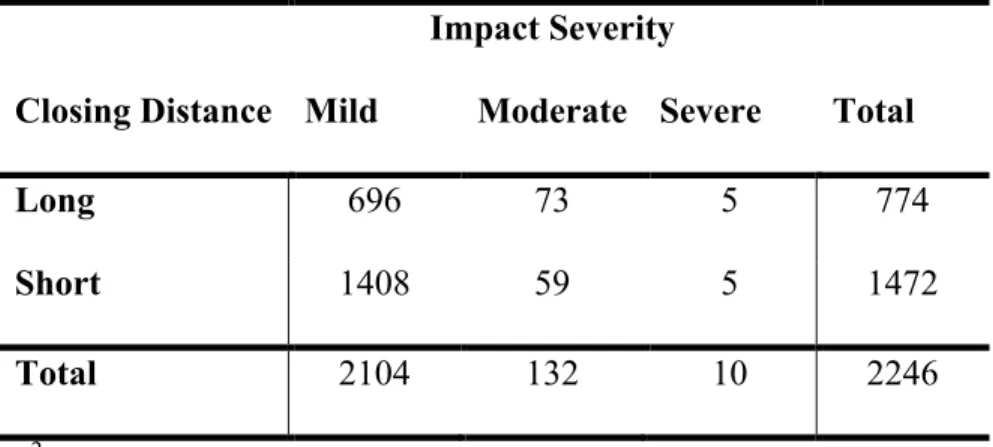
A significant association was observed between closing distance and categorized head impact severity for rotational acceleration was observed (!2(2) = 28.23; P < 0.001) (Table 4.5). Football players in our sample were 2.35 times more likely to sustain a moderate impact following a long closing distance impact than a short closing distance and 1.91 times more likely of sustaining a severe impact. The risk of sustaining a mild impact was approximately the same at 1.06 for short closing distance impact compared to long closing distance.
Exploratory Analyses
42
defensive special teams (28.27g; 95% CI: 25.19-31.71) overlaps just slightly with short closing distance collision on defensive special teams (22.52g; 95% CI: 18.99-26.71).
Similarly to linear acceleration, we did not observe a statistically significant difference in rotational acceleration between special team play type and closing distance (F1,6 = 1.95; P = 0.212). Defensive special teams 95% confidence intervals showed minimal overlap between long closing distance (1680.3 rad/s2; 95% CI: 1462.9-1930.0) and short closing distance (1210.1 rad/s2; 95% CI: 992.9-1474.6).
Head Impact Technology severity profile (HITsp) yielded the same result as previous described with rotational acceleration and linear acceleration. We did not observe a statistically significant difference in HITsp between special team play type and closing distance (F1,6 = 4.65; P = 0.075). Also, the trend continues with defensive special team collisions over long closing distances (18.2; 95% CI: 16.5-20.1) showing separation of the 95% confidence interval from defensive special teams collisions over short closing distances (13.5; 95% CI: 11.8-15.3). Again the difference may exist if our sample size of special team impacts was larger.
Table 4.1
: Frequency (percentage) o
f recorded impacts, mean resultant linear
acceleration, rotational acceleration, and HITsp of
head impacts sustained by play type and closing distance. The associated 95% confidence intervals and
P
values are provided.
Frequency
(%)
Linear Acceleration (
g) Rotational Acceleration (rad/s 2 ) HITsp Mean 95 % CI P 1 Mean 95 % CI P 1 Mean 95 % CI P 1 L ow er U pper L ow er U pper L ow er U pper
Play Type
Global Tes t 2 0.381 Global Test 2 0.811 Global Test 2 0.077
Special Teams
3 582 (25.87) 25.2 23.8 26.6 (Ref) 1442.4 1330.5 1563.8 (Ref) 16.1 15.3 17.0 (Ref) Offense 889 (39.51) 25.2 23.8 26.6 0.271 1442.4 1329.1 1565.4 0.620 16.1 15.2 17.0 0.107 Defense 779 (34.62) 23.9 22.7 25.2 0.188 1392.6 1307.2 1483.5 0.524 14. 6 14.0 15.5 0. 025
Closing Distance Short
3
1472 (65.54)
23.4 22.7 24.2 (Ref) 1355.2 1301.7 1410.9 (Ref) 14.6 14.1 15.1 (Ref) Long 774 (34.46) 26.2 24.8 27.5 0.001 1519.3 1441.6 1601.1 0.001 16.4 15.7 17.2 0.001 Total 2250 4 24.8 23.6 26.0 - 1430.4 1342.0 1515.9 - 15.6 14.9 16.4 -
1 P
values are relative to the reference category used by the random intercept
s general mixed linear model analyses
2 Global Test
refers to the omnibus model evaluating
the null hypothesis of no differences between any categories for this variable
3 Denotes the reference
(Ref)
category
4 Closing distance has four fewer impacts due t
o
inability to identify
closing distance for those cases
44
Table 4.2: Frequency of Categorized Impacts Resulting in Mild, Moderate and Severe Linear Acceleration According to Play Type
Impact Severity
Play Type Mild Moderate Severe Total
Special Teams 541 32 9 582
Offense 837 48 4 889
Defense 743 32 4 779
Total 2121 112 17 2250
45
Table 4.3: Frequency of Categorized Impacts Resulting in Mild, Moderate and Severe Rotational Acceleration According to Play Type
Impact Severity
Play Type Mild Moderate Severe Total
Special Teams 523 55 4 582
Offense 837 46 6 889
Defense 748 31 0 779
Total 2108 132 10 2250
46
Table 4.4: Frequency of Categorized Impacts Resulting in Mild, Moderate and Severe Linear Acceleration According to Closing Distance
Impact Severity
Closing Distance Mild Moderate Severe Total
Long 714 48 12 774
Short 1403 64 5 1472
Total 2117 112 17 2246
47
Table 4.5: Frequency of Categorized Impacts Resulting in Mild, Moderate and Severe Rotational Acceleration According to Closing Distance
Impact Severity
Closing Distance Mild Moderate Severe Total
Long 696 73 5 774
Short 1408 59 5 1472
Total 2104 132 10 2246
Figure 4.1: Head Impact Linear Acceleration Means and 95% Confidence Intervals for Play
Figure 4.2: Head Impact Rotational Acceleration Means and 95% Confidence Intervals for Play
Figure 4.3: Head Impact Technology severity profile (HITsp) Means and 95% Confidence Intervals for Play Type and Closing Distance
‡ Indicates statistically significant difference between Short Closing Distance impacts on
Special Teams and Long Closing Distance impacts on Special Teams.
† Indicates statistically significant difference between Short Closing Distance impacts on
CHAPTER V
DISCUSSION
The primary finding demonstrated that during a collegiate football game long
closing distance impacts sustained during special team plays were the most severe.
Another key finding was that regardless of play type, long closing distance impacts are
more severe than short closing distance impacts. Previous research has analyzed
collisions among football players at the high school (Broglio, et al., 2010; Broglio, et al.,
2009; Gessel, et al., 2007; Greenwald, et al., 2008; Schnebel, et al., 2007), college
(Brolinson, et al., 2006; M. W. Collins, et al., 1999; Duma, et al., 2005; Greenwald, et al.,
2008; Guskiewicz, Mihalik, et al., 2007; Kuehl, et al., 2010; McCaffrey, et al., 2007;
McCrea, et al., 2003; Mihalik, et al., 2007), and professional levels (Guskiewicz,
Marshall, et al., 2007; Hamberger, et al., 2009; Pellman, et al., 2004; Pellman, et al.,
2003; Viano, et al., 2007; Viano & Pellman, 2005; Viano, et al., 2006; Zhang, et al.,
2004), but had not isolated special teams from offensive and defensive plays when
assessing the biomechanical risk factors of concussion. The purpose of this study was to
determine if special team players experience more severe head impacts than offensive
and defensive players during competitions. A secondary purpose was to determine if
collisions occurring after a long closing distance are more severe than those occurring
52
Our hypothesis was that players on special teams would experience more severe
biomechanical measures of head impact severity during long closing distance collisions
than players participating on offensive and defensive plays during short closing distance
collisions. In our sample, long closing distance collisions on special teams were the most
severe, while special teams and defensive collisions that occurred following a short
closing distance were the least severe impacts as measured by Head Impact Technology
severity profile (HITsp). Previous studies suggest that professional football players are at
a greatest risk of concussion during special team plays (Pellman, et al., 2004; Viano, et
al., 2007). Respectively, kickoffs and punts had the highest and second highest
concussion risk (Pellman, et al., 2004; Viano, et al., 2007). Although this thesis did not
analyze the risk of concussion, our results suggest that impacts occurring during special
teams are more severe than those occurring during offensive and defensive plays.
Long closing distance collisions were more severe than short closing distance
collisions as measured by linear acceleration, rotational acceleration, and HITsp. This
parallels research suggesting a greater number of injuries occur with tackling, which is
more likely to occur following a long closing distance than we would expect with
blocking (Pellman, et al., 2004). Further analysis of location of head impact showed that
impacts on defense and offense over short closing distances accounted for the majority of
top of the head impacts. These findings are most likely related to linemen at the line of
scrimmage who drop their head in an effort to gain ground, or because a three-point
stance places them in this potentially vulnerable position. When an athlete sustains an
impact to the top of the head, an axial load to the cervical spine is more likely and may
53
At the professional level, research has indicated that linemen are less likely to
sustain concussions than quarterbacks, wide receivers, defensive backs, and special team
players (Pellman, et al., 2004). Further, collegiate linemen experience severe impacts
less frequently than skill players (Schnebel, et al., 2007). Our results coincide,
illustrating that long closing distance collisions tend to be more severe. It can be
speculated, therefore, that athletes who sustain short closing distance collisions may be
less likely to sustain a concussion.
Collisions occurring on special teams and offense, although not significantly
different, were more severe than those occurring on defense for linear and rotational
acceleration. Significant differences between play types were observed for measures of
HITsp, supporting that impacts sustained on special team plays are more severe than
impacts sustained on defense. One reason that HITsp may differ from linear acceleration
and rotational acceleration is because it accounts for head location of impact. These
results correspond with previous research at the collegiate level showing that offensive
backs sustained the greatest magnitude impacts (Mihalik, et al., 2007). These differences
may explain why previous studies have observed that offensive players—including any
special team plays they may have participated in—are at greater risk for concussion
(Dick, et al., 2007).
Our results suggest that there may be differences in head impact severity
characteristics between collegiate and high school football players. Previous studies have
observed that high school defensive linemen had the largest linear acceleration among
position groups. We speculate that high school football players may not yet possess the
54
may be at greater risk of severe impacts (Broglio, et al., 2009). There is also a greater
likelihood that high school football players participate in both offensive and defensive
(i.e. two-way player) and the results reported by Broglio et al. may not distinguish
between these two play types. While the Broglio et al. study and ours appear to disagree
on which player type sustains higher magnitude impacts, both studies agree that
top-of-helmet collisions are the most severe (Broglio, et al., 2009; Mihalik, et al., 2007). All
positions are at risk for concussion; however, there is currently no true consensus on what
positions are at the greatest risk of concussion. Our study does indicate, that when head
impact location is taken in to account with HITsp, players are at greater risk of severe
impacts during special team plays than defensive plays (Broglio, et al., 2009; Dick, et al.,
2007; Guskiewicz, et al., 2003; Mihalik, et al., 2007; Schnebel, et al., 2007; Viano, et al.,
2007; Viano & Pellman, 2005).
Clinical Implications
This study is the first to isolate special team collisions from offensive and
defensive collisions in college football. It is also the first to differentiate between long
and short closing distance collisions. Our results show that the most dangerous collisions
are those following long closing distances. Organizations that oversee football like the
National Football League (Pellman, et al., 2004; Pellman & Viano, 2006; Pellman, et al.,
2003; Viano, et al., 2007; Viano & Pellman, 2005; Viano, et al., 2006), Canadian
Football League (Delaney, Lacroix, Leclerc, & Johnston, 2000), and National Collegiate
Athletic Association are assessing the need for rule changes to protect football players.
55
One recommendation the National Football League is considering is altering kickoff
locations and rules (K. Guskiewicz, personal communication, February 18, 2011). Rule
changes to make the game safer are not new.
In 1975, helmets were introduced and standardized by the National Operating
Committee on Standards for Athletic Equipment resulting in a decrease in skull fractures
(Levy, Ozgur, Berry, Aryan, & Apuzzo, 2004). This originally led to an increase in
spinal injuries as players used their helmeted head as a weapon to impart increasing
collision forces on opposing players. The National Collegiate Athletic Association in
conjunction with National Alliance Football Rules Committee altered the rules to
eliminate the use of the crown of the helmet as a striking point, which subsequently
reduced the incidence of cervical spine injuries in football (Levy, et al., 2004). Recently,
rules have been changed in an effort to decrease the risk of concussion. For example,
teams are no longer permitted to have more than two players form a single wedge on
kickoff plays. There is an effort to decrease the risk of severe impacts and likelihood of
injury and, thus, improve injury prevention in American football.
We found that there are a greater number of severe collisions (linear ! 106g;
rotational ! 7900 rad/s2) following long closing distances than those following short
closing distances. Additionally, special teams had a greater risk of severe collisions
compared to offensive and defensive plays. Altering plays that often result in long
closing distances may be the most effective way of reducing the number of severe head
impacts. We speculate that by altering punts and kickoffs, we could plausibly decrease
the acceleration potential of players during these special team plays. In youth leagues,
56
research has not assessed if this does reduce the risk of injury. One suggestion to
decrease injuries in football is to eliminate the punt game, as in some youth football
leagues. Holding teams from punting on fourth down would change a special team play
into a more traditional offense and defense play. This rule change would eliminate those
high risk impacts and one positive to the game would be that more scoring could happen
with the better field position. However, if kickoffs are still a part of the game, more
scoring would lead to more kickoffs and more impacts that the rule change would be
trying to prevent.
We acknowledge that protecting the football athlete may present a dilemma for
those most concerned with preserving the game. In order to protect football players from
the long closing distance collisions that occur on kickoffs, the most drastic option is to
eliminate them. Kickoffs would not be a risk if every team started on the 20-yard line,
similar to a touchback, except without the option of a return. However, this eliminates
the onside kick altogether. The onside kick is a rare, but significant, option in close
games as the remaining game time is running out. A less dramatic change would be to
change the field location from where a team kicks off. By advancing the kickoff team ten
yards, the players would cover a shorter distance. Although these closing distances
would still be considered long as we have operationally defined them in this study, it
would increase the likelihood of touchbacks by the receiving team and, thus, decrease the
frequency of collisions during special team plays. An additional option would be to
eliminate the ten-yard run-up to the line of scrimmage prior to kickoff. This would