DEVELOPMENT OF AN AUTOMATED MICROFLUIDIC DEVICE
FOR HIGH-THROUGHPUT SINGLE CELL KINASE ANALYSIS
Amy Diane Hargis
A dissertation submitted to the faculty of the University of North Carolina at Chapel Hill in partial fulfillment of the requirements for the degree of Doctor of Philosophy in the Department of Chemistry
Chapel Hill 2010
Approved by:
Professor J. Michael Ramsey (Advisor) Professor N.L. Allbritton (Chair) Professor Gary Glish
ABSTRACT Amy D. Hargis
DEVELOPMENT OF AN AUTOMATED MICROFLUIDIC DEVICE FOR HIGH-THROUGHPUT SINGLE CELL KINASE ANALYSIS
(Under the direction of J. Michael Ramsey)
In this work, development of a microfluidic device to perform high-throughput single cell analysis is described. The objective is to be able to separate and detect the intracellular contents of hundreds of individual mammalian cells in a short time period. The current biological target is to assess kinase enzyme activity within single cells to study the role these enzymes play in intracellular signaling transduction pathways. Microfluidic devices are well-suited to address this type of high-throughput assay because of their ability to precisely manipulate the sub-picoliter volume contained within a mammalian cell and to achieve rapid electrophoretic separation of the cellular contents.
This dissertation describes continued development of a microfluidic network in which a constant stream of cells is pulled through an electric field. Once cells enter the electric field region, electrical cell lysis occurs and the resulting cell lysate is electrokinetically injected into a perpendicular separation channel. Electrophoretic separation of the intracellular contents then occurs. The development of this microfluidic device includes investigations into channel surface coatings to reduce cell adhesion and cellular debris buildup on the glass microfluidic channels, development of electrophoretic separation
on the separation conditions and modifications to the channel network to increase the sample throughput.
A significant portion of this research also involved development of a new microfluidic network for high-throughput single cell analysis. The new device design utilizes a modified patch-clamp trapping method and is capable of rapidly trapping and lysing individual cells in succession. Development, unique fabrication aspects and
This work is dedicated to my parents,
ACKNOWLEDGEMENTS
There are many people to thank for their support and assistance in performing the work described. First of all, I would like to thank my advisor, Dr. Ramsey, for allowing me to work in his research group. Dr. Ramsey has been very supportive of trying new things and much of the progress was a result of this creative freedom. I also have to thank the entire Ramsey group, both current and former members, for all of their assistance in the laboratory. For the most part, I have worked on this project individually. Without the assistance,
thoughtful discussions and guidance from my fellow group members, I would not have been able to accomplish much. Without a doubt, I have to thank J.P. Alarie for all of his help in pretty much every aspect of this project. J.P. helped keep all of the instruments running and helped me work through setting up experiments when I had no idea where to start.
I extend my gratitude to Dr. Nancy Allbritton, our collaborator on this project. Dr. Allbritton helped me understand the biological aspects of my project. She also was incredibly supportive and understanding of the difficulties associated with working with cells, which helped me get through some of the frustrating times. I also appreciate the help from members of Allbritton laboratory, especially Dr. Sumith Kottegoda and Dr. Chris Sims, for thoughtful discussions, materials and helpful information to guide my experiments.
TABLE OF CONTENTS
LIST OF TABLES ... xiii
LIST OF FIGURES ... xiv
LIST OF ABBREVIATIONS AND SYMBOLS ...xx
Chapter 1 : Introduction to Single Cell Analysis: History and Methods ...2
1.1 The importance of studying cells one at a time ...2
1.2 History of single cell analysis methods ...4
1.3 Microfluidics technology and single cell analysis ...7
1.4 Application of microfluidics to high-throughput single cell analysis ...11
1.5 Research goals and objectives ...14
1.5.1 Main goals ...14
1.5.2 Evaluation of a flow through device for high-throughput single cell analysis ...15
1.6 References ...18
Chapter 2 : Prevention of cellular adhesion and cellular debris build-up on glass microchannels ...25
2.1 Introduction ...25
2.1.1 Cell adhesion and cellular debris build-up on the flow through device ...25
2.1.2 Cellular adhesion to microfluidic channel surfaces ...25
2.1.3 Cellular debris build-up on channel surfaces ...26
2.1.4 Biofouling prevention...28
2.1.5 Channel coating investigations ...29
2.2.1 Chip fabrication ...29
2.2.2 Cell culture and preparation ...30
2.2.3 Channel coating procedures ...31
2.3 Results and discussion ...34
2.3.1 Comparison of coating procedures ...35
2.3.2 FBS channel pretreatment ...41
2.4 Conclusion ...43
2.5 Tables and figures ...44
2.6 References ...55
Chapter 3 : Characterization of Cell Lysis Events on a Microfluidic Device for High-Throughput Single Cell Analysis ...59
3.1 Introduction ...59
3.2 Experimental ...60
3.2.1 Chemicals ...60
3.2.2 Microchip fabrication ...60
3.2.3 Pluronic channel coating ...60
3.2.4 Electroosmotic flow reversal ...60
3.2.5 Cell culture and preparation ...61
3.2.6 Device operation and data collection ...61
3.3 Results and discussion ...62
3.4 Conclusion ...70
3.5 Tables and figures ...71
3.6 References ...77
4.1 Introduction ...79
4.1.1 Analysis of kinase enzymes using fluorescent peptide reporters ...80
4.2 Experimental ...84
4.2.1 Chemicals ...84
4.2.2 Microchip fabrication ...85
4.2.3 Cell culture and preparation ...86
4.2.4 Microchip preparation ...86
4.2.5 Chip operation and data collection ...87
4.2.6 Data Analysis ...89
4.3 Results and Discussion ...89
4.3.1 Flow through chip for cytosolic dye separations...89
4.3.2 Analysis of cells loaded with Myr-ss-SPKC reporter peptide ...91
4.3.3 Development of a Double T chip ...93
4.4 Conclusion ...95
4.5 Figures ...97
4.6 References ...111
Chapter 5 : Separation development for kinase enzyme reporter substrates and products ...116
5.1 Introduction ...116
5.1.1 Separation development for single cell kinase analysis ...117
5.1.2 Detection of analytes from a single cell ...118
5.1.3 Method characterization for high-throughput single cell analysis ...119
5.2 Experimental ...121
5.2.1 Reagent information ...121
5.2.4 Device operation for separation development ...121
5.2.5 Device operation for assessment of hydrodynamic flow on the injection and separation of reporter substrates and products ...123
5.2.6 Data analysis...124
5.3 Results and discussion ...124
5.3.1 Development of separation conditions for the positively charged SPKC and PSPKC reporter peptides ...124
5.3.2 Separation of SPKC and PSPKC with channel coatings ...128
5.3.3 Development of separation conditions for a negatively charged sphingosine kinase substrate and product reporter ...132
5.3.4 Effect of hydrodynamic flow on separation conditions ...132
5.4 Conclusion ...135
5.5 Tables and figures ...137
5.6 References ...156
Chapter 6 : Cell isolation and lysis for high-throughput single cell analysis ...159
6.1 Introduction ...159
6.1.1 Trapping design for single cell analysis ...161
6.2 Experimental ...162
6.2.1 Chip fabrication ...162
6.2.2 Channel coatings ...164
6.2.3 Coating of EOF pumping channels ...164
6.2.4 Cell culture and preparation ...165
6.2.5 Chip operation and data collection ...165
6.3 Results and discussion ...167
6.4 Conclusion ...175
Figure 6.1 Cell trapping chip design with channels labeled. Inset A is a zoom
in showing the trident structure for the EOF pump and the trapping site. ...177
6.6 References ...188
Chapter 7 : Conclusion and future work ...191
7.1 Research and results summary ...191
7.2 Future work ...192
7.3 Conclusion ...194
LIST OF TABLES
Table 2.1 Comparison of cell adhesion on various channel coatings ... 44
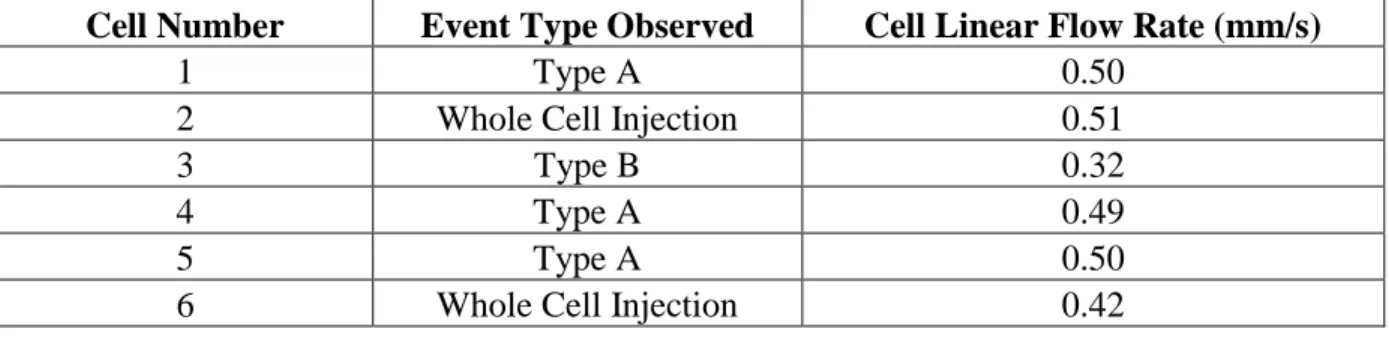
Table 3.1 Event types and corresponding linear flow rates for cells that passed through the lysis intersection. During the data collection period, six cells passed through the lysis intersection and three event types were observed. For each cell, the linear flow rate was measured along the cell flow channel between the channel inlet and the intersection with the focusing channel. ...76
Table 5.1 Preamplifier settings used for reporter peptide separation development ... 137
Table 5.2 Separation conditions for the electropherograms shown in Figure 5.3A and Figure 5.3B ...140
Table 5.3 Relative standard deviations of the migration times for the SPKC and PSPKC peaks shown in Figure 5.3B...140
Table 5.4 Separation conditions for the electropherogram shown in Figure 5.4 ... 141
Table 5.5 Calculation of the amount of SPKC and PSPKC injected using a gate injection...143
Table 5.6 Comparison of SPKC and PSPKC S/N ratios at varying preamplifier sensitivities ...144
Table 5.7 Comparison of SPKC and PSPKC S/N ratios at varying laser powers ... 145
Table 5.8 Separation conditions for the electropherogram shown in Figure 5.9. ... 147
Table 5.9 Separation conditions for the electropherogram shown in Figure 5.10. ... 148
Table 5.10 Separation conditions for electropherogram shown in Figure 5.11. ... 149
Table 5.11 Separation conditions for sphingosine kinase substrate and product ... 153
Table 5.12 Ratio of SPKC to PSPKC peak height for increasing vacuum applied to the waste channel ...155
Table 6.1. Helios Nanolab ion beam and electron beam settings ... 176
LIST OF FIGURES
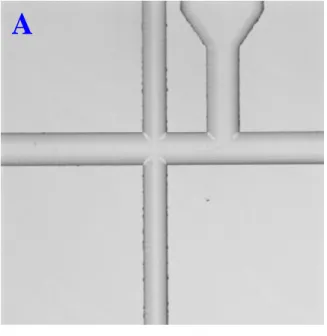
Figure 1.1 Image of the flow through microfluidic channel network with a close up image of the channel network and lysis intersection. Channels are filled with black ink for visualization. Cells are focused to single file, prior to entering the lysis intersection, by the focusing channel (F). At the lysis intersection cells encounter the applied DC electric field and dielectric breakdown of the cell membrane occurs. The cell lysate is electrokinetically injected into the analysis channel (A) and the cell membrane and uncharged
debris flow to cell waste (CW) with the hydrodynamic flow. ...17 Figure 2.1 Images of a flow through device showing typical biofouling. In A),
cellular adhesion that resulted in complete clogging of the cell flow channel is shown. In B), an example of post-lysis cellular debris collection at the
lysis intersection is shown ...45 Figure 2.2 Reaction of PEG succinimidyl ester (PEG-SPA) with the amine
groups of APTES ...46 Figure 2.3 Structures for A) 5(and 6)-carboxytetramethylrhodamine,
succinimidyl ester (5(6)-TAMRA) and B) an example of TAMRA covalently
bound to APTES on a glass channel surface ...47 Figure 2.4 Image of flow through chip coated with APTES and TAMRA. This
image demonstrates the channel fluorescence after the TAMRA has reacted
with the amines of the APTES. ...48 Figure 2.5 Image of a flow through chip coated with APTES/TAMRA
demonstrating the lack of cell debris adhesion at the lysis intersection.
Approximately 100 cells were lysed with no debris adhesion observed. ...48 Figure 2.6 Images of an uncoated channel (A), APTES/TAMRA coated channel
(B) and PEG-Urethane coated channel (C) to compare cell adhesion ...49 Figure 2.7 Pictures of the debris build-up on an uncoated (A), PEG-Urethane
coated (B), and APTES/TAMRA coated (C) chip after on-chip cell lysis ...50 Figure 2.8 Images of cell adhesion at channel inlets for SPA (A),
PEG-silane (B) and TAMRA (C) coated chips ...51 Figure 2.9 Image of a flow through chip channel showing the clogging that
occurs when a high electric field is applied to a channel filled with FBS. ...52 Figure 2.10 Current-voltage curve of the analysis channel filled with FBS. The
Figure 2.11 Images of a flow through chip, filled with 100% FBS, during operation. The start of chip operation is shown in (A). The lysis
intersection, after 413 cells were lysed, showing the accumulation of protein gelation at the top corners of the intersection (indicated by the arrow) is
shown in (B). ...54 Figure 3.1 Images of cell lysis events collected at 132 fps. A) White light image
of chip showing the region of interest (ROI) captured; B) Images of a cell lysis event in which the majority of the lysate is injected into the analysis channel. Images 1-2 display the cell lysing. Images 3-6 display the cell lysate ejecting from the cell membrane within the channel intersection. Images 7-8 show the flow of the cell membrane to waste and the migration of the cell lysate (Oregon Green) down the analysis channel to the detection point; C) Images of a cell lysis event in which a significant portion of the cell lysate is lost to waste. Images 6-8 demonstrate the flow of some cell lysate
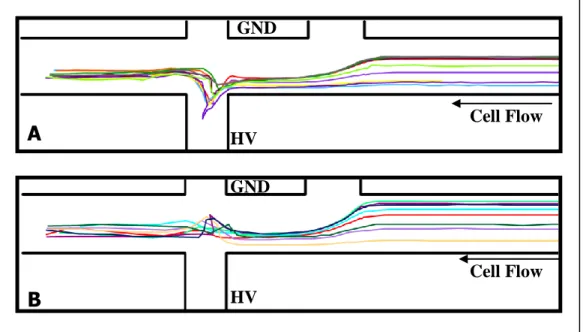
down the cell waste channel with the cell membrane post-lysis. ...71 Figure 3.2 Cell flow paths plotted for A) lysis events in which the majority of
lysate is injected into the separation channel (Type A events) and B) lysis events in which a significant amount of cell lysate is not injected and flows
with the hydrodynamic flow to waste (Type B events). ...72 Figure 3.3 Plotted flow paths of 10 m-diameter fluorescently labeled
polystyrene beads with A) no electric field applied along the analysis
channel and B) electric field applied along the analysis channel ...73 Figure 3.4 Images displaying the Rhodamine B flow path to visualize the
direction of electroosmotic flow within the analysis channel. Rhodamine B is pulled from the sample reservoir to waste through application of negative pressure on the waste reservoir. A DC electric field is applied along the analysis channel. In A) the analysis channel is coated with Pluronic F-127 and the EOF is observed to be slightly cathodic. In B) the EOF is reversed by coating the analysis channel with a polyamine compound, PolyE323. The
flow of Rhodamine B to the anode confirms the EOF reversal. ...74 Figure 3.5 Plotted flow paths of A) beads and B) cells after electroosmotic flow
reversal within the analysis channel. In A), 10-m diameter fluorescently-labeled polystyrene beads all demonstrate a flow path in which they deviate into the analysis channel due to the pull of the anodic EOF. This flow path is similar to that of the type A cells. The flow path of Jurkat cells through the lysis intersection with the EOF reversed can be seen in B). All cells were
observed to take similar flow paths. ...75 Figure 4.1 Protein kinase C substrate peptide sequence is shown in A). The
substrate and phosphorylated substrate peptide standards without the
Figure 4.2 A schematic of the Double T microchip with channel descriptions is
shown in A) and an image of the focusing and lysis regions is shown in B). ...98 Figure 4.3 Experimental set-up for lysate data collection. Image A shows the
microscope with the optical components for LIF detection. A microchip was placed on the microscope stage and the 488-nm line of an argon ion laser was focused onto the analysis channel for collection of lysate data. A schematic of the optical components used is shown in B. The laser was focused onto the chip channel using a LWD M Plan Apo 20X objective. The resulting fluorescence was passed through a dichroic filter, followed by a 530DF30 and a 488 long pass filter before detection using a photomultiplier
tube. ...99 Figure 4.4 Chemical structure of A) Oregon Green® 488 carboxylic acid
diacetate, CAS# 195136-74-4, and B) carboxyfluorescein diacetate, CAS#
3348-03-6, cytosolic dyes ...100 Figure 4.5 An image of the Rhodamine B flow path through the lysis intersection
upon application of ~480 V/cm is shown in A). In B), the flow paths of two cells through the lysis intersection during application of the same electric
field are shown. ...101 Figure 4.6 Separation of Oregon Green and carboxyfluorescein from the lysate of
a single cell in 100% FBS-filled channels. ...102 Figure 4.7 The separation of Oregon Green and carboxyfluorescein from eight
individual cells analyzed in a single run. Some of the lysate peaks from different cells co-migrated (e.g., cells 3, 4 and 5) because the time between these lysis events was not sufficient to prevent lysate packet overlap. Loss of resolution was observed from the beginning to the end (i.e., from cell 1 to
cell 8) of the ~1.3 minute period shown. ...103 Figure 4.8 Schematic demonstrating the flow of ECB ions into the analysis
channel of the flow through chip. This flow of ions changes the analysis channel buffer composition and affects the resolution of the cytosolic dyes
from single cells ...104 Figure 4.9 Electropherogram of Oregon Green and carboxyfluorescein separation
from four individual cells. The cells were diluted in 100% FBS and the
resolution loss from cell 1 to cell 4 was minimal. ...105 Figure 4.10 Graph showing the resolution between the carboxyfluorescein and
Oregon Green peaks when cells were diluted in ECB with 10% FBS versus 100% FBS. The ECB + 10% FBS data are represented by the blue dots and
Figure 4.12 Five minute runs of Myr-ss-SPKC peptide-loaded Jurkat cells
displaying the analysis of ten lysed cells. The peaks from individual cells are outlined with blue-dashed boxes. In A) the peaks from six individual cells are highlighted. These were lysate separations in which there were no
interfering or overlapping peaks from previously or subsequently lysed cells.
In B), the peaks from four lysed cells are highlighted. ...108 Figure 4.13 The flow path of fluorescein through the Double T chip is shown in
A). Still frames from a video showing a cell passing through the lysis intersection, lysing and the cytosolic dye injecting into the analysis channel
are shown in B). ...109 Figure 4.14 A 30-minute run on the Double T chip showing analysis of 134 cells
that were loaded with carboxyfluorescein and Oregon Green cytosolic dyes. The entire run is shown in A) and a zoom in of four analyzed cells is shown
in B). ...110 Figure 5.1 Structure of A) sphingosine kinase substrate (S-1) and B)
phosphorylated product (S-1-P) ...137 Figure 5.2 Absorption and emission of Fluorescein shown as a function of pH.
(Source: www.invitrogen.com) ...138 Figure 5.3 Electropherograms showing the separation of SPKC and PSPKC
peptides on an uncoated cross chip using Tris/Boric Acid buffer. The separation with the laser focused 10 mm down the analysis channel from the injection point is shown in A). The separation with the laser focused 3 mm
down the analysis channel from the injection point is shown in B). ...139 Figure 5.4 Separation of SPKC and PSPKC on a cross chip coated with 30%
(v/v) Pluronic F-127 ...141 Figure 5.5 Electropherogram showing the LOD for the SPKC and PSPKC
peptide. Here, 1.3 and 0.9 attomole of SPKC and PSPKC, respectively, was
injected and the S/N for each peak was between 3 and 4. ...142 Figure 5.6 Electropherograms of the injection of ~1.3 attomole SPKC and ~0.9
attomole PSPKC peptide, using a gated injection, with varying preamplifier
sensitivities. The preamplifier was set at 500, 200 and 100 nA/V. ...144 Figure 5.7 Electropherograms of the injection of ~1.3 attomole SPKC and ~0.9
attomole PSPKC peptide, using a gated injection, with varying laser power.
The laser power was varied between 5 and 20 mW. ...145 Figure 5.8 Structure of PolyE323 ... 146 Figure 5.9 Separation of SPKC and PSPKC on three separate flow through chips
Figure 5.10 Separation of SPKC and PSPKC on a PolyE323 coated flow through
device with 0.1% Acetic Acid, pH 3.0, separation solution ...148 Figure 5.11 Separation of PSPKC and SPKC on a PolyE323 coated chip with 10
mM HEPES containing 30 mM PEG and 1 mM TCEP-HCl, pH 6.6 ...149 Figure 5.12 Overlay of separations with similar concentration mixtures of SPKC
and PSPKC to show the signal increase with pH. ...150 Figure 5.13 Structure of AEPTMS polyamine silane ... 150 Figure 5.14 Electropherograms showing three injections of a SPKC and PSPKC
peptide mixture on a polyamine coated chip using a 10 mM Acetate buffer,
30 mM PEG, 3 mM B-cyclodextrin, pH 4.5. ...151 Figure 5.15 Separation of SPKC and PSPKC on a polyamine silane coated chip
with 0.1% Acetic Acid, pH 3.0 ...152 Figure 5.16 Separation of sphingosine kinase substrate and product on an
uncoated flow through device ...153 Figure 5.17 High voltage relay switching for simulation of chip operation. In A)
the sample is pulled from the SB channel to waste through application of vacuum to the waste reservoir. Simultaneously, an electric field is applied between the CF and analysis channels. In B) a plug of sample is injected into the analysis channel by switching the ground to the SB channel and then
quickly back to the CF channel for running. ...154 Figure 5.18 Effect of increasing hydrodynamic flow on the separation of SPKC
and PSPKC...154 Figure 5.19 Effect of increasing hydrodynamic flow on the separation of the
sphingosine kinase and product. ...155 Figure 6.1 Cell trapping chip design with channels labeled. Inset A is a zoom in
showing the trident structure for the EOF pump and the trapping site. ...177 Figure 6.2 SEM images of a cell trapping chip. Image A shows the chip with the
gap between the top and bottom of the separation channel prior to milling the
trapping aperture. Image B shows the trapping aperture after milling. ...178 Figure 6.3 Image of channel coatings. EOF pump channel 1 (EP1) is either
uncoated or coated with PolyE323 to create a positive surface charge. The EOF pump channel 2 (EP2), separation channel (S), Cell Flow (CF) and Waste (W) channels were coated with PEG-Silane to eliminate the EOF in
Figure 6.4 Image A indicates the direction of the EOF in each channel for an EOF pump created with PolyE323. The resulting direction of the field free flow through the trapping aperture upon application of voltage to the EOF pump channels is indicated. Image B shows the EOF upon application of ground to the EP2 channel and high voltage (HV) to the bottom of the separation channel. Note: For EOF pumps created using an uncoated EP1
channel, the Electric Field is reversed in Image A. ...180 Figure 6.5 Schematic (A) and Image (B) of High Voltage Switching Circuit ... 181 Figure 6.6 Still frames from a video showing cell trapping and lysis modes. In A,
a single cell is trapped at the trapping aperture. Images B through F show the voltage switch to Lysis Mode and the subsequent cell lysis and lysate
injection...182 Figure 6.7 Electropherogram showing the signal observed when a single cell was
trapped and the resulting lysate peaks detected after lysis. ...183 Figure 6.8 Current blockades observed as cells pass through the trapping
aperture. The blue traces show the base current, which was offset to zero. The red traces show the current fluctuations as cells are pushed through the
trapping channel. ...184 Figure 6.9 Image of debris buildup at the trapping site ... 185 Figure 6.10 Images of a multi-trapping chip showing three FIB milled trapping
channels...186 Figure 6.11 Image of sequential capture (A to C) of 10 m fluorescent beads at
the three trapping apertures on a multi-trapping device ...187 Figure 7.1 Concept for the cell loading station. Cells are pulled from a sample
reservoir into the central chamber and retained at a grating (A). Vacuum is applied to the top channel to allow for a continuous flow of loading and wash solutions (B), from the bottom of the main channel, over the cells. After loading, the cells are pulled out of the chamber through application of vacuum to the outlet channel (C). In D, the integration of the cell loading
concept with the flow through device is shown. ...195 Figure 7.2 SEM images of the grating used to retain cells in the central chamber.
The entire chip is shown in A. A zoom in of the FIB-milled retention grating
is shown in B. ...196 Figure 7.3 Still frame images of cells being loaded with Oregon Green. Cells are
retained at the grating and in (A) Oregon Green is pulled across the cells. In (B), the bottom reservoir solution was exchanged for ECB to wash the cells.
LIST OF ABBREVIATIONS AND SYMBOLS
A – analysis channel
AEPTMS - 3-[2-(2-Aminoethylamino)ethylamino]propyl-trimethoxysilane APTES – aminopropyltriethoxysilane
BOE – buffered oxide etch C-14 – 14 carbon chain CF – cell flow channel
CMBA - chloromethylbenzoic acid CMC – critical micelle concentration CZE – capillary zone electrophoresis DI – deionized
Dm – solute diffusion coefficient E – electric field strength
e.g. – for example
ECB – extracellular buffer
EDTA – ethylenediaminetetraacetic acid E-field – electric field
EOF- electroosmotic flow EtOH – ethanol
F – focusing channel FAM – carboxyfluorescein
FIB – focused ion beam GND - ground
HCl – hydrochloric acid
HEPES - 4-(2-hydroxyethyl)-1-piperazineethanesulfonic acid HIV – human immunodeficiency virus
HV – high voltage i.d. - inner diameter i.e. – that is
kV – kilovolts
Ld – length of capillary to detector LIF – laser induced fluorescence LOD – limit of detection
LWD – long working distance
MEKC – micellar electrokinetic chromatography MeOH – methanol
mm – micrometer mM – millimolar
MOSFET – metal-oxide-semiconductor field-effect transistor ms – microsecond
mW – milliwatt
Myr-SS-SPKC – myristoylated disulfide linked substrate for Protein Kinase C N – theoretical plates
NaOH – sodium hydroxide pA – picoamperes
PDMS – polydimethylsiloxane PEG- polyethylene glycol
PEG-silane - 2-[methoxy(polyethyleneoxy)propyl]trimethoxysilane PEG-SPA - polyethylene glycol succinimidylpropionate
PEG-urethane - N-(triethoxysilylpropyl)-O-poly(ethylene) oxide urethane PKC – protein kinase C
psi – pound per square inch PMT – photomultiplier tube
PSPKC – phosphorylated substrate peptide for protein kinase C ROI - region of interest
RSD – relative standard deviation S/N – signal-to-noise
S-1 – sphingosine
S-1-P – sphingosine-1-phosphate SB – separation buffer channel SDS – sodium dodecyl sulfate SEM – scanning electron microscope Ser – serine
SPKC – substrate peptide for protein kinase C
TCEP-HCl – Tris(2-carboxyethyl) phosphine hydrochloride
Tris/BA – 50 mM Tris, 10 mM boric acid buffer containing 30 mM PEG, 1 mM TCEP-HCl and 1 mM spermine
ep – electrophoretic mobility
Chapter 1: Introduction to Single Cell Analysis: History and Methods
1.1 The importance of studying cells one at a time
Each cell has a unique molecular, metabolic and proteomic identity.8 Amongst cells of the same type, it has been widely observed that significant biochemical heterogeneity exists.10-13 Cells identical in genetic make-up and appearance can differ in numerous characteristics including the concentration of metabolites or other intracellular compounds, the extent of gene expression and the response to a given stimulus.1,14-18 The heterogeneity in intracellular contents demonstrates not only the natural state of a cell population but also reflects the history of the cells as environmental factors can pose a significant influence on cellular functions.19 Because biological membranes are dynamic systems in a constant state of flux, external factors such as pH, ionic strength and temperature lead to some of these variations in intracellular contents.1 Additionally, heterogeneity can arise from a number of other factors including localized damage, mutations, stages in the cell cycle, cell age and exposure to various external stimuli.10,20 The complexity introduced by this heterogeneity makes it challenging to study and fully understand cellular processes and cellular response to stimuli.7
Typical studies to quantify intercellular metabolites or to observe cellular response to stimuli are performed as ensemble averages. Ensemble averaging methods simultaneously analyze a large number of cells and the resulting parameter measured is an average value from all of the cells.21-23 The methods for these pooled studies mostly utilize well-plate screenings24 and western blot techniques.22 Western blotting has been the work-horse
cellular response to stimuli using averaging methods rarely provides accurate information and can often be highly misleading as to what is happening within a single cell of the population.12,14 It is well-understood that the optimal means to understand cell-based systems is to study cells individually.12 Recently, the interest in single cell analysis techniques has spiked as various technologies to perform single cell level studies have advanced.
In addition to understanding the chemical heterogeneity, single cell level analysis is required for a number of other reasons. For instance, many cellular reactions occur on such short timescales such that they cannot be effectively studied using population averaging techniques.7,9,12,14 Additionally, many diseases start with a single abnormal cell.9
1.2 History of single cell analysis methods
The progression of single cell analysis technology has taken place over the last 60 years and, today, there are numerous methods in which single cell data can be collected. As far back as the 1950s, proteins and lipids within an individual cell could be monitored using techniques such as X-ray microradiography31 and nucleic acids could be semi-quantified using ultraviolet spectroscopy.32 The ability to perform truly quantitative chemical cytometry, or single cell analysis, was first reported in 1953 by J.E. Edstrom.33 In his experiments, RNA was studied through ribonuclease digestion of individual nerve cells followed by a paper chromatography separation. The separated RNA was then quantified using UV spectrometry. In 1965, Matioli and Niewisch separated hemoglobin variants from individual erythrocytes using an electrophoretic method.34 Single cell gel electrophoresis, commonly referred to as a comet assay, eventually became the convention for studying DNA damage within single cells in the 1970s.35 Since that time, several other techniques have also been implemented for single cell analysis. Some of these techniques include open tubular liquid chromatography (OTLC)36, gel electrophoresis37, mass spectrometry (MS)38, micro-thin-layer chromatography39-40, electron microscopy41, enzymatic radiolabeling42 and fluorescence microscopy.43-44 The main challenges encountered with these techniques for single cell level analysis include poor detection limits, inability to distinguish multiple cellular components simultaneously and/or poor quantitative capabilities.15 The invention and development of capillary electrophoresis (CE) in the 1980s overcame many of the limitations encountered with these other techniques.45-46
individual snail neuronal cells were separated and quantified using electrochemical and laser induced fluorescence (LIF) detection. The first reported analysis of a single mammalian cell was by Yeung’s group in 1992. In Yeung’s work, hemoglobin and carbonic anhydrase from human erythrocytes were separated by capillary zone electrophoresis (CZE) and detected using LIF.15 Currently, some research groups, such as Arriaga’s, have even been able to analyze individual cell organelles using CE with LIF detection.49 CE methods for single cell analysis have found many uses for detecting and quantitating cellular analytes and several recent reviews have been published on this work.1-2,14,28,50-52
The procedure for separating intracellular compounds by CE, also referred to as chemical cytometry53-54, is performed using one of two methods. The first method involves injection of the whole cell into the capillary, followed by immediate lysis of that cell and electrophoretic separation of the contents.29,52,55-56 Alternatively, the cell can be lysed just outside of the capillary with immediate injection of the lysate into the capillary for
analysis.12,14 Because of the small inner diameter of the capillary, CE techniques are capable of sampling the small volumes found within a cell and, depending on the injection technique, will not significantly dilute the cell volume post-lysis.3 Many lysate analytes can be
Although CE is an elegant technique for analyzing the contents of an individual cell, there are several drawbacks that limit its capabilities and the amount of data that can be collected. First, cell lysis and lysate injection techniques are problematic. The demonstrated techniques are not highly reproducible and can be time-consuming.1-2,9,13-16,19,25,57-58 These labor intensive methods limit the throughput capabilities. Single cell experiments should ideally involve the analysis of a large number of cells (e.g., >1000) due to the inherent variability associated with biological samples. But, the collection of large data sets in a reasonable time frame is not feasible using CE-based methods.1,17,19,56 The reported throughputs for CE analysis of cells range from 10-40 cells per day maximum.1,16,52,56 Additionally, the long separation times frequently required by traditional CE systems also inhibit the throughput capabilities.16-17,61-62 Although high-throughput single cell analysis by CE has been demonstrated for very simple systems, e.g., analysis of erythrocytes, it has not been well-established for complex mammalian cell analysis.25
screening of stable cell lines.63-67 Commercial flow cytometry instruments are available and are reported to provide throughputs of up to 70,000 cells per second.64
Although flow cytometry is highly sensitive and provides high-throughput analysis, there are limitations to the number of analytes that can be simultaneously detected from a single cell. First, each tag used must have unique spectral characteristics.25,29 The limited availability of unique analyte tags is a major drawback to the technique.63 Additionally, each tag that emits a unique wavelength requires a separate detector; thus, the equipment itself can become cumbersome if a large number of compounds are to be analyzed. Another
disadvantage to the flow cytometry techniques is that inefficient reactions between the tag and the analyte provide questionable quantification accuracy.17 It has been reported that flow cytometry analysis is generally used for total protein content or total DNA content rather than individual analyte detection.19
Because of the various disadvantages of each technique, neither flow cytometry nor capillary electrophoresis can provide a general method for simultaneous content, high-throughput chemical cytometry.
1.3 Microfluidics technology and single cell analysis
Microfluidics is a relatively new and advancing technology that has emerged with the potential to overcome the limitations associated with CE and flow cytometry for high-throughput single cell analysis.9 The technology has been around since the 1980s68 but has come of interest for biomedical applications since the 1990s.13
Microfluidic devices, also referred to as microchips or lab-on-chip devices, are being developed for a wide variety of applications. In general, they are used to manipulate
micrometer regime.69 In a typical device, channels range from 1 m to 1 mm in dimension. More recent devices have features in the nanometer range as well.70 The channels can be fabricated from a variety of materials to form the channel networks. Glass and polymers are the most common materials used for microdevice fabrication, although alternative materials such as plastics are also used.71-72
Microfluidic techniques have several advantages over traditional macroscale systems. Some of the initial motivations for microchip development include the low sample volume requirements for analysis and the high separation efficiencies that can be achieved.24,48 The small channel dimensions result in low total volumes contained within the channels;
therefore, smaller amounts of reagents and samples are required for analysis compared to macroscale techniques. This is highly advantageous for applications where only a small amount of sample is available, such as with DNA samples, or in instances where it is difficult to acquire large sample volumes.
Electrophoresis is the most common mode of separation performed on microfluidic devices. Because of the small channel dimensions and short channel lengths, extremely high electric fields can be applied using relatively safe voltage levels.10 As shown in Equation 1, the efficiency of an electrophoretic separation varies linearly with electric field strength; therefore, highly efficient separations can be achieved on-chip.
Equation 1
N = µep E Ld 2Dm
Where: N = theoretical plates E = Electric field strength ep = electrophoretic mobility
Because of the increased efficiency, separations within microchannels can be
performed on a faster timescale compared to conventional CE systems.9 Other advantages of microfluidic devices that have been cited include the ease of automation, portability, low power requirements, inexpensive fabrication and ability to manipulate precise fluid volumes.7,9,24,56,68,73-74 The small channel volumes allow for highly sensitive analyte detection as well. Common detection methods, including electrochemical, mass
spectrometry and fluorescence, have been interfaced for analyte detection on microchips. These combined separation and detection set-ups make it possible to develop total analysis systems that can control everything from sample preparation through detection and data collection.24
The application of microfluidic devices for high-throughput single cell analysis is feasible for many reasons. First, the small sample requirements give microchip analysis a distinct advantage over techniques that require much more sample for successful operation.59 Often, the limited quantities of diseased cells that can be obtained from a patient are
impossible to analyze using conventional techniques, such as flow cytometry, yet
microfluidic devices can handle analysis of these smaller sample volumes. Next, because microfluidic channel dimensions are compatible with typical mammalian cell sizes75, cells can be easily moved through the channel networks and multiple process steps can be incorporated onto a single device.10,14,24 Retention and isolation of an individual cell and subsequent analysis of that cell’s cellular content have also been demonstrated on
would unfortunately cause too much stress on the cells and the resulting data from such an experiment would most likely be highly inaccurate. Because of this, conventional CE methods with modified lysate injection schemes still remain the best option for adherent cell analysis.56
Another advantage of microfluidic devices over conventional CE for non-adherent cell analysis is that fast buffer exchange can occur around the cell just prior to lysis.1,78-79 It is known that buffers that are “cell-friendly”, meaning buffers that maintain cell viability and place little stress on cells, are not usually optimal for performing electrophoretic
separations.80-81 Cell-friendly buffers generally contain high salt content to provide isotonic conditions for the cell. Even at low electric fields, this high salt content can lead to
significant Joule heating and can result in bubble formation within the channels. Because fast buffer exchange can be achieved on a microfluidic device, cells can be maintained in a high salt content, cell-friendly buffer up until the time of lysis.
Besides the above mentioned reasons there are several other distinct advantages to using microfluidic devices for cell analysis. The small footprints of microfluidic channel networks make them amenable to parallelization that allows many cells to be observed simultaneously.13,24,61,79 Highly sensitive detection techniques allow for detection of even the low copy number analytes that are often found within a single cell.10 Injection of cell lysates can be achieved without significant dilution of the cellular contents.10 Finally, the
microenvironment around the cells can be carefully controlled within a microchannel, which reduces unnecessary stress on the cells.7,13,74 Stress is known to invoke signaling
Although in theory microfluidic technology should be easily adapted for high-throughput single cell analysis applications, it has not yet been demonstrated in a practical manner.6-7 However, many research groups have demonstrated novel ways to analyze single cells on microchips.
1.4 Application of microfluidics to high-throughput single cell analysis
Single cell analyses on microfluidic devices have been achieved through a variety of methods. In addition to chemical cytometry, on-chip methods have been developed to generate gradients for cell chemotaxis studies82, to amplify DNA from a single cell using PCR68, to monitor hormone secretions from live cells83 and to screen cytotoxicity.84
One theory on how to achieve effective single cell analysis on microfluidic devices, either to perform chemical cytometry or simple microscopy experiments, is to first
immobilize individual cells.27,61,77,85 There are several methods for cell isolation, the majority of which involve dielectrophoresis, optical tweezers, mechanical trapping or cell trapping in a hydrogel.4,76,86-87 Mechanical trapping is the simplest method to capture single cells and many groups have already demonstrated this type of cellular immobilization on microchips for single cell analysis. The first electropherogram of a single protein compound from an individual cell collected on a microfluidic device was in 2005 using an
immobilization method.85 In this case, a Sf9 insect cell was trapped using PDMS
(CHO) cells at a narrow channel, in a similar manner to patch clamping, to observed on-chip lysis using hydroxide generation.89 Werdich et al. analyzed cardiac myocytes by gravity transport of an individual cell to a tapered channel where electrodes were used to monitor the calcium flux.90 Zhang and coworkers immobilized CHO-K1 cells on a surface to observe the calcium release over time.91 Many other examples of immobilization for single cell analysis can be found in the literature.13,86,92
Whether performing chemical cytometry experiments, where the cell is lysed and contents separated, or microscopy, where the cell behavior or response is observed over time, it is relatively simple to immobilize cells on microfluidic devices. Although most single cell analysis reports involve immobilization, the time required for cell trapping limits the
throughput. The maximum reported throughput achieved using immobilization methods is 25 cells/hour.1 Although these throughput rates are fast compared to traditional methods, maintaining these throughput rates for a significant period of time to collect a large data set has not been reported.
One strategy for analyzing a large number of cells on a microchip has been through parallelization of channels. Munce and co-workers performed parallel single cell analysis by trapping cells within an array of individual tapered channels. Cells were isolated and
transported to the tapered channels using optical tweezers. The trapped cells were
High-throughput chemical cytometry experiments on microfluidic devices have not been easily achieved. The highest throughput rate for single cell chemical cytometry was published by Wang et al. They achieved analysis of calcein-loaded cells at a rate of 75 to 85 cells per minute by pulling the cells through a direct current (DC) field for lysis.94 This throughput would be highly sufficient; however, the authors report significant peak overlap of the calcein dye peaks from one cell to the next. So, although the throughput rate was good, not enough time was allowed between cells for appropriate electrophoretic separation and detection of the lysate analytes for even a simplified system of dye-loaded cells. In another high-throughput example to quantify glutathione (GSH) levels in erythrocytes, gravity flow was used to transport a single cell to an analysis channel. Voltages were then switched on and off within the analysis channel to cause the cell to flow back and forth so that it eventually adhered to the channel surface. After adherence, the cell was subsequently lysed and analyzed. Using this method, 15 cells/hour throughput rate was reported.95 Lin’s group reported 10 cells/minute analysis rates for GSH in K562 cells using a simple cross chip design and approximately 100 cells per run could be analyzed. Yet, with their set-up, there was little control over the cell flow rate and the lysed cells were made to inject into the analysis channel. This method does not allow for adequate control over the separation of the intracellular analytes because the migration times will vary depending on where each cell lyses in the analysis channel.96
large data sets was not demonstrated. Also, no reported devices have shown the ability to collect biologically relevant information from single cells in a high-throughput manner such that statistically significant conclusion can be made for biological experimentation.
1.5 Research goals and objectives
1.5.1Main goals
The main objective of the research discussed in this dissertation is development of an automated microfluidic device to perform chemical cytometry analysis on individual cells in a high-throughput manner. The device should be capable of collecting large data sets from a sample of cells during a single operational run of the device. By automated, it is implied that the device should be capable of performing the following functions on-chip, with little to no user interaction required:
1. Preparation of the cell sample
2. Transport of the cells to a lysis region 3. Isolation of individual cells for analysis 4. Lysis of an isolated cell
5. Electrophoretic separation and detection of the analytes
As the term “high-throughput” is arbitrarily defined, the goal for this project is to achieve analysis of approximately 10 cells per minute. Additionally, “large data set” is also a relative term. Here, the goal is to obtain 100 data points (i.e., cells analyzed) per sample run. Consistent collection of large data sets (>100 cells) in a high-throughput manner has not yet been reported in the literature.
CE-based analysis method currently used for single cell analysis. This CE-based method is referred to as the Laser Micropipet System (LMS).12,55,97-98 It is reported that only 8 to 10 cells per day can be analyzed using the LMS. Thus, development of the device described above would provide an approximate 1000-fold increase in throughput.
The device to be developed should be capable of analyzing any intracellular analytes, provided that the analytes can be separated without interference from other lysate
components and can be measured on-chip through microchip-compatible detection methods. Although the device function will be universal for study of many cellular compounds, the initial objective of the device was to be able to measure kinase enzyme activity. Kinase enzymes and the methods to determine enzyme activity are discussed in later chapters. Throughout development, each of the above listed functional steps for the device were addressed individually, in order of importance to device operation. Advancement of a channel network previously developed and published was achieved. Additionally, the proof-of-concept work for a completely new channel network to achieve some of the device goals is discussed. The advancements made for each process step are detailed in the following chapters with additional background information as needed.
1.5.2Evaluation of a flow through device for high-throughput single cell analysis
injected into the analysis channel for electrophoretic separation and LIF detection. To mark the on-set of the lysate separation, cells are focused into approximate single file just prior to the lysis intersection by constricting the cell flow path using a focusing channel. The focused cells pass through another detection point that provides a cytometric signal. This cytometric signal is used to provide a zero time point for the lysate separation.
At the start of this research, the channel network shown in Figure 1.1 was evaluated to determine what areas needed improvement to make the chip amenable to the collection of biologically relevant data. Several issues were immediately noted. These development areas included:
1. Reducing cellular adhesion along the cell flow channel and collection of cellular debris at the lysis intersection
2. Controlling the hydrodynamic cell flow through the chip and balancing it with the electromigration of cells down the analysis channel to achieve optimal lysate injection
3. Isolation of cells prior to lysis so that several cells do not enter the lysis intersection simultaneously
4. Automation of cell preparation
Figure 1.1 Image of the flow through microfluidic channel network with a close up image of the channel network and lysis intersection. Channels are filled with black ink for
visualization. Cells are focused to single file, prior to entering the lysis intersection, by the focusing channel (F). At the lysis intersection cells encounter the applied DC electric field and dielectric breakdown of the cell membrane occurs. The cell lysate is electrokinetically injected into the analysis channel (A) and the cell membrane and uncharged debris flow to cell waste (CW) with the hydrodynamic flow.
Lysis Intersection 0V
1.6 References
(1) Sims, C. E.; Allbritton, N. L. Lab on a Chip 2007, 7, 423.
(2) Woods, L. A.; Roddy, T. P.; Ewing, A. G. Electrophoresis 2004, 25, 1181.
(3) Yeung, E. S. Journal of Chromatography A 1999, 830, 243.
(4) Andersson, H.; van den Berg, A. Current Opinion in Biotechnology 2004, 15, 44.
(5) Amiji, M.; Park, K. Journal of Biomaterials Science-Polymer Edition 1993, 4, 217.
(6) Yin, H. B.; Zhang, X. L.; Pattrick, N.; Klauke, N.; Cordingley, H. C.; Haswell, S. J.; Cooper, J. M. Analytical Chemistry 2007, 79, 7139.
(7) Breslauer, D. N.; Lee, P. J.; Lee, L. P. Molecular Biosystems 2006, 2, 97.
(8) Sweedler, J. V.; Arriaga, E. A. Analytical and Bioanalytical Chemistry 2007, 387, 1.
(9) Price, A. K.; Culbertson, C. T. Analytical Chemistry 2007, 79, 2614.
(10) Roman, G. T.; Chen, Y. L.; Viberg, P.; Culbertson, A. H.; Culbertson, C. T.
Analytical and Bioanalytical Chemistry 2007, 387, 9.
(11) Sims, C. E.; Bachman, M.; Li, G. P.; Allbritton, N. L. Analytical and Bioanalytical Chemistry 2007, 387, 5.
(12) Meredith, G. D.; Sims, C. E.; Soughayer, J. S.; Allbritton, N. L. Nature Biotechnology 2000, 18, 309.
(13) Chao, T. C.; Ros, A. Journal of the Royal Society Interface 2008, 5, S139.
(14) Huang, W. H.; Ai, F.; Wang, Z. L.; Cheng, J. K. Journal of Chromatography B-Analytical Technologies in the Biomedical and Life Sciences 2008, 866, 104.
(16) Wong, K. S.; Yeung, E. S. Mikrochimica Acta 1995, 120, 321.
(17) McNamara, K. P.; Yeung, E. S.; Rosenzweig, N.; Rosenzweig, Z. Analytica Chimica Acta 1997, 356, 75.
(18) Huang, B.; Wu, H. K.; Bhaya, D.; Grossman, A.; Granier, S.; Kobilka, B. K.; Zare, R. N. Science 2007, 315, 81.
(19) Hogan, B. L.; Yeung, E. S. Analytical Chemistry 1992, 64, 2841.
(20) Mehrishi, J. N.; Bauer, J. Electrophoresis 2002, 23, 1984.
(21) Zabzdyr, J. L.; Lillard, S. J. Trac-Trends in Analytical Chemistry 2001, 20, 467.
(22) Li, P. C. H.; de Camprieu, L.; Cai, J.; Sangar, M. Lab on a Chip 2004, 4, 174.
(23) Ionescu-Zanetti, C.; Blatz, A.; Khine, M. Biomedical Microdevices 2008, 10, 113.
(24) Dittrich, P. S.; Manz, A. Nature Reviews Drug Discovery 2006, 5, 210.
(25) Chen, S. J.; Lillard, S. J. Analytical Chemistry 2001, 73, 111.
(26) Berthier, J.; Silberzan, P. Microfluidics for biotechnology; Artech House: Boston, 2006.
(27) Sun, Y.; Yin, X. F. Journal of Chromatography A 2006, 1117, 228.
(28) Xue, Q. F.; Yeung, E. S. Journal of Chromatography B-Biomedical Applications
1996, 677, 233.
(29) Krylov, S. N.; Dovichi, N. J. Electrophoresis 2000, 21, 767.
(30) Danna, E. A.; Nolan, G. P. Current Opinion in Chemical Biology 2006, 10, 20.
(32) Caspersson, T. Skand. Arch. Physiol. 1936, 73.
(33) Edstrom, J. E. Biochimica Et Biophysica Acta 1953, 12, 361.
(34) Matioli, G. T.; Niewisch, H. B. Science 1965, 150, 1824.
(35) Rydberg, B.; Johanson, K. J. DNA Repair Mechanisms; Academic Press, 1978.
(36) Oates, M. D.; Cooper, B. R.; Jorgenson, J. W. Analytical Chemistry 1990, 62, 1573.
(37) Osborne, N. N. Nature 1977, 270, 622.
(38) Abramson, F. P.; Mccaman, M. W.; Mccaman, R. E. Analytical Biochemistry 1974,
57, 482.
(39) Briel, G.; Neuhoff, V.; Osborne, N. N. International Journal of Neuroscience 1971,
2, 125.
(40) Osborne, N. N.; Szczepan.Ac; Neuhoff, V. International Journal of Neuroscience
1973, 5, 125.
(41) Davis, D. Micron 1978, 9, 175.
(42) Mccaman, R. E.; Weinreic.D; Borys, H. J Neurochem 1973, 21, 473.
(43) Jongkind, J. F.; Ploem, J. S.; Reuser, A. J. J.; Galjaard, H. Histochemistry 1974, 40, 221.
(44) Reuser, A. J. J.; Jongkind, J. F.; Galjaard, H. J Histochem Cytochem 1976, 24, 578.
(45) Jorgenson, J. W. Trac-Trends in Analytical Chemistry 1984, 3, 51.
(47) Kennedy, R. T.; Stclaire, R. L.; White, J. G.; Jorgenson, J. W. Mikrochimica Acta
1987, 2, 37.
(48) Kennedy, R. T.; Oates, M. D.; Cooper, B. R.; Nickerson, B.; Jorgenson, J. W. Science
1989, 246, 57.
(49) Fuller, K. M.; Arriaga, E. A. Analytical Chemistry 2003, 75, 2123.
(50) Han, F. T.; Wang, Y.; Sims, C. E.; Bachman, M.; Chang, R. S.; Li, G. P.; Allbritton, N. L. Analytical Chemistry 2003, 75, 3688.
(51) Woods, L. A.; Ewing, A. G. Analytical and Bioanalytical Chemistry 2003, 376, 281.
(52) Stuart, J. N.; Sweedler, J. V. Analytical and Bioanalytical Chemistry 2003, 375, 28.
(53) Zhang, Z. R.; Krylov, S.; Arriaga, E. A.; Polakowski, R.; Dovichi, N. J. Analytical Chemistry 2000, 72, 318.
(54) Dovichi, N. J.; Hu, S. Current Opinion in Chemical Biology 2003, 7, 603.
(55) Sims, C. E.; Meredith, G. D.; Krasieva, T. B.; Berns, M. W.; Tromberg, B. J.; Allbritton, N. L. Analytical Chemistry 1998, 70, 4570.
(56) Borland, L. M.; Kottegoda, S.; Phillips, K. S.; Allbritton, N. L. Annual Review of Analytical Chemistry 2008, 1, 191.
(57) Gilman, S. D.; Ewing, A. G. Analytical Chemistry 1995, 67, 58.
(58) Gao, N.; Wang, W. L.; Zhang, X. L.; Jin, W. R.; Yin, X. F.; Fang, Z. L. Analytical Chemistry 2006, 78, 3213.
(59) Krutzik, P. O.; Nolan, G. P. Nature Methods 2006, 3, 361.
(60) Jankowski, J. A.; Tracht, S.; Sweedler, J. V. Trac-Trends in Analytical Chemistry
(61) Munce, N. R.; Li, J. Z.; Herman, P. R.; Lilge, L. Analytical Chemistry 2004, 76, 4983.
(62) Lillard, S. J.; Yeung, E. S.; McCloskey, M. A. Analytical Chemistry 1996, 68, 2897.
(63) Jayaraman, S. Cytometry Part A 2003, 56A, 104.
(64) Bonetta, L. Nature Methods 2005, 2, 785.
(65) Lecoeur, H.; Melki, M. T.; Saidi, H.; Gougeon, M. L. Method Enzymol 2008, 442, 51.
(66) Le, T. T.; Cheng, J. X. Plos One 2009, 4.
(67) Butts, C. L.; Shukair, S. A.; Duncan, K. M.; Harris, C. W.; Belyavskaya, E.; Sternberg, E. M. Nuclear Receptor Signaling 2007, 5, e007.
(68) Lee, C. Y.; Lee, G. B.; Lin, J. L.; Huang, F. C.; Liao, C. S. Journal of Micromechanics and Microengineering 2005, 15, 1215.
(69) Hadd, A. G.; Jacobson, S. C.; Ramsey, J. M. Analytical Chemistry 1999, 71, 5206.
(70) Kovarik, M. L.; Jacobson, S. C. Analytical Chemistry 2009, 81, 7133.
(71) Iles, A.; Oki, A.; Pamme, N. Microfluidics and Nanofluidics 2007, 3, 119.
(72) Sun, X. F.; Liu, J. K.; Lee, M. L. Electrophoresis 2008, 29, 2760.
(73) Hung, P. J.; Lee, P. J.; Sabounchi, P.; Lin, R.; Lee, L. P. Biotechnology and Bioengineering 2005, 89, 1.
(74) Nevill, J. T.; Cooper, R.; Dueck, M.; Breslauer, D. N.; Lee, L. P. Lab on a Chip 2007,
7, 1689.
(76) Li, P. C. H. Microfluidic lab-on-a-chip for chemical and biological analysis and discovery; Taylor & Francis/CRC Press: Boca Raton, 2006.
(77) Ros, A.; Hellmich, W.; Regtmeier, J.; Duong, T. T.; Anselmetti, D. Electrophoresis
2006, 27, 2651.
(78) Lee, P. J.; Hung, P. J.; Lee, L. P. Biotechnology and Bioengineering 2007, 97, 1340.
(79) Taylor, R. J.; Falconnet, D.; Niemisto, A.; Ramsey, S. A.; Prinz, S.; Shmulevich, I.; Galitski, T.; Hansen, C. L. Proceedings of the National Academy of Sciences of the United States of America 2009, 106, 3758.
(80) Wheeler, A. R.; Throndset, W. R.; Whelan, R. J.; Leach, A. M.; Zare, R. N.; Liao, Y. H.; Farrell, K.; Manger, I. D.; Daridon, A. Analytical Chemistry 2003, 75, 3581.
(81) Li, H.; Wu, H. Y.; Wang, Y.; Sims, C. E.; Allbritton, N. L. Journal of Chromatography B 2001, 757, 79.
(82) Frevert, C. W.; Boggy, G.; Keenan, T. M.; Folch, A. Lab on a Chip 2006, 6, 849.
(83) Roper, M. G.; Shackman, J. G.; Dahlgren, G. M.; Kennedy, R. T. Analytical Chemistry 2003, 75, 4711.
(84) Brouzes, E.; Medkova, M.; Savenelli, N.; Marran, D.; Twardowski, M.; Hutchison, J. B.; Rothberg, J. M.; Link, D. R.; Perrimon, N.; Samuels, M. L. Proceedings of the National Academy of Sciences of the United States of America 2009, 106, 14195.
(85) Hellmich, W.; Pelargus, C.; Leffhalm, K.; Ros, A.; Anselmetti, D. Electrophoresis
2005, 26, 3689.
(86) Johann, R. M. Analytical and Bioanalytical Chemistry 2006, 385, 408.
(87) Huang, Y.; Ewalt, K. L.; Tirado, M.; Haigis, T. R.; Forster, A.; Ackley, D.; Heller, M. J.; O'Connell, J. P.; Krihak, M. Analytical Chemistry 2001, 73, 1549.
(89) Di Carlo, D.; Ionescu-Zanetti, C.; Zhang, Y.; Hung, P.; Lee, L. P. Lab on a Chip
2005, 5, 171.
(90) Werdich, A. A.; Lima, E. A.; Ivanov, B.; Ges, I.; Anderson, M. E.; Wikswo, J. P.; Baudenbacher, F. J. Lab on a Chip 2004, 4, 357.
(91) Zhang, X. L.; Yin, H. B.; Cooper, J. M.; Haswell, S. J. Electrophoresis 2006, 27, 5093.
(92) Di Carlo, D.; Aghdam, N.; Lee, L. P. Analytical Chemistry 2006, 78, 4925.
(93) Yun, K. S.; Yoon, E. Biomedical Microdevices 2005, 7, 35.
(94) Wang, H. Y.; Lu, C. Chem Commun 2006, 3528.
(95) Gao, J.; Yin, X. F.; Fang, Z. L. Lab on a Chip 2004, 4, 47.
(96) Yu, L. F.; Huang, H. Q.; Dong, X. L.; Wu, D. P.; Qin, J. H.; Lin, B. C.
Electrophoresis 2008, 29, 5055.
(97) Li, H.; Sims, C. E.; Kaluzova, M.; Stanbridge, E. J.; Allbritton, N. L. Biochemistry
2004, 43, 1599.
(98) Li, H. N.; Sims, C. E.; Wu, H. Y.; Allbritton, N. L. Analytical Chemistry 2001, 73, 4625.
Chapter 2: Prevention of cellular adhesion and cellular debris build-up on glass microchannels
2.1 Introduction
2.1.1 Cell adhesion and cellular debris build-up on the flow through device
Upon initial evaluation of the flow through device shown in Chapter 1, it was observed that the number of cells that could be analyzed in a single run of the chip was severely limited by cellular adhesion to the cell flow channel or by cellular debris collection at the lysis intersection. The collection of biomaterials to microchip channel surfaces is frequently referred to as biofouling. Examples of this biofouling can be seen in Figure 2.1. To reduce biofouling on the flow through device, several alternative coating procedures were investigated. Some of the coatings demonstrated an improvement over the original
polydimethylsiloxane (PDMS)/Pluronic coating. These new procedures increased the number of cells that could be analyzed in a single run of the device without significant biofouling. In this chapter, the different surface coatings and channel pretreatments tested to reduce biofouling are discussed.
2.1.2 Cellular adhesion to microfluidic channel surfaces
minimal biofouling.3 Adhesion of a single cell to the surface often leads to agglomeration of cells within the channel.1,6 This collection of cells hinders the ability of additional cells to flow and often causes complete clogging of the channel. Therefore, there is a great need to develop channel coatings that are biocompatible and resistant to biofouling.7-8
There are a number of reasons that cells adhere to channel surfaces. Low flow rates, such as those frequently required for on-chip chemical cytometry, allow the cells to interact with the channel surfaces and increases the probability that they will irreversibly adhere.9-10 The proteins and glycoproteins present on cellular membranes give mammalian cells a net negative charge.11-13 This surface charge creates electrostatic interaction between the cells and positive charges on the channel walls. Also, many transmembrane proteins are
hydrophobic and allow for interaction between the cells and certain hydrophobic channel surfaces.4,14-15
2.1.3 Cellular debris build-up on channel surfaces
Once biofouling begins on a microfluidic channel intended for biological data
collection, a number of issues arise.5 First, once sites of biomolecule adsorption are initiated, aggregation of biomaterial at those sites becomes even more favorable.22 This debris
aggregation can eventually cause complete blockage of the microfluidic channels.23-24 After blockage, the device must be cleaned for reuse. To clean the biomaterials off the channel surfaces, harsh treatments are usually required. Rinses with 1% sodium dodecyl sulfate (SDS) or 1 N NaOH have been reported to clean some material from the surface.24 For glass chips, heating to 500ºC for a period of time will oxidize the adsorbed biomaterial from the surface.25 Sterilizing chips is also achieved using ethanol, bleach, UV radiation, or
autoclaving.25 Sterilization, however, does not necessarily remove the biomaterials from the channel surfaces. Many of the procedures for cleaning the channel surfaces will also remove channel coatings; therefore, the chip must also be recoated appropriately, which can cause significant delays in sample analysis.
For separation of biomolecules (e.g., proteins), adsorption of the analytes to the channel walls has been shown to cause peak broadening, changes in retention time and affect the electroosmotic flow (EOF) rate.2,5,7,17,20,26-29 These effects are problematic for complex separations because resolution loss and retention time changes make it challenging to
positively identify and quantify peaks. For analytes that are of low abundance within a single cell, adsorptive loss can critically affect the detection and quantification ability.30
be time-consuming and may introduce additional experimental variability. For the collection of large single cell data sets, it is necessary that the cells be analyzed as quickly as possible. This is because signaling pathways can be initiated or inhibited as the cells await analysis. The intracellular analyte concentrations can also change on short timescales; therefore, a long analysis time will result in less accurate results. The optimal solution is to find a channel surface that will minimize the biofouling and allow a single device to be operated long enough for collection of large data sets (e.g., >100 cells analyzed).
2.1.4 Biofouling prevention
A variety of methods have been used to reduce biofouling within microfluidic channels. Surface modifications are the most commonly employed method and can create biocompatible surfaces for analysis. Other methods include adjustment of the buffer ionic strength within the channels22, use of emulsification agents to try to wash the debris off the surface17,25 and manipulations of buffer composition.21 To date, surface coatings, whether applied dynamically or statically, have provided the best reduction in biofouling.
Hydrophobic surfaces are prone to cellular adhesion.15,20,22,34 As mentioned above, it is believed that this adhesion is due to the hydrophobic nature of many transmembrane proteins.4 On the other hand, it has been observed that protein adsorption is greatly reduced when using hydrophilic polymeric coatings, such as polyethyleneoxide (PEO).35 Other coatings reported in the literature to reduce biofouling include: hydroxypropyl
2.1.5 Channel coating investigations
In this chapter, the various surface coatings that were examined to prevent biofouling are discussed. Biofouling reduction focused mainly on surface modification with PEG and zwitterionic compounds due to the relatively simple channel coating procedures. Some alternative approaches, such as buffer additives and channel pretreatments, were also tested. Methods that were attempted but not discussed in this chapter due to poor results include the use of: phosphatidylcholine, starting block buffers and perfluorinated silanes. The best results for reduction in biofouling were obtained when the glass microfluidic channels were pretreated with 100% fetal bovine serum (FBS).
2.2 Experimental section
2.2.1 Chip fabrication
Dremel tool. The altered Luer lock was then epoxied onto the top of the cell waste reservoir and 1/16˝ i.d. Tygon tubing was attached to the female Luer lock via a 1/16˝ barbed male Luer lock (Upchurch Scientific, Oak Harbor, WA).
Several different microchips were used for this study. Channel depths and widths were determined using a stylus-based surface profiler (P-15; KLA-Tencor, Mountain View, CA). Widths are reported as the full channel width measured at the top of the channel. All channels were etched to a depth between 20 - 25 m. The cell flow (CF) channel and the cell waste (CW) channel were 65-80 m wide. The analysis (A) channel from the lysis
intersection to the 90º turn and the narrow section of the separation buffer (SB) channel were 45-60 m wide. The broad sections of all the channels were 255-270 m wide. The analysis channel from the lysis intersection to the 90º turn was 20.0 mm long, and the distance
between the tee intersection of the focusing (F) channel with the sample cell flow channel and the lysis intersection was approximately 105 m.
For some coating studies, 25.4 mm x 50.8 mm chips were fabricated that had only three straight channels. For each chip, the channels were 19.5 m deep and 110 m wide. A maskless system (SF-100, Intelligent Micro Patterning, LLC, St. Petersburg, FL) was used to expose the photoresist on the substrates. All other photolithography, etching and bonding steps were the same as described above.
2.2.2 Cell culture and preparation
penicillin and 100 g/mL streptomycin. The cells were grown in 25-mL polystyrene culture flasks (Nalge Nunc International, Rochester, NY) to densities of approximately 1x10⁶/mL before passage.
To load the cells with dye, ~5 x 10⁵ cells were pelleted (1000g for 3 minutes) and the supernatant discarded. The cells were then re-suspended in a solution of 10 to 50 M
Oregon Green 488 carboxylic acid diacetate 6-isomer in extracellular buffer (ECB: 135 mM NaCl, 15 mM KCl, 2 mM MgCl2, 2 mM CaCl2, 10 mM HEPES, pH 7.4). Oregon Green in diacetate form is membrane permeable and cell loading was achieved through simple incubation (~20 minutes) in a centrifuge vial while maintaining the cells at 37ºC. The cells were then washed three to four times by pelleting with ECB and re-suspended in ECB containing 10 mM Glucose.
2.2.3 Channel coating procedures
2.2.3.1 PDMS/Pluronic coating
To coat the glass channels with PDMS, the channels were rinsed for approximately five minutes with 1 N NaOH followed by deionized (DI) water for five minutes. The channels were then thoroughly dried by pulling vacuum on one reservoir of the chip. A mixture of 1:10 PDMS (w/w, 1 part curing agent to 10 parts monomer, Sylgard, Dow