ARP-based Detection of Scanning Worms Within an Enterprise Network
David Whyte
P.C. van Oorschot
Evangelos Kranakis
Abstract
Rapidly propagating worms are arguably the
great-est security threat currently facing the Internet. To
date, worm writers have been successful in penetrating most security countermeasures. Signature-based
detec-tion schemes often fail to detect zero-day worms, and
their ability to rapidly react to new threats is limited as they typically require some form of human involve-ment to formulate updated attack signatures. We pro-pose an anomaly-based detection technique designed to protect internal networks from scanning worm infections. This is the first publication in the open literature (to our knowledge) proposing and providing a detailed descrip-tion of a method to detect propagadescrip-tion of scanning worms within individual networkcells. We show that this tech-nique is both accurate and rapid enough to enable auto-matic containment and suppression of worm propagation within a network cell. Implemented in software, our detec-tion approach relies on an aggregate anomaly score, de-rived from the correlation of Address Resolution Protocol (ARP) activity from individual network attached devices. Our preliminary analysis and prototype indicate that this technique can be used to rapidly detect zero-day worms within a very small number of scans, e.g. three scans with a false positive rate of five over a two week period in our test environment. The necessary individual ARP activ-ity system profiles are automatically generated during a training period and thus the software can be rapidly de-ployed with minimal tuning and administration.
1 Introduction
Scanning worms are rapidly evolving. Despite some very promising recent proposals (e.g. see [17]), most signature-based detection techniques are limited in their ability to detect newly emerging worms. Compounding the scanning worm detection challenge are the numerous worm variants typically launched after an initial outbreak. Slight code modifications enable worms to evade many
dlwhyte, paulv, [email protected]. School of Computer Science, Carleton University, Ottawa, Canada. January 31, 2005.
signature-based countermeasures. Worms can also em-ploy a variety of detection techniques such as: anti-forensics, dynamic behavior, and modularity of attack tools [13]. Unfortunately, even the best network secu-rity posture can fail due to newly discovered vulnerabil-ities, careless users, and improper system configuration. Clearly the advantage in this digital arms race lies with the worm writer. Network defenders must close all possi-ble security exposures, whereas an attacker only needs to find one in order to penetrate the network.
Worm infected hosts must be rapidly detected in order to contain worm propagation. Infected hosts can poten-tially initiate thousands of infection scans per second [11] making automated suppression and containment strategies necessary. The detection methods used within these auto-mated schemes must be both fast and accurate. Addition-ally, if the detection technique is prone to false positives, it can mean legitimate users and services are impacted. Many worms now spread so quickly that traditional intru-sion detection methods (i.e. generation and deployment of attack signatures) are too slow [12]. Most current worm propagation detection methods are limited in: (1) their speed of detection, (2) their inability to accurately detect
zero-dayworms, (3) their inability to detect slow scanning worms, and (4) their high false positive rate.
Worm containment systems can contain an outbreak if the number of infected systems does not exceed an epi-demic threshold [12, 22], depending on the properties of a worm. Containment within an enterprise network typ-ically involves dividing the network into cells [4]. Al-though these cells can be as small as a single system (i.e. host-based containment) in a large network, the individ-ual cells could be comprised of hundreds of hosts. The goal of such containment is to limit infection to individ-ual cells; infection between hosts within a cell remains unchecked, with the potential loss of the hosts within a network cell considered an acceptable cost given the alter-native of the entire network becoming infected. Topolog-ical worms focus their scans on a particular subnet (e.g. harvested from the infected hosts) of logically or physi-cally connected systems [18], and communicate targeting information among infected hosts to bypass security coun-termeasures and increase the propagation rate. In this sit-uation, limiting infection to a single network cell still
al-lows considerable damage within the cell. In this paper, we propose a detection technique that detects scanning worms attempting to propagate between hosts within an individual network cell. For the purposes of our approach, we define acellas any portion of a network within a com-mon broadcast domain.
Typically, scanning worms use a pseudo-random gen-erator to generate 32-bit random numbers that correspond to the IPv4 addresses of their intended victims. The use of a numeric IP address instead of qualified domain name to locate the system obviates the need for a domain name system (DNS) query. It has been shown that this charac-teristic can be used as a behavioral signature1 to detect
scanning worms within an enterprise environment [20]. We propose another behavioral signature based on the ob-servation that a scanning worm targeting systems within its own network cell exhibits anomalous behavior distinct from normal Address Resolution Protocol (ARP) [14] ac-tivity; infected systems trigger unusual ARP request activ-ity as they try to infect susceptible systems within their re-spective network cells. More specifically, intra-cell worm-initiated scans result in discernible behavioral changes in the amount and pattern of ARP request activity of infected hosts, because a scanning worm targeting same-cell sys-tems triggers the broadcast of anomalous ARP requests.
Our Contributions. We present a technique, which
we have implemented and tested in a software prototype, to both rapidly and accurately detect worm propagation within enterprise network cells. Based on the following three factors, we derive an anomaly score for each indi-vidual device2, and use this as an infection indicator for
each device within a cell.
1. Peer list: connections to devices outside the set of internal devices a host normally interacts with.
2. ARP activity: increases in the average number of
ARP requests each host issues per unit time.
3. Internal network dark space[1, 2]: connections to
vacant internal IP addresses (i.e. addresses not bound to any active devices).
The greater the anomaly score attributed to a network de-vice, the more likely it is infected with a scanning worm.
In our test environment, our technique detected simu-lated scanning worm activity with a minimum sustained scanning rate of one scan per minute, within three scans, with a very low false positive rate (see next paragraph). The precision of this first-mile detection enables the use of automated containment and suppression strategies [12] to stop scanning worms before they infect other devices
1Behavioral signatures [6] are used to describe common aspects of
worm behavior particular to a given worm.
2Hereafter bydevice, we typically mean a network addressable host
within the broadcast network.
within a network cell. This scheme relies solely on the observation and correlation of activities related to a single protocol (i.e. ARP). ARP was designed as the interme-diary between IP and MAC addresses within local sub-nets. Other technologies such as Windows Internet Nam-ing Service (WINS), Internet Protocol (IP), and Domain Name Service (DNS) that enable communication outside of local subnets all rely on ARP.
Our anomaly-based detection approach is appealing for a number of reasons including the following:
1. Speed: the possibility to detect an infected system within e.g. three scans.
2. Detection of zero-day worms: possible because the
approach does not rely on the matching of existing worm signatures to identify suspicious traffic. 3. Scanning rate independence: the approach can detect
both fast and slow scanning worms (assuming a sustained scanning rate of at least one scan per minute -although this is somewhat configurable).
4. Intra-cell protection: our approach addresses infec-tion of systems within a network cell.
5. Low-false positive rate: our prototype, albeit on a small network (see Section 4.1), experienced only five false positives within a two week period and this number could be further reduced (see Table 2). 6. Ease of deployment: the approach is network-based,
runs on commodity hardware, and relies on the ob-servation of a protocol found in every network (i.e. ARP).
Enterprise-wide scanning worm detection is a crucial component of any effectivenetwork security postureand thus has been the subject of considerable research. Al-though certain marketing-related documentation offers the possibility that intra-cell worm propagation is addressed in at least one available commercial product [2] (albeit not involving ARP), we are not able to find any details from available published materials. To the best of our knowl-edge, our paper is the first in the open literature to pro-pose a method and detailed description for, and to report on an implementation of, a detection technique that en-ables scanning-worm detectionwithina network cell (i.e. intra-cell propagation).3 Used in conjunction with other
internal scanning worm containment schemes that address propagation between network cells [19, 20, 21], our tech-nique enables a complete enterprise-wide scanning worm detection capability (i.e. both intra-cell and inter-cell).
Although our analysis confirms the validity of this tech-nique, in networks of differing characteristics, its effec-tiveness may vary. Specifically, our technique may have limited applicability in networks where typically devices
interact with a large percentage of other devices within the network cell (e.g. distributed or peer-to-peer networks (P2P)). In such instances, our technique could be inte-grated as a secondary input to a more sophisticated suite of anomaly detectors.
The sequel is structured as follows. Section 2 outlines the basic approach of the detection technique. Section 3 discusses our prototype, which is analyzed in Section 4 with details for a particular dataset and small testbed. Section 5 presents limitations. Section 6 discusses future work. Section 7 reviews related work. We conclude in Section 8.
2 Basic Methodology and Approach
In this section we give a high-level overview of our ARP-based scanning worm anomaly detection approach.
In larger enterprise networks, it is not unusual for net-work segments to be either logically or physically sepa-rated. In fact, an enterprise network may be comprised of several distinct subnets for a variety of reasons includ-ing security, ease of administration, and geographical lo-cation. This natural separation of networks can be lever-aged to contain worm propagation within distinct network segments. Silicone Defense’sCounterMalicesolution [4] divides the enterprise network into segments calledcells
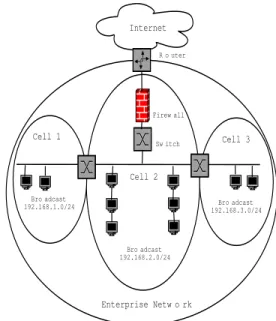
with the specific intention that each cell contains a worm containment device to confine and contain worm infec-tion. As mentioned earlier, by our definition a cell is any portion of a network within a common broadcast domain. Figure 1 illustrates how an enterprise network can be di-vided into cells. The enterprise network is connected to the Internet through a single egress point (i.e. firewall).
As has been noted elsewhere (e.g. see [20]), the prop-agation of scanning worms can be characterized as: lo-cal to lolo-cal (L2L), lolo-cal to remote (L2R), or remote to local (R2L). In L2L propagation, the worm targets sys-tems within the boundaries of the enterprise network in which it resides e.g. scanning within network cells (i.e.
intra-cell) or between them (i.e.inter-cell)4. L2R
propa-gation refers to a scanning worm within an enterprise net-work targeting systems outside of its netnet-work boundary. Finally, R2L propagation refers to worm scanning from the Internet into an enterprise network. Our approach ad-dresses L2L worm propagation within a network cell (i.e. L2L intra-cell); it does not address L2L inter-cell, L2R, or R2L worm propagation.
2.1 ARP Anomaly Detection Approach
Devices that reside within the same network cell use ARP rather than the Domain Name Service (DNS) to com-municate. ARP is a layer 2 protocol (i.e. data link layer)
4Topological scanning worms (e.g. Nimda) employ this strategy [18].
Cell 1 Cell 2 Cell 3 Enterprise Network Internet Firewall Switch Broadcast 192.168.1.0/24 Broadcast 192.168.2.0/24 Broadcast 192.168.3.0/24 Router
Figure 1. Dividing an Enterprise Network into Cells. Three network cells are separated by switches. Each cell has its own Class C network and distinct broadcast domain.
used by the IP protocol to map IP addresses to the physi-cal hardware (MAC) addresses of network devices. When a device needs to resolve a given IP address to a MAC address, it broadcasts an ARP request. The ARP request packet contains the sender’s IP address (source protocol address), the sender’s MAC address (source hardware dress), and the destination IP address (target protocol ad-dress). Each device within the common broadcast domain receives this packet. The protocol specifies that only the device with the specified destination IP address will re-spond with an ARP reply. An ARP reply contains both the IP address and MAC address of the device that responds. ARP activity is a necessary precursor to communications between devices as it provides the data link layer with the necessary mappings between the IP and MAC addresses of communicating devices.
For the purposes of our approach, we define ascanas an ARP request. An ARP request indicates that a system is trying to resolve an IP address to a MAC address for some type of connection. However, it is possible for a host to connect to a device without an immediately pceding ARP request. Once a device performs an ARP quest, the MAC-to-IP address mapping within an ARP re-ply is maintained locally in the device that receives it in a table called an ARP cache. Only the device that made the ARP request receives the ARP reply. The ARP cache entries also have an associated time to live (ttl) and are dynamically entered and removed. If an ARP reply is
re-ceived by a device and the MAC address already appears within its cache, it is overwritten by the update. As long as the ARP reply remains in the local cache, subsequent connections to the same device will result in the MAC ad-dress being obtained from the cache rather than through an ARP request. The affect of ARP caches on our approach is discussed in Section 2.1.2. Our technique can be de-ployed on any device within the broadcast domain, even in a switched network fabric (see Section 6.1), and as it only processes ARP requests, it is extremely efficient.
L2L worm propagation can occur within a particular cell or span multiple cells depending on the scanning strat-egy of the worm. L2L scanning activity results in un-usual ARP activity, namely: (1) an infected device will use ARP to try to connect to some devices within the in-ternal network with which it had no previous history of connecting to pinfection; (2) the number of ARP re-quests generated per fixed unit time (e.g. every 60 sec-onds) will increase; and (3) in those networks where not all IP addresses within a netblock have been allocated, ARP requests will be generated for nonexistent systems (i.e. forinternal network dark space). We now discuss in turn how we use each of these behaviors to derive an aggregate anomaly score for each device within a cell.
2.1.1 Peer List (Customary ARP request targets)
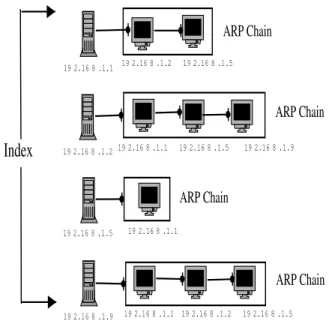
A training period is used to determine normal device in-teractions within a cell. ARP requests observed during the training period allow us to characterize normal device in-teractions through the use of a peer list (see Figure 2). A peer list is indexed by all the devices which made ARP re-quests (i.e. served as a source protocol address within an ARP request) during a training period. Each ARP chain contains entries of the devices being queried in requests by the indexing device (i.e. target protocol address within the ARP request).
The source protocol address of an ARP request is the IP address of the device trying to resolve an IP address to its corresponding MAC address. The target protocol address, encapsulated within an ARP request, is the IP address of the system being queried which will be the eventual target of a connection. Each time an ARP request is generated, any observed new source protocol address is recorded as an index entry within the peer list. Figure 2 contains four entries within its index (i.e. 192.168.1.1, 192.168.1.2, 192.168.1.5, and 192.168.1.9). The corresponding target protocol addresses of the respective queries are added as entries indexed by the corresponding source protocol ad-dress. Over a training period, we build an index of active systems within the network cell (i.e. ARP requestors) and the list of devices (ARP chains) they are trying to connect with. The individual elements within each ARP chain are
192.168.1.2 192.168.1.5 192.168.1.1
ARP Chain
Index
192.168.1.2 192.168.1.5 192.168.1.1 192.168.1.5 192.168.1.9 192.168.1.1 192.168.1.9 192.168.1.1 192.168.1.2 192.168.1.5ARP Chain
ARP Chain
ARP Chain
Figure 2. Peer List for a small network with four active devices. There are four ARP chains of 2, 3, 1 and 3 elements. Each ARP chain is com-prised of an index value equal to an ARP requestor’s IP address. The index and the associated collection of ARP chains is known collectively as the peer list. derived from the set of IP addresses queried by the ARP requestor. If an ARP requestor queries the same device more than once, this activity is ignored (i.e. no duplicate entries exist within an ARP chain). Typically, individ-ual devices will only communicate with a small subset of other internal devices that offer some sort of service (e.g. DNS, file, router, etc.).5
For each device in a cell, we assign an anomaly score for thepeer list factor( ) as: where is the number of ARP requests as made by device (in the cur-rent sample interval) which are outside of device’s ARP chain. In our testbed, the device identifier corresponds to the last octet in the device’s IP address. For instance, if two ARP requests are made by device 192.168.1.9 to two different IP addresses not contained within its ARP chain within the current sample interval, then . Subse-quent distinct connection attempts outside a device’s ARP chain within the detection window (see Section 2.2) result in a linear growth for this anomaly factor.
The running total of the factor for device is the sum of the values over all sample intervals in the current detection window. More specifically, at sample interval , let as defined above be shorthand for
; then the
5Of course, this assumption is violated e.g. in P2P networks and
highly distributed cooperative network environments. We discuss this further in Section 5.
running total for for the current detection window of width is ! #" $%'& " $ .
If a device tries to connect to another device outside of both its ARP chain and the peer list, it is assigned an anomaly score based on the factor described in Section 2.1.3. Note that a possible source of false positives re-sults from the fact that although perhaps suspicious, a de-vice may legitimately contact another dede-vice outside of its ARP chain (e.g. a legitimate infrequently occurring inter-action between two devices may not be captured during the training period thus not all such occurrences are nec-essarily an indication of a scanning worm).
2.1.2 ARP Activity (Number of ARP requests)
The number of ARP requests is recorded for each active device within the network over discrete sample intervals (e.g. 60 seconds) during the training period. Once the training period is complete, the mean ( ) and standard de-viation (( ) of the observed ARP request activity are cal-culated for each individual device. The standard deviation reveals the normal fluctuation in ARP activity that can be expected during sample intervals.
We set a (somewhat arbitrary) upper bound and call it theexpected maximum ARP request activity()*)for
de-vice within a sample interval:
) ,+-.( (1)
A primary factor in choosing this value is that in a nor-mal (i.e. Gaussian) distribution, 95% of the data values will fall within two standard deviations of the mean value; however, it should be clear that other selections may be equally or more useful. Once the training period has ended, the observed (i.e. subsequently monitored) ARP request activity /0 for each device, is compared to)*. /*213)4 may indicate anomalous scanning activity.
We assign an anomaly score for theARP activity factor
(65 ) for device as follows:
5 7 8 /*'9:);=<>@?BA*CD1FEGC H <>@?BA*CDIFEGC (2) Similar to the factor, this calculation is performed during each sample interval to determine arunningtotal within thedetection window(see Section 2.2) for each de-vice. As device ’s ARP request activity (/ ) increases beyond ) , J5 increases linearly. For instance, server 192.168.1.11 hasKMLONP6QSRJQUT ,(VMLWN
HWXWY H , and) X N Y POZL[T . If/\]^P then 5 _`LWN X TLba Y . This factor is particularly useful in addressing the affect of local ARP caches and large ARP chains (as discussed in Section 4.5).
2.1.3 Internal Network Dark Space
Internal network dark space is defined during the training period. Looking at the peer list in its entirety, we derive a set of internal system addresses that comprise the active systems within the cell during the training period. ARP requests for IP addresses not contained within this set we consider to be anomalous, and refer to asinternal network dark space.
Each network consists of a block of network addresses. Although it is not unusual for an internal network to con-sist of IPv4 Internet addresses, most internal networks use non-routable IP address schemes. If RFC 1918 [15] is fol-lowed, the internal address space can be as large as a Class A network. This allows internal networks to consist of po-tentially millions of hosts. Regardless of whether the IP addresses within a network are non-routable or Internet-accessible, there may exist IP addresses that are not bound to any device within the cell. Connection attempts to these vacant IP addresses are anomalous. We assign an anomaly score for theinternal network dark space factor(c ) dur-ing a given sample interval as:
c d 8 H <e>f?GghijWkl,menjOop;mqorjWgm s <e>f?tiZpruJ>vopw>xmo[j.gmGij.kqlymenzjWop (3) We suggest that the values
be assigned such that it is the same for all devices () and a single observed connection to an internal network dark space address should generate a value c sufficient on its own to meet thealert
thresh-old r and generate an alarm (i.e. in our prototype, we set
s
|{ ; see Section 2.2).
2.2 Setting Alert Thresholds
Our implementation requires that a scanning worm ex-hibit a minimum sustained scanning threshold of one scan per minute. Therefore, we define a sample interval as 60 seconds (i.e. } = 60 seconds). The choice of sample in-terval directly affects the amount of state information that must be maintained by the prototype. Thedetection
win-dow of width (= number of sample intervals) is the
pe-riod of time in which observed anomaly scores for factors and 5 must be maintained in state. In our implemen-tation, we set~!{ (see definition of{ below).
For example, for {L the detection window is 60 seconds and an alert is generated upon a single anoma-lous scan observed within a one minute period. If we set{K^ , the detection window is 120 seconds and two anomalous scans must occur within two minutes to trigger an alarm. Anomalous scans get aged out over time; scans which slide out as the current detection window moves no longer contribute to the anomaly score. Anomaly scores are attributed to devices as ARP requests are processed by the prototype. Therefore, alarms can be generated at
any time regardless of the size of the detection window or when they are observed within a sample interval.
For each sample interval and each device, we derive the total anomaly score for device as:
J ! +65 +Jc (4)
If the current sample interval is denoted as sample inter-val , andZ above is shorthand for
, then the total anomaly score for a window of width ending at sample interval is: #" $%'& " $ (5)
An alarm is generated when 2 { for any device. With respect to factor
and
J5 (or a combination thereof), the configurable alert threshold ({ ) for
is the minimum number of anomalous scans that must be made by device within the detection window before an alarm is generated. As usual, a balance must be struck between incurring false positives and negatives (refer to Section 4.3). The lower the alert threshold, the more sensitive to ARP fluctuations the detection system becomes and the greater the possi-bility of a false positive. { can be manually set before the training period or automatically determined by the de-tection system. Our prototype automatically sets{ to the floor of the highest ) value it has calculated over the training period. For instance (cf. Table 1), 192.168.1.11 has the highest) score (3.65214) therefore{
X
. We discuss how the three anomaly factors interact next to pro-duce .
The first two factors ( , 5 ) reflect the number of anomalous scans observed within the detection window. An anomalous scan for device is considered to be any of: (1) each ARP request outside of a device’s ARP chain (Z factor); (2) each scan by which/0 is in excess of)4 ( 5 factor); or (3) the detection of a single scan to inter-nal network dark space ( c factor). The third factor is unique in that per our parameter settings, an alarm was triggered after a single observation of a scan to internal network dark space regardless of the value of { and the time of observation. For instance, if{ an alert will be generated after detection of two anomalous scans within the detection window (i.e. +345 { ) or the single observation of a scan to internal network dark space (i.e.
c
d
s
!{ ; see Section 2.1.3).
3 High-Level System Design
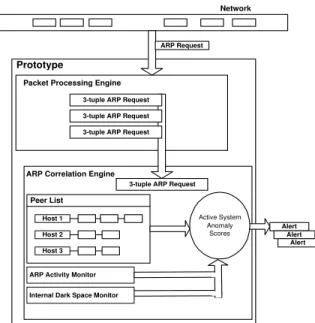
Our software implementation uses thelibpcap [3] li-brary and is comprised of two logical components: PPE and ACE. The Packet Processing Engine (PPE) is respon-sible for extracting the relevant features from the live net-work activity or saved netnet-work trace files (see Section
3-tuple ARP Request 3-tuple ARP Request 3-tuple ARP Request
Packet Processing Engine
Network
Peer List
ARP Correlation Engine Prototype Alert Alert Alert ARP Request Host 2 Host 1 Host 3
ARP Activity Monitor
Active System Anomaly
Scores
Internal Dark Space Monitor
3-tuple ARP Request
Figure 3. High Level Design of Prototype Im-plementation
3.1). The ARP Correlation Engine (ACE) includes a dy-namically generated peer list and the list of IP addresses it considers to be internal network dark space (see Sec-tion 3.2). The ACE maintains in state all relevant ARP information extracted by the PPE. To detect worm propa-gation between network cells, an instance of such a proto-type would need to be deployed in each broadcast domain. Figure 3 shows the high-level design.
3.1 Packet Processing Engine (PPE)
The PPE is responsible for extracting all ARP request packets from network capture files or live off the network. Due to the transmission mechanism of ARP requests (i.e. broadcast), the prototype can be deployed on any device within the network cell. Other forms of ARP activity (e.g. ARP replies) are ignored making this scheme stateless. Feature extraction from the ARP request packets includes 3-tuple tokens (source IP address, target IP address, times-tamp) which are passed to the ACE for processing.
3.2 ARP Correlation Engine (ACE)
The ACE processes all network features passed to it by the PPE. The ACE is responsible for four major func-tions. During the training period, the ACE: (1) creates individual-device specific ARP request statistics, and (2) creates the peer list. Once the training period is complete the ACE: (3) uses ARP request activity to generate a three-factor anomaly score, and (4) generates alarms when the alert threshold has been met or exceeded.
Network ARP Statistic Extraction.During the train-ing period, all tokens passed by the PPE are processed to determine system specific ARP request activity. The ACE maintains ARP request statistics for each active device () within the network. ARP requests, encapsulated in tokens from the PPE, are processed in sampling intervals of dura-tion}. For our implementation, we chose a value of} such that it matched the default ARP cache time to live (ttl) of our devices (i.e. Linux operating systems). If within a sampling interval there is no ARP request activity, this observation is excluded from final mean and standard de-viation calculations (see Section 2.1.2). This is to com-pensate for frequent periods of inactivity (e.g. nights and weekends) that would skew the ARP request statistics giv-ing them lower values than in peak usage times.
At the end of the training period, the mean and standard deviation of ARP request activity is calculated for each device (see for example Table 1). These values comprise the expected maximum () ) ARP request activity for each individual device within the cell.
Peer List. The peer list, constructed during the train-ing period, contains a listtrain-ing of alllivedevices and the IP addresses of the internal devices they were in communi-cation with. In a typical network environment (i.e. client server model), internal devices will try to access only a subset of the devices within their local subnet, as recorded by their respective ARP chains. For any given device, con-necting to a device within its respective ARP chain should occur at a higher probability than other devices within the peer list. If a worm performs unrestricted scanning6of a
network cell, anomalous ARP activity will result. First, ARP requests between system pairs (i.e. infected host and a subset of victims) that have not been observed communi-cating during the training period will occur. Second, as an infected host tries to connect to internal devices the num-ber of ARP requests it issues per unit time will increase.
Anomaly Score and Generating Alerts. Once the
training period is complete, an anomaly score for each in-dividual device within the network cell is maintained (see Section 2.1). An alert is generated when0 { for any device. The timestamp from the triggering ARP request is used as the timestamp for the alert, which also indicates the alert triggering source and destination address.
4 Prototype and Analysis
In this section, we describe the network and data set (network traffic) we used with our software prototype as a proof-of-concept to validate our proposal and refine our system design, and discuss how our prototype performed. Four weeks of network traffic was collected in one of our university research labs. The first two weeks of the
net-6Recall that our definition of a scan is an ARP request.
work data set was used as the training period. We then tested the prototype on the remaining two weeks of data, to determine both the validity of our detection technique, and the affect of the configured alert thresholds on false positive rates. We tested two different approaches to set-ting alert thresholds:
1. Common threshold approach (Section 4.1.1): give every device within the network cell the same alert threshold{ .
2. Function-specific threshold approach (Section 4.1.2): partition the network cell to give devices that perform different functions (e.g. server, workstation) different alert thresholds {
where is the function used to partition the network cell.
Finally, we will describe our scanning worm simulations and report on the performance of our detection software in detecting these scans.
4.1 Data Set for Prototype Evaluation
To validate our approach, we developed and tested a fully functional software prototype with all features dis-cussed in Sections 3.1 and 3.2. The software was installed on a commodity PC running Linux with a 10/100 network interface card. The lab network consisted of a one quar-ter Class C network of Inquar-ternet-reachable IPv4 addresses (i.e. 63). Using the cell definition from Section 2, the lab contained one cell. The lab analysis allowed us to test the prototype’s ability to detect L2L intra-cell worm propaga-tion. Network traffic was collected from November 11 to December 11, 2005.
From the two week training period the prototype au-tomatically determined each device’s peer list size, mean number of ARP requests per minute, standard deviation of ARP requests per minute, and the largest number of ARP requests observed by each device within the sampling in-terval (we used a 60 second period). The last characteristic is not used in the determination of the anomaly score but as an input to analyze the effectiveness of the approach as discussed in Section 4.3.1. After the training period we recorded, for analysis, ARP activity within the network cell in a singlepcapfile for the next two weeks. During this analysis period, we monitored the internal network in-dependently with an intrusion detection system (i.e. snort [16]) to ensure no worm activity was included within the data set. Finally, we simulated scanning worm propaga-tion within the test network using theNmap[7] security scanner to test our detection software.
The respective ARP request activity for each active sys-tem within the internal network is included in Table 1. Network infrastructure devices (i.e. firewall and switches) were excluded from analysis and thus do not appear as index entries within the peer list. The total size of ARP
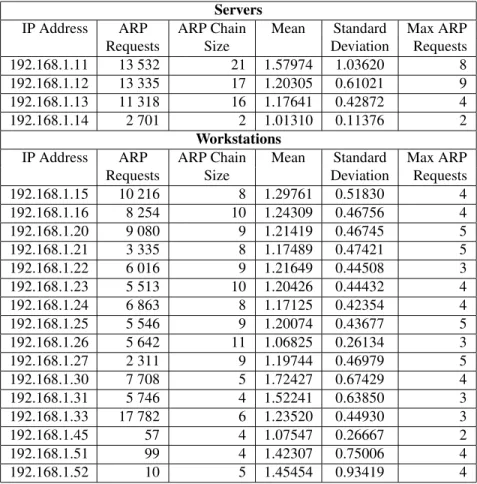
Table 1. ARP Statistics for Prototype System on Lab Network.Mean and Standard Deviation for number of ARP requests made per sample interval of 60 seconds during the training period. Max ARP Requests is the maximum observed ARP requests over any sample interval during the training period.
Servers
IP Address ARP ARP Chain Mean Standard Max ARP
Requests Size Deviation Requests
192.168.1.11 13 532 21 1.57974 1.03620 8
192.168.1.12 13 335 17 1.20305 0.61021 9
192.168.1.13 11 318 16 1.17641 0.42872 4
192.168.1.14 2 701 2 1.01310 0.11376 2
Workstations
IP Address ARP ARP Chain Mean Standard Max ARP
Requests Size Deviation Requests
192.168.1.15 10 216 8 1.29761 0.51830 4 192.168.1.16 8 254 10 1.24309 0.46756 4 192.168.1.20 9 080 9 1.21419 0.46745 5 192.168.1.21 3 335 8 1.17489 0.47421 5 192.168.1.22 6 016 9 1.21649 0.44508 3 192.168.1.23 5 513 10 1.20426 0.44432 4 192.168.1.24 6 863 8 1.17125 0.42354 4 192.168.1.25 5 546 9 1.20074 0.43677 5 192.168.1.26 5 642 11 1.06825 0.26134 3 192.168.1.27 2 311 9 1.19744 0.46979 5 192.168.1.30 7 708 5 1.72427 0.67429 4 192.168.1.31 5 746 4 1.52241 0.63850 3 192.168.1.33 17 782 6 1.23520 0.44930 3 192.168.1.45 57 4 1.07547 0.26667 2 192.168.1.51 99 4 1.42307 0.75006 4 192.168.1.52 10 5 1.45454 0.93419 4
request traffic for the entire four week period was approx-imately 9 MB.
4.1.1 Approach 1: Common Threshold
Table 1 separates servers and workstations in our testbed. Note that, with the exception of one server (a secure log server), the servers within the network have the largest ARP chains. The device with the largest peer list (i.e. 192.168.1.11) was the DNS/mail server for the network. This is not unexpected in a typical client-server model. Likewise, the servers within the network also had the largest observed ARP requests within the sampling inter-vals.
By applying our technique on all the devices within the network, we determined the number of false alarms gen-erated as a function of our alert threshold. Applying a common alert threshold to all devices (common threshold approach), we ran the prototype on the second two weeks of archived ARP request data, varying this threshold to
observe the affect on false positive rates. Each trialrunof the prototype (i.e. processing a two week data file) took less than one minute to complete. A subset of our results are captured in Table 2.
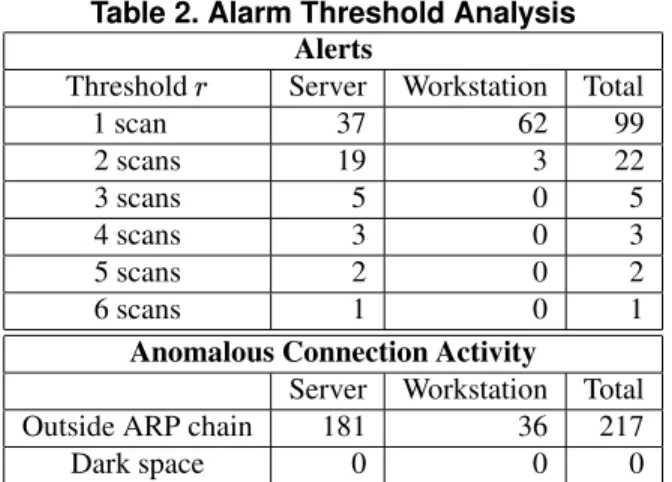
Setting {L resulted in 99 false positives over the two week dataset. Recall that a scan to an IP address considered to be internal network dark space was set to immediately generate an alarm regardless of{ by our sug-gested configuration ofs
{ . As expected, we observed no scans from internal devices to internal network dark spaces.
Setting the alert threshold at{ causes an alarm to be generated after observing two anomalous scans within two time intervals (i.e. 2 minutes). With{ , 22 false positives resulted over the two-week period. For contrast, for{
X
(the value automatically selected by the proto-type, see Section 2.2), only 5 false positives resulted over the two-week period. For use in an automated response system, the occurrence of 5 false positives within a two-week period may be too great. In our test network, as we
increased{ , the number of false positives decreased. If we manually set{
Y
only 1 false positive from all devices is generated within a two-week period.
4.1.2 Approach 2: Function-Specific Thresholds
One method to refine our approach is to use different alert thresholds, for different categories of devices based on the system function (not currently implemented by our proto-type). For instance, we observed that most servers (with one exception) have a higher ARP chain counts than work-stations. Additionally, two servers have the two highest observed per minute ARP request counts during the train-ing period (servers 192.168.1.11 and 192.168.1.12, see Table 1). Not surprisingly, a server must be able to han-dle bursts of requests from other network devices. How-ever, legitimate bursts in ARP request activity may cause the 5 factor to exceed its alert threshold causing false positives. All 5 false positives generated at the {!
X
threshold were caused by the two servers with the highest per-minute ARP request count. We refer to distinguishing of devices within the network cell to allow differing alert thresholds based on the function of a device (e.g. server or workstation) as thefunction-specific thresholdsapproach. We could allow the workstations alarm threshold to be set at{]
X
reducing their false positive rate to zero (i.e. for our test network). Increasing the server alarm threshold to{_MP reduced not only their false positive rate but the overall false positive rate for the two-week period to 2.
Varying alarm thresholds could be extended to other classes of systems within the network cell if required, depending on the nature of applications running on the network. An example would be relaxing { on devices that use distributed or P2P applications. We expect that these devices would repeatedly initiate a greater number of connections (ARP requests) than other devices during the sampling intervals. This increased activity would typ-ically give these devices larger mean and standard devia-tion scores causing higher)
values. Devices with larger ); values will require the observation of more ARP re-quests than less active devices (i.e. lower)*) before{ will be met or exceeded. In this scenario, the ability to as-sign differing{ values to devices with similar)* would minimize both false positives and negatives. However, as { increases so does the number of worm scans before an alarm is generated.
4.2 Simulating Scanning Worm Activity
To simulate scanning worm propagation within a net-work cell we used the port scan option of the Nmap secu-rity scanner. Just like a worm, the kernel and networking components of the workstation performing Nmap scans use ARP in order to make contact with the devices within
Table 2. Alarm Threshold Analysis Alerts
Threshold{ Server Workstation Total
1 scan 37 62 99 2 scans 19 3 22 3 scans 5 0 5 4 scans 3 0 3 5 scans 2 0 2 6 scans 1 0 1
Anomalous Connection Activity
Server Workstation Total Outside ARP chain 181 36 217
Dark space 0 0 0
the network cell. We configured Nmap to scan a single port (port 80) on all the devices within the network cell. Ignoring the two broadcast addresses left 61 usable IP ad-dresses. These port scans simulated a scanning worm try-ing to find versions of vulnerable HTTP servers within the network cell. The device we used to scan the network cell was a workstation that had the highest ARP chain count (192.168.1.26 had 11 ARP chain entries; see Table 1). We set our alert threshold to {3
X
. Based on Section 4.1.2, this was the minimum threshold that incurred no false positives from workstations during testing and it was also the value automatically selected by our prototype. To fully exercise our detection software, Nmap was run in two modes, each with two types of scanning strategies as follows.
The first two tests consisted of scanning port 80 on ev-ery device within the network cell using Nmap’snormal mode(scanning the network as quickly as possible) em-ploying both the sequential and random scanning strate-gies. The last two tests consisted of scanning port 80 on every system within the network cell usingsneaky mode
(waiting 15 seconds between scans in an effort to become stealthy) employing both the sequential and random scan-ning strategies.
Table 3. Network ARP Statistics Number of Scans Before Detection
Normal Sneaky
Sequential 2 2
Random 1 3
4.2.1 Worm Simulation Results
Nmap Sequential Scanning Strategy. The sequential
scans for both normal and sneaky mode were detected within two port scans (see Table 3). Nmap was
config-ured to sequentially scan the host range from 192.168.1.1 until 192.168.1.62 (thus omitting network broadcast ad-dresses). 192.168.1.2 was the target of the second scan in both sequential scans. IP address 192.168.1.2 was as-signed to a network switch and does not appear within the peer list and therefore is considered internal network dark space. In these cases, sequential scanning detection was triggered by the c 5q factor within the aggregate anomaly score for the system.
Nmap Random Scanning Strategy. In normal mode,
the random scan was detected within one scan. Of the 61 usable addresses within the network, the total peer list size of servers and workstations was only 21 (i.e. approx-imately 66% of our network was defined during the train-ing period to be internal network dark space). The first random scan in normal mode was to an internal network dark space. Again, theZc factor dominated the aggregate anomaly score and caused an alarm to be generated after the first scan.
In sneaky mode, the random scan was detected within three scans. In this case, although statistically improba-ble, no internal dark space addresses were scanned. The 5 5q factor became the dominant factor and triggered af-ter detecting three ARP requests above)* for the device within a three minute period. However, it is statistically probable (see Section 4.2.2) that subsequent tests using the same parameters would be detected by the c factor before three scans.
4.2.2 The Affect of Dark Space on Sequential and Random Scanning Detection
Overall, our detection testbed implementation benefited from the sparse internal IP addressing scheme within the network cell. Internal network dark space comprised ap-proximately 66% of the network cell’s useable IP ad-dresses. If is the probability that a random scan will be to internal network dark space thenL*9 is the prob-ability that a random scan will not be to internal network dark space (e.g. 0.3387). Random scans are independent events. The probability that the
c
factor will trigger causing an alarm after the occurrence of three random scans isLw9FLw9xe4Lw93N XOX aJQ c H NR Y LOL .
The large amount of internal network dark space also aided our prototype in detecting sequential scanning. Topological worms typically harvest network configura-tion informaconfigura-tion from their victims for new targets [18]. In our testbed, any sequential scanning strategy that started from the lowest IP value within a device’s network subnet configuration value (i.e. 192.168.1.1) would be detected within the second scan (see Section 4.2.1).
4.3 Discussion of False Positives and Negatives
The following two sections discuss the impact and causes of false positives and negatives on our detection technique. Since the analysis is valid for both the common threshold and function specific thresholds approaches, we discuss only the specific results of the approach with the greatest number of false positives (i.e. common threshold approach).
4.3.1 False Positives
All five false positives which arose when the alert thresh-old was set to{]
X
(triggering at{ or more scans) were caused by servers, and specifically by bursts in server ac-tivity. A typical scenario for normal network activity in-volves users logging onto their workstations and request-ing network services (e.g. DNS, mail, etc.) that allow them to execute desired tasks. As a workstation gener-ates an ARP request to determine the MAC address of the server, the server also typically generates ARP requests to determine the MAC address of other servers that as-sist them in performing their tasks. When a number of users access services simultaneously, this will cause a burst in ARP requests from the servers. The two most active servers (i.e. 192.168.1.11 and 192.168.1.12) in our testbed have the highest observed maximum ARP requests in the sampling interval. ARP request bursts caused by servers answering legitimate service requests can produce false positives. The occurrence of false positives could be reduced by raising{ . However, each increment of{ allows another scanning worm infection attempt to occur before an alarm is raised.
Automated attack and scanning tools share the same searching strategies as scanning worms. These tools can perform random or sequential scanning at differing speeds to either exploit or identify vulnerable systems. Our ARP-based detection technique discovers intra-cell scans caused by such tools (e.g. if the minimum sustained scan-ning rate exceeds one scan per minute), but does not dis-tinguish them from scans resulting from a scanning worm.
4.3.2 False Negatives
A false negative occurs when malicious activity occurs without triggering an alarm. In this section, we discuss the affect of ARP caches and large ARP chains on possi-ble false negatives for our detection technique.
ARP Cache.If a device happens to have the MAC ad-dress of the device it wants to communicate with within its local cache, no ARP request is generated. For this rea-son, typical scanning worms exploit an infected device’s local ARP cache just as any legitimate network applica-tion would. However, our prototype is network-based and
does not have access to the local ARP caches of the de-vices within the network cell. For this reason, with respect to theJ5 factor, this activity is not reflected within the/ activity count.
However, our calculation of) (see equation (1), Sec-tion 2.2.1) does offer some insight on the affect of ARP caches. For example, system 192.168.1.30 (statistically the most active workstation in Table 2) has:^LONQWST66Q and ( H N Y QST6.R , making ) c & X N H
Q.WaOP . This rep-resents the maximumexpectednumber of ARP requests a device can make within a one minute period without caus-ing a positive c
& score. Recall (see Section 3.2) that the default ttl for the entries within the ARP caches of the de-vices in our network cell is 60 seconds, which matches our
5
sampling interval. ARP replies (i.e. MAC and IP address pairs) are cached locally on the devices that gen-erated the associated ARP requests.
According to ) , we expect that three is a reasonable upper bound for the number of entries within this device’s ARP cache. If a scanning worm happened to select any of the IP addresses within the cache, no network ARP re-quest would be sent and our prototype would not detect the scan (i.e. /* would not be incremented by 1). ARP caches can be a source of false negatives. However, in our calculations of and( for each device, we ignored the af-fect of long periods of inactivity. This was done to better approximate the ARP request activity during active usage (i.e. ignoring user and system inactivity) to ensure that our false positive rates would be minimized for this factor.)0 represents a reasonable upper bound to the number of en-tries within the respective local ARP caches. In practice, the ARP caches will typically contain fewer entries than the) values for each system since by design,) exceeds the corresponding mean value. Therefore, we expect that ARP caches have a minimal affect on factor 5 .
Additionally, the 5 factor is not applied in isolation. In order to avoid any anomaly score contribution from the remaining two anomaly score factors (i.e.z and c ) all these scans would have to be limited to the device’s ARP chain. The probability of detection avoidance through limiting scans to the respective ARP chain is discussed in the next section.
Large ARP Chain. We use ARP chains to character-ize normal network interactions. A system with a large ARP chain will be able to connect to the devices within the chain without contributing to the
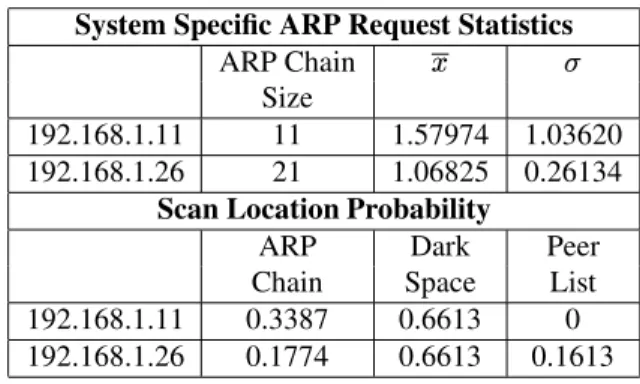
factor. The largest ARP chain in our testbed belonged to the server 192.168.1.11 with 21 entries. The largest workstation ARP chain belongs to 192.168.1.26 with 11 entries. Ta-ble 4 shows the probabilities of the two systems scanning within their respective ARP chains, internal network dark space, and their peer lists.
As discussed in Section 4.2.1, internal network dark
Table 4. Anomaly Factor Triggering Proba-bilities in Testbed
System Specific ARP Request Statistics
ARP Chain (
Size
192.168.1.11 11 1.57974 1.03620 192.168.1.26 21 1.06825 0.26134
Scan Location Probability
ARP Dark Peer
Chain Space List 192.168.1.11 0.3387 0.6613 0 192.168.1.26 0.1774 0.6613 0.1613 space dominates the overall scanning possibilities for worms within our testbed network cell. Even the de-vice with the largest ARP chain (192.168.1.11) had only a 0.3387 probability of selecting an IP address within its ARP chain. During a random scan, the chance of 3 suc-cessive scans all targeting IP addresses in the ARP chain is approximatelyL94 c H N XWX aJQ c H N HOX
aOaOP (see Sec-tion 4.2.2). If a sequential scanning strategy was used, the probability that 3 successive scans would all be to devices within an ARP chain would depend on the IP address composition of the ARP chain. Using our network as a practical example, a sequential scan from 192.168.1.11 would deviate from its ARP chain on the second scan (see Section 4.2.1) and be detected by z and
c
q . Re-gardless, if a scanning worm managed to only scan IP ad-dresses within the device’s ARP chain, it would have to do so with a sustained scanning rate of less than 1 scan per minute or it would be detected byZ5 q. Therefore, the ap-plication ofJ5 ensures large ARP chains have a minimal affect on the detection technique.
5 Limitations
Limitations. Our detection technique cannot detect L2L inter-cell, R2L and L2R worm propagation (see Sec-tion 2.1). It would be useful as a complementary tech-nique used in conjunction with other approaches, e.g. [20] to detect L2L intra-cell scanning worm propagation. Fur-thermore, our approach relies solely on the observation of ARP requests. We do not try to match the associated ARP replies to determine if the subject of the ARP re-quests are actually active on the network. In the event that a system broadcasts an ARP request to a device currently not active on the network (e.g. powered down or discon-nected from the network) due to scheduled maintenance or some unscheduled failure, this will not be considered a scan to internal network dark space as long as its address was observed during the training period. In this scenario,
the amount of internal network dark space would be un-derstated as inactive devices would be consideredlive. If we extended our approach to correlate ARP requests and replies we could determine which devices are live or actu-ally internal network dark space.
ARP request and reply correlation would also address another potential limitation that arises in networks that use the Dynamic Host Configuration Protocol (DHCP) [5]. DHCP allows network devices to determine their IP addresses from a central server rather than from a static configuration file. When a device becomes active on the network, it contacts its DHCP server to retrieve an IP ad-dress that it can use on the network. The MAC adad-dress of the requesting device is then associated with an IP ad-dress assigned by the DHCP server. DHCP-assigned IP addresses areleasedto the devices that request them. A DHCP lease is the amount of time that the DHCP server grants permission for a device to use a particular IP dress. The devices in our test network used static IP ad-dresses and thus the MAC and IP pairing was constant. In a DHCP-enabled network, the MAC address and IP pair-ing is not guaranteed to be constant (e.g. when the lease expires a device may receive a different IP address and thus the IP address MAC pairing is different). Our proto-type uses IP addresses to identify devices and thus would be adversely affected by allowing a device to have differ-ent IP addresses. ARP request and reply correlation would enable us to use the MAC addresses (which are fixed and never change) of devices for identification which DHCP has no affect on.
Another limitation is that network dark space addresses are determined by observing ARP requests on the network and building a peer list (see Section 2.1.1). Once the train-ing period is completed, in our description thus far there is no mechanism to add to the peer list or determine if previ-ously active devices have been taken off the network. This may provide an inaccurate accounting of internal network dark space. To address this limitation, we could correlate ARP requests and replies to determine the emergence of new devices. Currently, if we observe an ARP request to an IP address outside the peer list an alarm is generated. If we modified our approach to consider ARP replies, we could dynamically determine internal network dark space. In a P2P or distributed computing environment, network devices may interact with a large number of other devices. The ARP chains for the devices could be quite large and homogeneous. In this scenario, the
factor would be affected as a device could interact with a large percent-age of the network cell and still remain within its ARP chain. Furthermore, if the device was involved in per-forming tasks that required frequent interaction with mul-tiple devices over long periods of time its and( would be large. This would require our prototype to observe a
greater number of worm scans before the
5 factor would trigger.
Attempted Circumvention. A possible worm
infec-tion strategy would be to only perform infecinfec-tion attempts after the device had initiated a connection through legit-imate use. In this scenario, a scanning attempt could be initiated when the IP address is in the local cache thus obviating the need for an ARP request. A slight modi-fication to this strategy would be for the worm to install itself on a host and monitor ARP request activity before propagation. Worm propagation could then be restricted to those devices that were the subject of ARP requests. In these scenarios, the and c factors would not be af-fected by this activity. However, once propagation begins the worm’s sustained scanning rate would still trigger an alert by J5 unless the scanning rate was less than 1 scan per minute.
6 Suppression and Containment Extensions
To suppress and contain scanning worms within a net-work cell apparently requires that one employ an auto-mated active response. Two scanning worm containment strategies are: (1) stop the scans as they traverse the net-work before they reach their intended victims; and (2) stop the scans before they leave the infected host. The first strategy could be achieved through integrating a con-tainment capability directly into the network fabric (e.g. switches). The second strategy could be achieved through integrating a containment capability on each host itself. We believe that our ARP-based detection technique could be used in either strategy to enable automatic containment. Each strategy has its benefits and limitations; we discuss these in turn.
6.1 Integration into Network Fabric
A network switch provides a channel for incoming data from any one of its input ports to a specific output port that connects a device to the network. Most network switches have the capability to maintain statistics on the type and amount of network data passing through its ports. We be-lieve our ARP-based technique could be integrated into switches to allow for monitoring of ARP activity on all the devices they connect to the network. Switch integra-tion would enable us to address a current limitaintegra-tion of our approach by allowing ARP requests and replies to be cor-related (see Section 5). ARP replies are not broadcast and must be observed at each individual device at which they are received or on the switches that forward them. Integra-tion of our detecIntegra-tion technique into the switching fabric would enable us to perform a more complex correlation for better detection and better provide the ability to take active response. For instance, if worm activity was de-tected on a specific port, a switch could simply turn the
port off isolating the device connected to that port from the rest of the network.
A network-based detection approach such as this does have some advantages over a host-based approach. A network-based device can be hardened against attack and is typically administered by security conscious personnel. In a host-based detection approach, the host is the subject of the attack and there is a risk that a successful attack may include turning detection software off or instructing it to not alarm. Furthermore, administration and reporting of alarms is typically easier in network-based detection approaches as fewer devices need to be maintained and monitored.
6.2 Host-based Worm Containment
The success or failure of a worm infection is more eas-ily determined at the host than at the network layer. In a network-based approach, one may see an attack go by without knowing if it succeeded, unless one observes sub-sequent anomalous activity (i.e. attacks) from the sus-pected victim. Our ARP-based technique could be inte-grated into a host’s networking software or hardware to enable containment. As in Section 6.1, a host-based in-tegration would also enable us to address a current lim-itation of our approach by allowing us to correlate ARP requests and ARP replies (see Section 5). ARP replies re-ceived at the individual host would enable us to perform a more complex ARP correlation for better detection ac-curacy. Again, as in Section 6.1, a host-based approach would also give us the capability of an active response on the intended victim. For instance, if worm activity is de-tected on the individual host, the host could remove itself from the network by not forwarding or receiving data.
7 Related Work
The ARP protocol has been the subject of so-calledARP
cache poisoningattacks [10], in which a device’s ARP
cache is updated with forged ARP request and reply pack-ets in an effort to change the MAC address of the device to one in which an attacker can monitor or perform a denial of service attack. Other than the involvement of ARP, our work is unrelated to ARP cache poisoning.
A host-based solution to the scanning worm problem was discussed by Williamson [21]. His approach is to limit or throttle the rate of malicious code at the host by determining if a system is trying to connect to new ad-dresses. If so, the connection is delayed in order to de-lay malicious code propagation. The decision to dede-lay and not drop suspicious connections reduces the impact of false alarms while still limiting the spread of malicious activity in the network. Granger et al. [8] developed a software architecture to enable self-securing network in-terfaces. Packets are examined as they are processed by
host software where malicious activity can be detected and potentially blocked.
A variety of network-based solutions to the scanning problem exist including Silicon Defense’s CounterMal-ice[4] which is a worm defense solution that proactively identifies and automatically blocks worm activity within a network. The solution partitions the network in cells and prevents worms from spreading between the cells.
Jung et al. [9] developed an algorithm called Threshold Random Walk (TRW), to identify malicious remote hosts, based on the observation that scanners are more likely to attempt to access hosts and services that do not exist than legitimate remote hosts. If the connection is determined to succeed the random walk is driven upward; failure to succeed drives the random walk down. By giving legiti-mate network traffic a higher probability to succeed than attack traffic, a determination can be made on whether a series of connection attempts is a scan.
Weaver et al. [19] developed a scan detection and sup-pression algorithm based on a simplification of TRW. They use caches to track the activity of both new connec-tions and IP addresses to reduce the random walk calcu-lation, making the algorithm suitable for implementation in both hardware and software. Their technique allows a scanning host to be detected and stopped in fewer than 10 scans with a low false positive rate.
Zou et al. [22] model requirements for the dynamic quarantine of infected hosts. They demonstrate that epi-demic thresholds exist for differing detection and response times. This work provides a benchmark that any new pro-posed detection algorithm could use to measure its effi-ciency.
Singh et al. [17] propose a method to automatically de-tect worm propagation based on network traffic charac-teristics such as highly repetitive packet content, and IP source and destination address distributions. They have shown that this method has the ability, with no human in-tervention, to generate worm content signatures with a low false positive rate.
Two commercial scanning detectors offer an alternate approach to detect worm propagation. Forescout [1] and Mirage [2] networks use a technique calleddark-address detection. These detectors either have knowledge of, or route unoccupied address spaces within an internal net-work and detect when systems attempt to connect to these unused spaces.
8 Concluding Remarks
The main objectives of this paper have been to describe our ARP-based anomaly detection approach, and confirm that the general idea works. To do so, we implemented the approach in a prototype and tested it in a small lab envi-ronment (nonetheless with a reasonable amount of normal
network traffic). Obviously tests in larger and more di-verse networks are required to fully exercise the approach; however, we believe our testbed was sufficient in estab-lishing the practical viability of this approach, given that it is designed to be deployed in a singlecell. Furthermore, regarding the scalability of the approach, our prototype has been used to successfully conduct preliminary tests on a much larger cell of 591 network devices giving us some reassurance. While we made specific recommenda-tions on the anomaly score parameters and settings, these were based on our network topology. Different network environments will most likely require different parameter settings that can be determined during the training period. The minimum sustained scanning rate constraint of one scan per minute was a limitation of our prototype and not the overall approach. The same approach could be used to detect worms that scan beneath this threshold at the expense of more memory and poorer results in terms of accuracy and false positives. The amount of internal network dark space in our testbed significantly influenced (positively) the performance of the detection technique. In the full version of this paper, a more rigorous analysis of the affect of internal dark space will be undertaken.
Our detection system is anomaly-based and therefore has the ability to detect emerging worms. The proto-type automatically calculates the required individual de-vice statistics and can determine an appropriate network-specific alert threshold ({ ). We have developed a full im-plementation of our ARP-based approach in a software prototype that runs on commodity hardware. We plan to make this software available to the public.
Acknowledgements
We thank John Ioannidis, Carleton University’s Dig-ital Security Group, and the anonymous reviewers for comments which significantly improved this paper. The second author is the Canada Research Chair in Network and Software Security, and is supported in part by an NSERC Discovery Grant, the Canada Research Chairs Program, and MITACS. The third author is supported in part by NSERC (Natural Sciences and Engineering Re-search Council of Canada) and MITACS (Mathematics of Information Technology and Complex Systems) grants.
References
[1] Forescout. Wormscout. http://www.forescout.com/ wormscout.html.
[2] Mirage Networks. http://www.miragenetworks.com. [3] tcpdump/libpcap public repository. http://
www.tcpdump.org.
[4] Silicon Defense. Worm containment in the internal network. Technical report, 2003.
[5] R. Droms. Dynamic Host Resolution Protocol. RFC, March 1997. http://www.ietf.org/rfc/rfc2131.txt? number=2131; accessed on January 24, 2005. [6] D. Ellis, J. Aiken, K. Attwood, and S. Tenaglia. A
behavioral approach to worm detection. In
Proceed-ings of The Workshop on Rapid Malcode, 2003.
[7] Fyodor. Remote OS detection via TCP/IP stack fin-gerprinting.Phrack, 54, December 1998.
[8] G. Granger, G. Economou, and S. Bielski. Self-securing network interfaces: What, why and how. Technical report, Carnegie Mellon University, CMU-CS-02-144, May 2002.
[9] J. Jung, V. Paxson, A. Berger, and H. Balakrishman. Fast portscan detection using sequential hypothesis testing. InIEEE Symposium on Security and Pri-vacy, 2004.
[10] S. Manwani. ARP cache poisoning prevention and detection. Technical report, Faculty of Computer Science, San Jose State University, December 2003. [11] D. Moore, V. Paxson, S. Savage, C. Shannon, S. Staniford, and N. Weaver. Inside the Slammer Worm. In IEEE Security and Privacy Magazine, pages 33–39, July/August 2003.
[12] D. Moore, C. Shannon, G. Voelker, and S. Sav-age. Internet quarantine: Requirements for contain-ing self-propagatcontain-ing code. InProc. of the 2003 IEEE Infocom Conference, San Francisco, CA, April 2003. [13] R. Pethia. Attacks on the Internet 2003. Congres-sional Testimony, Subcommittee on Telecommunica-tions and the Internet, November 2003.
[14] D. Plummer. An Ethernet Address Res-olution Protocol. RFC, November 1982. http://www.ietf.org/rfc/rfc0826.txt?number= 826; accessed on January 24, 2005.
[15] Y. Rekhter, B. Moskowitz, D. Karrenberg, G. J. de Groot, and E. Lear. Address Allocation for Pri-vate Internets. http://www.ietf.org/rfc/rfc1918.txt; accessed on Jan 12, 2005.
[16] M. Roesch. Snort - lightweight intrusion detection for networks. InLISA, 1999.
[17] S. Singh, C. Estan, G. Varghese, and S. Savage. Automated worm fingerprinting. InACM/USENIX Symposium on Operating System Design and Imple-mentation, Dec. 2004.
[18] N. Weaver, V. Paxson, S. Staniford, and R. Cunning-ham. A taxonomy of computer worms. InThe First
ACM Workshop on Rapid Malcode, Oct. 2003.
[19] N. Weaver, S. Staniford, and V. Paxson. Very fast containment of scanning worms. InProceedings of
the 13th USENIX Security Symposium, 2004.
[20] D. Whyte, E. Kranakis, and P. van Oorschot. DNS-based detection of scanning worms in an enterprise network. InProc. of the 12th Annual Network and
Distributed System Security Symposium, Feb. 2005.
[21] M. Williamson. Throttling viruses: Restricting prop-agation to defeat malicious mobile code. InAnnual
Computer Security Applications Conference, 2002.
[22] C. Zou, L. Gao, W. Gong, and D. Towsley. Moni-toring and early warning for Internet worms. In Pro-ceedings of the 10th ACM Conference on Computer