7424
WORKING HOLIDAY IN AUSTRALIA: A SOCIAL-DATA
BASED STUDY ON THE CORRELATION BETWEEN
PARTICIPANTS’ PERCEPTION AND PARTICIPATION
CHANGE
1JUN IL BANG, 2DEOK JOO LEE, 3ABIDA SULTANA, 4KYUNG JIN CHA, 5*HWA JONG KIM
1Department of Computer Information and Communication Engineering, Kangwon National University,
Chuncheon-si, Gangwon-do, 24341 Republic of Korea
2Department of Business Administration, Kangwon National University, Chuncheon-si, Gangwon-do,
24341 Republic of Korea
E-mail: 1[email protected], 2[email protected], 3[email protected], 4[email protected], 5[email protected]
ABSTRACT
The main purpose of the study is to understand the relationship between people’s perception and participation regarding a future event. The analysis was performed to investigate whether the participation in Australian working holiday program changes due to the change in the perception of the people of Korea. In the research, we utilized time series statistical data and a set of sentiment data collected from a social platform. We used the number of Korean people who entered and exited Australia during the last 10 years and sentiment data from two social blogs, called cafes: 'I Love Australia' and 'Hoggoksung', having registered members of 150,500 and 110,127, respectively. The total numbers of posts were 169,827 and 196,217, respectively. In was found that the change in perception has strong impacts on the number of people participating in the program. We also found that the sentiment data-based prediction is much more effective than the simple numerical data-based prediction.
Keywords: Big Data, Working Holiday, perception, Sentiment analysis, Australia.
1. INTRODUCTION
The rapid growth of Information Technology (IT), including cloud computing, Internet of Things (IoT), artificial intelligence (AI) is changing every aspect of life and industry. The modern world is witnessing a massive explosion of diverse datasets referred to as ‘big data’ [1]. Unlike the traditional ‘small’ data, big data typically includes masses of unstructured data that needs critical analysis to get insights or useful information from the data [2]. Nowadays, many sophisticated techniques are introduced and used to analyze these big data for classification, prediction, and description of events more accurately and timely [3]. The recent breakthrough in the improvement of hardware performance allows the researchers to overcome the ‘time factor’ which has been one of the biggest obstacles to big data analysis. For example, improvement of the Graphics Processing Unit (GPU) allows the massively parallel processing of data. Therefore, the time required for analysis and processing big data has been reduced from days to
minutes [4]. This development of capability in
processing and analyzing big data made the machine learning technology practically applicable to many problems [3].
7425 The main purpose of the study is to understand the relationship between people’s perception and participation to a future event. The analysis was performed to investigate whether the participation in Australian working holiday program changes due to the change in the perception of the people of Korea, one of the major participant countries. In the present research, we utilized time series statistical data and a set of sentiment data collected from a social platform. In contrast to previous studies where mostly one kind of dataset was used[6, 7], we used the arrival and departure records of Koreans who entered Australia for spending their working holiday there. Based on the data we predicted the number of future working holiday travelers in Australia. In addition, we collected data from two Korean famous social blogs in ‘Naver Café’ relating to Australia namely ‘I love Australia’ and ‘Hoggoksung’. We used the keyword ‘Working Holiday’ and ‘Wohol’ in web crawler for sentiment analysis. By performing sentiment analysis, we examined whether the social data-based prediction provides more effective results than the simple numerical data-based prediction.
2. LITERATURE REVIEW
Prediction of tourism demand has critical economic consequences [8, 9], it enables tourist authorities and decision makers in the hospitality industries to formulate strategic planning [10, 11], therefore, tourism industries must forecast tourism demand accurately. While tourism demand is usually measured by tourist arrivals at a given destination, followed by tourist expenditure [12], no single model can provide the best tourism forecasts for any of the countries in the short, medium and long-run [13].
In search of accuracy, prediction models, single-equation or combined [10] are still continuously being proposed which range from time-series models to econometric models to modern artificial intelligence techniques [11, 14, 15]. For example, Hassani et al. used Singular Spectrum Analysis (SSA) for forecasting US tourist arrivals whereas Pai et al. proposed a combined FCM+LLS-SVRGA model and studied six other forecasting models in order to demonstrate its superiority over all [11, 16]. Furthermore, using monthly tourists’ arrival data from the Australia Bureau of Statistics (ABS), Ma et al. forecasted Chinese tourists’ arrival to Australia through time-series analysis with Autoregressive-integrated Moving Average (ARIMA) models [10].
Complementary to these, Lin et al. forecasted inbound visitors to Taiwan using three generally adopted forecasting models- conventional ARIMA, Artificial Neural Networks (ANNs) and Multivariate Adaptive Regression Splines (MARS) [17]. Lin et al. showed that on several bases ARIMA outperformed the other two as opposed to Cho who confirmed the superiority of ANN models through the empirical evidence against ARIMA and exponential smoothing models [17-20]. In Addition, Nor et al. studied the comparative performance of the neural network and two classical time series forecasting methods to prove its reliability in forecasting price data [21].
On the other hand, Linares et al. employed sentiment analysis to predict the influx of tourist to Peru utilizing Twitter data [22]. Text sentiment analysis based on the data from social network sites such as Twitter, Facebook, Online forums, and blogs has been extensively studied on different perspectives [23] due to their evident representativeness. Chong et al. for instance, conducted sentiment analysis of online reviews to predict product sales [24]. Therefore, we posit people sentiment of a certain region toward a destination is more precise and accurate predictor of future tourists than the time series data alone.
Regarding Artificial neural network (ANN), it is beneficial in time series forecasting due to its data-driven approach which can be trained up to chart past values of a time series [21]. We argue that because of the nature of the data, tourism demand, where human-made changes are not possible, ANN is less likely to accurately forecast tourist traffic to a destination. We rather propose to consider a fusion analysis combining both sentiment data and numeric time series data for more accurate tourism demand prediction.
7426 maker’s expenditure is $10000 per trip while a general youth traveler spends $7700 during their stay in Australia which implies substantial contributions to the tourism and hospitality industry of the country.
The main purpose of Working Holiday Maker (WHM) visa program, as mentioned in the Working Holiday Maker Visa Program Report, June 2016, is to foster closer ties and cultural exchange between Australia and partner countries. Initiating in 1975, the program has been expanded to incorporate more countries which subsequently has increased the number of working holiday travelers over the years [26]. Considering the importance of working holidaymakers, a number of studies funded by the Australian government have been carried out on this particular group of travelers alone [27]. Therefore, studying working holiday travelers’ pattern to accurately predict future working holiday maker’s arrival in Australia is undoubtedly important and vibrant.
3. DATA COLLECTION AND PREPROCESSING
The ‘Python’ programming language was used to process the data for our study; ‘Python’ is an interpreted language which is different from ‘Java, or ‘C’. However, it was selected because of its suitability to use the visualization and analytical tool. In addition, it can verify the result of source code execution immediately in the development environment. Here, the ‘Pandas module data frame’ was used for data processing and then data were visualized by using ‘Matplotlib and Plotly’. The algorithms and sentiment analysis that were used in this study have been discussed in detail in the next chapter.
3.1 Numerical data
The numerical data that is the entry and exit records of Koreans participating in Working Holiday program in Australia was collected from the Overseas Arrivals and Departures (OAD) database of Australian Bureau of Statistics (ABS) [28]. The OAD database is essentially a combination of historical OAD data and information about travelers for the relevant reference months from the Department of Immigration and Border Protection’s (DIBP) traveler processing system. The data presented in the Excel file format includes the entrance and departure information of foreign nationals staying in Australia for different periods of time, and the
data can be customized using filters such as country of citizenship, age, gender as well as the predominant reasons for travel. In this study, only the data about the number of Koreans who visited Australia for the purpose of employment were used for analysis.
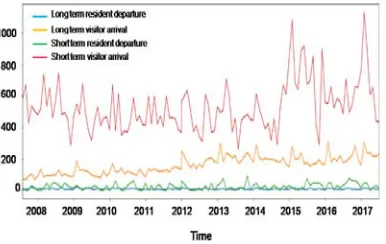
Here, we downloaded 10 files from July 2007 to June 2017 using Pandas Data Frame, a powerful data processing module in python and integrated them into one file for handling convenience. Table 1 shows the entries and exits of first five months of the selected time frame which includes resident departure as well as visitor arrival in Australia both for long-term and short-term.
Table 1: Monthly Sum of Movement by Category of Traveler
Time Long-term resident departure Long-term visitor arrival Short-term resident departure Short-term visitor arrival 2007-07-31
5 69 15 579
2007-08-31 7 68 0 670
2007-09-30
8 88 0 426
2007-10-31
20 103 30 535
2007-11-30 8 68 15 502
3.2 Social Data
7427
Figure 1. Sample Article Posted In Naver Café
Search keywords are required for extracting the information using web crawler. Here, we used two keywords ('Working Holiday' and 'Wohol') for extracting the information from the 'I Love Australia' and 'Hoggoksung' Naver Cafes. Unlike the ‘Naver blog’, ‘Naver café’ does not display all of the results on one page; instead, it returns to the title of the posts through keyword search as a hyperlink. Therefore, after storing the addresses of the first link in the python list, the code for crawling the addresses of the posts stored in the list was repeated one by one using the loop, and thus collecting our required data. For analysis purpose the title, content, and date of the respective posts were extracted as .txt files and constructed the document in list form using the text. The top five data that have undergone these preprocessing steps are shown in Figure 2.
Figure 2. Top Five Pre-Processed Data (Posts) Crawled And Documented From The Café.
4. NUMERICAL DATA ANALYSIS
The numerical data used for the analysis was the number of Korean people who entered and exited Australia during the last 10 years using the employment visa as described above, and there were a total of 121 months from July 2007 to June 2017.
[image:4.612.318.511.352.474.2]Based on these data we used two machine learning algorithms in order to predict the number of people who will potentially leave for working holiday program in Australia in the future. At first, we have visualized the numerical data after the preprocessing steps for easier analysis. As shown in Figure 3, the basic numerical data without an empirical test are used for basic visualization and prediction. X-axis shows the year and y-axis shows the number of arrived and departed Korean traveler. Different colored lines indicate short-term and long-term categorized entries and exits over the determined time period.
Figure 3. Overseas Arrival And Departure Data From July 2007 To June 2017.
4.1 Algorithm for Prediction
Machine learning is a type of artificial intelligence that allows a computer to learn and predict based on a given algorithm. There are myriads of learning algorithms, and the usage of which depend on the type of data set desired to be analyzed. For example, we analyzed and predicted the time series data by selecting algorithms of artificial neural network model namely Multilayer Perceptron and Stacked Circular Neural Network; the details description of the algorithm is as follows:
4.1.1 Multilayer Perceptron
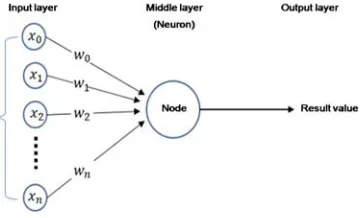
7428 nonlinear activation function. MLP utilizes a supervised learning technique called backpropagation training [29]. Its multiple layers and non-linear activation distinguish MLP from a linear perceptron. It can distinguish data that is not linearly separable [30]. Multilayer perceptron is sometimes colloquially referred to as "vanilla" neural networks, especially when they have a single hidden layer [31]. In this algorithm the predicted values are calculated by substituting learning data into functions arbitrarily set by the user. The functions have weights (w) as the variable to be assigned, that is, the number of learning data to be input.
[image:5.612.101.281.464.573.2]A function that calculates the product of input values and weights is called a net input function, while, a function that compares the result of a net input function with a specific threshold for prediction and provides the calculated predicted value is called an active function. If the predicted value is different from the test data by using these two functions, weights are adjusted and the final value is presented as a predicted value. In a single layer perceptron, as shown in Figure 4, the function part that responsible for these calculations is called a node or neuron, and is located in the middle layer of the algorithm. Therefore, it forms an artificial neural network that computes the result using one or more nodes, and helps to comprehend the phenomena in a better way [32].
Figure-4: Single Layer Perceptron
In case of single layer perceptron algorithm, where the input layer and the output layer exist only as a single layer perceptron, it is possible to learn about the AND operation, but it is impossible to properly learn about nonlinear data. Hence, the MLP algorithm has been developed to compensate this disadvantage of single layer perceptron algorithm. This algorithm allows for in-depth learning by having several hidden layers and calculating several output values of the output
layer. Thus, this is also classified as a deep learning algorithm [33].
4.1.2 Stacked Circular Neural Network
Stacked Neural Networks model is a model of the application of the Recurrent Neural Network (RNN), and basically follows the operation of the circular neural network model. Unlike feed forward neural networks, RNNs can use their internal memory to process arbitrary sequences of inputs. This makes them applicable to tasks such as unsegmented and connected handwriting recognition [34] speech recognition [35]. Therefore, RNN becomes an excellent performance model for solving natural language processing problems. In addition, we also used Long Short-Term Memory (LSTM) algorithm which is the most widely used algorithm in RNN. LSTM prevents back propagated errors from vanishing and exploding [36]. Like the basic RNN, it affects the output value through hidden variables. However, before computing the hidden variables, we have to determine whether to keep it in memory when moving to the next step [37].
The stacked circular neural network model used in this paper is composed of stacked layers of state-preserving circular neural network models. In this case, the layer at the upper part of the stack improves the performance by influencing the input of the existing layer. In other words, it is possible to obtain better prediction results because it constructs another iterative model with the input of repetitive model as new input. This algorithm is also a deep learning algorithm.
4.2 Visualization And Forecasting
Figure 5 shows the number of outbound travelers from Australia for the period between July 2007 and June 2017 along with the prediction for the last two years. The prediction is done using the 'multilayer Perceptron' model (Fig. 5a) and the 'Stacked Circular Neural Network Model' (Fig 5b). The time (Year) and the number of outbound travelers normalized from 0 to 1 are presented in the x-axis and y-axis, respectively.
7429
Figure 5. Numbers Of Past And Predicted Outbound Travelers From Australia.
As shown in Figure 5, there is almost no significant change in the outbound traveler’s movement, even though the line graphs show a recurring trend. This data indicates that there will be no big change in the number of departing
residents within the predicted time-frame. However, this prediction is not reliable because the predicted graphs do not show many similarities with the existing dataset.
Figure 6. Number Of Past And Predicted Inbound Travelers Into Australia.
Similarly, the Figure-6depicts the number
[image:6.612.107.503.448.663.2]7430 predictions using multilayer perceptron model (Fig. 6a) as well as the predictions using Stacked Neural Network model (Fig. 6b). The time and the number of arrivals normalized in between 0 to 1 are presented in the x-axis and y-axis, respectively. a
line graph represents the prediction of inbound travelers from 2015 to 2017 using multilayer perceptron model while b line graph shows the same prediction applying stacked circular neural network model. Different colored lines indicate different groups of traveler.
As shown in Figure-6, overall, the total number of travelers is decreasing. This data indicates that the number of inbound passengers will reduce within the predicted time-frame. However, this prediction is also unreliable, because the predicted graphs did not have many similarities with the existing dataset. Therefore, it could be concluded that it is quite impossible to make an accurate prediction of the arrival and departure status of the travelers by using the simple graphs (Fig.5 and Fig.6).
5. SENTIMENT DATA ANALYSIS
5.1 Analytical Tools
The sentiment analysis was performed using Google API. The Google API contains a dictionary that could define the positive and negative emotions with accuracy. There are three types of analysis (sentiment analysis, entity analysis, and parsing) that are usually performed using Google's natural language processing API service. Among them, the sentiment analysis was used for the present study, which is mainly based on Google's positive and negative word dictionary, and the result is extracted as a score and a magnitude. The algorithm used for analyzing sentiment is quite simple. Briefly, a word from the beginning of a sentence to the end was designated as a document, while the positive or negative words included in the document were examined to be given a score. However, it takes quite a while to implement these dictionaries, so we selected the Google natural language API application for quick analysis. Usually, the cafe's posts contain the emotions of the individual cafe users; therefore, we did not calculate the average of the cafe's weight. Instead, sentiment results were calculated by selecting only score among score and magnitude which are the results of sentiment analysis.
5.2 Analysis of Sentiment Data
[image:7.612.322.518.232.376.2]As shown in Figure 7, the results of the sentiment analysis of the two cafés have been presented in a monthly order. This helps to make an easy comparison of the monthly sentiment data generated from the two cafes. Here, the mean of the existed data of each month has been shown, but the weight was not calculated during the calculation of the mean. The x value represents the time, and the y value represents the sentiment scores which are expressed in between -1 to 1.
Figure 7. Sentiment Change Trend Of The Two Cafés (‘I Love Australia’ And ‘Hoggoksung’) In Between 2007
And 2017.
7431
6. FINAL RESULTS AND DISCUSSION
[image:8.612.315.517.130.268.2]Finally, the mean scores of the two cafes were put together based on the assumption that the sentiment data of the two cafes have the same weight.
Figure 8: The Integrated Result Of Sentiment Analysis Data Of Two Cafes.
[image:8.612.92.297.173.292.2]Figure 8 depicts the sentiment data that has taken place before the analysis, and integration process. The x-axis represents times, and the y-axis represents the sentiment scores normalized in between -1 to 1. In addition, the issues that occurred in Australia during this study time-frame were also investigated (some of which are listed in Table 2) to understand the low or high integration. Using this analysis it is possible to confirm the sudden increase and the sudden drop of emotion, and the reliability of the sentiment data can be verified.
Table-2: Sample Of Issues Happened In Australia During This Study Period
Negative Issues
2012-12 Sharp
Decline Asians do not inquire assaults 2014-09 Sharp
Decline Terrorist Attack in August and September 2016-06 Negative Terrorism Issues: April 1
case, May 2 case, June 1 case
Positive Issues
2015-01 Upsurge Australia Asian Cup, exchange rates plummeted
(approx. 950-840 won) 2015-11 Increase Recorded the lowest
exchange rate in October (800.61 won)
A diagrammatic depiction of the effects of sample issues selected during the range of the
observed time period has been shown in Figure 9. The sharp effects are red circled.
Figure 9: Depiction of Effects of Sample Issues During The Observed Time Period.
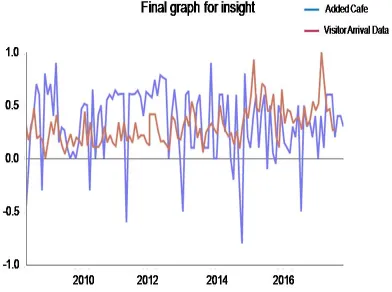
At last, a comparison was made between the results of numerical data and the sentiment data (Fig. 10) to see if there is any correlation exists between them. Since we normalized from -1 to 1, it could be compared easily to understand the sentiment score to the number of arrivals. The time and sentiment scores normalized in between -1 to 1 are presented in the x-axis and y-axis, respectively, while the number of arrivals and the sentiment analysis result of added cafés are directed by different colored lines.
Figure 10. Comparative Scenario Between ‘Actual Arrival Record’ And ‘Sentiment Analysis Result’.
[image:8.612.322.518.456.602.2] [image:8.612.89.299.518.691.2]7432 given the speed at which information about
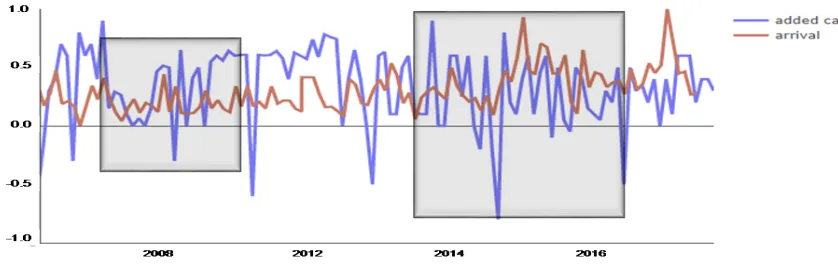
[image:9.612.93.512.142.275.2]Australian issues spread to the people, therefore, it is highly reliable. In particular, both lines show a
Figure 11. A Special Range Of Similarities Between Two Graphs
very similar trend of changes from around 2015 to the present. And Figure 11 confirms that the researchers have marked on points that they find are particularly similar. Therefore, it could be concluded that the perception of the public about the working holiday could be a better prediction than simple numerical data based prediction.
It should be noted that we have questioned the fact that there exists a point where the direction of the slope of two graph lines coincides with a point which deviates little by little. This is considered to be an error according to the propagation speed of information. Specifically, it is the difference between the time of information spread between people and the point of time when people actually leave for working holiday. It is possible that the information on the 'NaverCafé' is out of date because these researchers did not conduct sentiment analysis on all posts related to Australia. In addition, numerical graphs can be pushed backward than sentiment graphs at many points when people leave for Working Holiday based on previously reported information.
However, according to this analysis, it can be confirmed that it is more accurate to grasp the feelings of the public about the working holiday to predict the number of future travelers than the prediction using only the change of the simple numerical data as a variable.
7. NOVELTY OF THE STUDY
This research has clear distinction from the extant simple predictive models which learn only from existing numerical values. The novelty it
offers is twofold. First, the study emphasizes and empirically proves that community perception is more reliable predictor of future events. Second, it does not stop just by looking at the feelings of the person who wrote the post on a social platform, but also analyzes the impact of the post on other people who read the post. Taking the working holiday in Australia into consideration, we studied the impact by using the emotions that post writers of the time period felt on average.
8. CONCLUSION
In conclusion, this sort of analysis is very well applied when performing classification and clustering work but it has limitations in applying on human-made changes such as stock price using only numerical data. Therefore, we attempted to combine numerical data analysis and sentiment analysis to find better analytical methods with higher reliability and accuracy. Accordingly, it has been found that this fusion analysis using sentiment data is very much effective, and the effectiveness of the analysis is determined based on whether the sentiment analysis data of the Naver Cafe post and the numerical data of the number of immigrants show a similar trend of changes. Although the number of outbound passengers did not change with positive or negative sentiment scores, the results itself proved that the study is successful as it shows the same degree of change in both types of analysis (sentiment data analysis and numerical data analysis).
7433 immigrants, as well as not creating our own special positive and negative language dictionary for this particular dataset analysis due to the time limitation. In the future research, data on arrival and departure of Australia's working holiday participants as well as other reasons for travel such as business, convention/conference could be incorporated in the analysis. Finally, this analysis technique could be considered as an important addition to the ‘Big Data’ analysis technology, and it could be used for predicting the tendency of people’s participation to an upcoming event based on the ‘past history of people’s perception’.
ACKNOWLEDGMENTS: This study was supported by 2017 Research Grant from Kangwon National University(520170118), also by Institute for Information & communications Technology Promotion (IITP) grant funded by the Korea government (MSIP) (No: 2017-0-00333, User– Friendly UI/UX Technology for Intelligent Devices) and Korea Institute of Planning and Evaluation for Technology in Food, Agriculture, Forestry and Fisheries (IPET) through (Advanced Production Technology Development Program), funded by Ministry of Agriculture, Food and rural Affairs (MAFRA) (116116-03-1-SB010).
REFRENCES:
[1] Gandomi A, Haider M. Beyond the hype: Big data concepts, methods, and analytics. International Journal of
Information management. 2015; 35(2):
137-144.
[2] Chen M, Mao S, Liu Y. Big Data: A Survey. Mobile Networks and
Applications. 2014; 19(2):171-209.
[3] Hu H, Wen Y, Chua TS, Li X. Toward Scalable Systems for Big Data Analytics: A Technology Tutorial. IEEE Access.
2014; 2: 652-87.
[4] LeCun Y, Boser B, Denker JS, Henderson D, Howard RE, Hubbard W, et al. Backpropagation Applied to Handwritten Zip Code Recognition. Neural
Computation. 1989; 1(4):541-51.
[5] Dahl GE, Sainath TN, Hinton GE, editors. Improving deep neural networks for LVCSR using rectified linear units and dropout. 2013 IEEE International Conference on Acoustics, Speech and
Signal Processing; 2013 26-31 May
2013.
[6] Liu Y, Teichert T, Rossi M, Li H, Hu F. Big data for big insights: Investigating
language-specific drivers of hotel satisfaction with 412,784 user-generated reviews. Tourism Management.
2017;59:554-63.
[7] Wilson J, Fisher D, Moore K. The OE goes ‘home’: Cultural aspects of a working holiday experience. Tourist
Studies. 2009;9(1):3-21.
[8] Wandner SA, Erden JDv. Estimating the demand for international tourism using time series analysis. Washington, D.C.: Department of Human Kinetics and Leisure Studies, George Washington
University; 1980. p. 381-92.
[9] Archer B. Demand forecasting and estimation. New York: John Wiley &
Sons, Inc.; 1987. p. 77-85.
[10] Ma E, Liu Y, Li J, Chen S. Anticipating Chinese tourists arrivals in Australia: A time series analysis. Tourism
Management Perspectives. 2016;17:50-8.
[11] Pai P-F, Hung K-C, Lin K-P. Tourism demand forecasting using novel hybrid system. Expert Syst Appl.
2014;41(8):3691-702.
[12] Song H, Li G. Tourism demand modelling and forecasting—A review of recent research. Tourism Management.
2008;29(2):203-20.
[13] Hassani H, Silva ES, Antonakakis N, Filis G, Gupta R. Forecasting accuracy evaluation of tourist arrivals. Annals of
Tourism Research. 2017;63:112-27.
[14] Claveria O, Torra S. Forecasting tourism demand to Catalonia: Neural networks vs. time series models. Economic Modelling.
2014; 36:220-8.
[15] Chen K-Y. Combining linear and nonlinear model in forecasting tourism demand. Expert Systems with
Applications. 2011;38(8):10368-76.
[16] Hassani H, Webster A, Silva ES, Heravi S. Forecasting U.S. Tourist arrivals using optimal Singular Spectrum Analysis.
Tourism Management. 2015;46:322-35.
[17] Lin CJ, Chen, H. F., Lee, T. S. Forecasting tourism demand using time series, artificial neural networks and multivariate adaptive regression splines: Evidence from Taiwan. International
Journal of Business Administration.
2011;2(2):11.
7434
Tourism Management.
2003;24(3):323-30.
[19] Burger CJSC, Dohnal M, Kathrada M, Law R. A practitioners guide to time-series methods for tourism demand forecasting — a case study of Durban, South Africa. Tourism Management.
2001;22(4):403-9.
[20] Kon SC, Turner LW. Neural Network Forecasting of Tourism Demand. Tourism
Economics. 2005;11(3):301-28.
[21] Nor ME, Safuan, H. M., Shab, N. F. M., Asrul, M., Abdullah, A., Mohamad, N. A. I., Lee, M. H. . Neural network versus classical time series forecasting models.
AIP Conference Proceedings.
2017;1842(1).
[22] Linares R, Herrera J, Cuadros A, Alfaro L, editors. Prediction of tourist traffic to Peru by using sentiment analysis in Twitter social network. 2015 Latin
American Computing Conference (CLEI);
2015 19-23 Oct. 2015.
[23] Li N, Wu DD. Using text mining and sentiment analysis for online forums hotspot detection and forecast. Decision
Support Systems. 2010;48(2):354-68.
[24] Alain Yee Loong C, Boying L, Eric WTN, Eugene Cn, Filbert L. Predicting online product sales via online reviews, sentiments, and promotion strategies: A big data architecture and neural network approach. International Journal of
Operations & Production Management.
2016;36(4):358-83.
[25] Australian Government DoIaBP.
Working Holiday Maker Visa Program
Report. 2017.
[26] Department of Border Protection & Tourism Research Australia IVS. Working Holiday Makers. 2017.
[27] Brennan C. Backpackers or Working Holiday Makers? Working Tourists in Australia. Qualitative Sociology Review.
2014;10(3):94-114.
[28] Department of Immigration and Border Protection GoA. Overseas Arrivals and
Departures (ODA) Database. 2017.
[29] Rosenblatt F. Principles of Neurodynamics: Perceptrons and the Theory of Brain Mechanisms. Spartan
Books, Washington DC. 1961.
[30] Rumelhart DE, Hinton GE, Williams RJ. Learning internal representations by error propagation. In: David ER, James LM,
Group CPR, editors. Parallel distributed processing: explorations in the microstructure of cognition, vol 1: MIT
Press. 1986. p. 318-62.
[31] Cybenko G. Approximation by superpositions of a sigmoidal function.
Mathematics of Control, Signals and
Systems. 1989;2(4):303-14.
[32] Hastie T, Tibshirani, R., Friedman, J. The Elements of Statistical Learning: Data Mining, Inference, and Prediction.
Springer, New York. 2009.
[33] Rosenblatt F. Perceptron Simulation Experiments. Proceedings of the IRE.
1960;48(3):301-9.
[34] Woodland PC, editor Weight limiting, weight quantisation and generalisation in multi-layer perceptrons. 1989 First IEE International Conference on Artificial
Neural Networks, (Conf Publ No 313);
1989 16-18 Oct 1989.
[35] Graves A, Liwicki M, Fernández S, Bertolami R, Bunke H, Schmidhuber J. A Novel Connectionist System for Unconstrained Handwriting Recognition.
IEEE Transactions on Pattern Analysis
and Machine Intelligence.
2009;31(5):855-68.
[36] Gers FA, Schraudolph NN, #252, Schmidhuber r. Learning precise timing with lstm recurrent networks. J Mach
Learn Res. 2003;3:115-43.
[37] Bayer J, Wierstra D, Togelius J, Schmidhuber J, editors. Evolving Memory Cell Structures for Sequence Learning. Artificial Neural Networks – ICANN 2009; 2009 2009//; Berlin,