In order to receive payments under the Supplemental Security Income (SSI) program, an aged, blind, or disabled person’s countable resources must fall below specified limits. The current limits are $2,000 for an individual and $3,000 for a couple. In 1987, when the data were collected for this study, these limits were $1,800 for an individual and $2,700 for a couple. This study found that the resource levels of most SSI recipients were well below the 1987 limits. A majority of SSI recipients had less than $100 in countable resources, and only about 12 percent of SSI recipients had more than $1,000 of resources. These low levels of resources ensure that relatively few recipients become ineligible for SSI payments because of resource accumulation. The most common forms of countable resources held by SSI recipients were cash, checking accounts, and savings accounts.
*Division of Program Management and Analysis, Office of Supplemental Security InCOme, Social Security Administration.
In order to be eligible to receive payments under the Supplemental Security Income (SSI) program, aged, blind, or disabled persons must satisfy certain eligibility requirements. One of these
requirements is a limit on the value of the resources an individual or couple can own. Resources are those assets that a person owns and can apply either directly or by sale or conversion to meet the basic needs of food, clothing, and shelter. Certain exclusions are authorized by provisions in the Social Security Act and other Federal laws; all other resources are counted against the statutory limit.
For 1974-84, the resource limits were $1,500 for an individual and $2,250 for a couple. Beginning in 1985, the limits were raised by the amounts stipulated in Public Law 98-369. The limits provided in that legislation are shown in the following tabulation: Individual Couple 1985 . . . . . . . $1,600 $2,400 1986 . . . . . . . 1,700 2,550 1987.. _ , . . 1,800 2,700 1988 . . . . _ . . 1,900 2,850 1989 and beyond.. . . 2,000 3,000
The information on countable resources contained in this article was derived from the Quality Assurance (CIA) Review-a process
used by the Social Security Administration (SSA) to monitor
payment and eligibility accuracy for the SSI program. This process
involves a personal interview and completed questionnaire for a sample of approximately 15,000 persons receiving SSI payments each year. The questionnaire has always contained information on resource types and amounts, but these data were not coded.
Beginning in October 1986, this information was included in the QA data base. This article reports on responses to the questions administered during the period October 1986-September 1987 and is divided into the following
sections: Total countable resources; cash on hand, bank accounts, and other liquid resources; home and other real property; vehicles used for transportation; life insurance; burial funds and spaces; and household goods and personal effects.
Estimates in this article are based on 15,093 responses. Because these cases were selected throughout the year, the inflated totals represent an average of all recipients paid during the review period. All figures are rounded to the nearest 100; therefore, some
columns of numbers may not add to the total. The Technical Note contains tables of sampling errors for estimated counts and percents.
Recipients with Countable
Resources
In March 1987, midway through the 12-month study period, 4,217,600 persons were receiving Federal SSI and/or State
supplementary payments. These individuals were grouped into 3,991,400 recipient units (individuals or couples), and these units were further divided into the following five groups: Individuals: Aged... 1,134,ow Blind/disabled adults.. . . . 2,113,900 Blind/disabled children ’ . . , . . 318,900 Couples: Aged... 169,200 Blind/disabled.. . . . . . , . . 255,400
’ Some adults are classified as children if the program category code is no1 updaled promptby at age 22.
Aged, blind, and disabled recipients are the three eligibility categories of persons receiving SSI payments. Because of the small number of blind recipients in the sample, blind recipients have been combined with the larger group of disabled recipients and are categorized as disabled in this
article. The distinction between individuals and couples was made because of the different resource limits for each group. Adults and children were separated because of the different ways in which
resources are counted for each group. For the purposes of this article, a couple is a unit in which either or both members are eligible for SSI payments. Most SSI program publications categorize recipients with ineligible spouses as individuals, not as members of couples.
Individuals
All SSI recipients who do not live in the same household with an eligible (for SSI payments) or ineligible spouse are classified in this article as individuals. Countable resources are those resources that remain after all appropriate
exclusions are applied. For the majority of aged individuals or disabled adult individuals, total countable resources are the sum of their own countable resources. To determine eligibility for SSI
payments, that sum is then
compared with the resource limit for an individual. During the first 3 months of the study period, the resource limit was $1,700. The limit was increased to $1,800 during the last 9 months of the study period.
In certain situations, however, other persons are expected to share financial responsibility for aged or disabled adults, or other persons’ well-being is so essential to the individual that the SSI payment is augmented on their behalf. I Where such a person exists, his or her resources are considered in determining the individual’s SSI eligibility. These resources are “deemed” to belong to the recipient. Of the 3.3 million aged and disabled adults on the SSI program rolls during the study period, less than 1 percent had resources deemed to them.
For disabled children under age 18, the most common form of deeming is parent-to-child deeming. This type of deeming can occur whenever the child lives with its parent(s). The child’s resources are deemed to include the countable resources of the parents to the extent that those resources exceed the resource limit of either an individual, if one parent lives in the household, or a couple, if both parents live in the household.
These deemed amounts are added to the child’s countable resources to arrive at total countable resources. The total
’ These persons are sponsors of lawfully resident alien recipients and essential persons.
countable resources can then be compared with the resource limit for an individual. If more than one child in the household is eligible, the deemed amounts are divided equally among them.
Of the 318,900 disabled children on the rolls during the study period, 93,400 (29 percent) had resources deemed to them. The median amount of the deemed resources was $257.
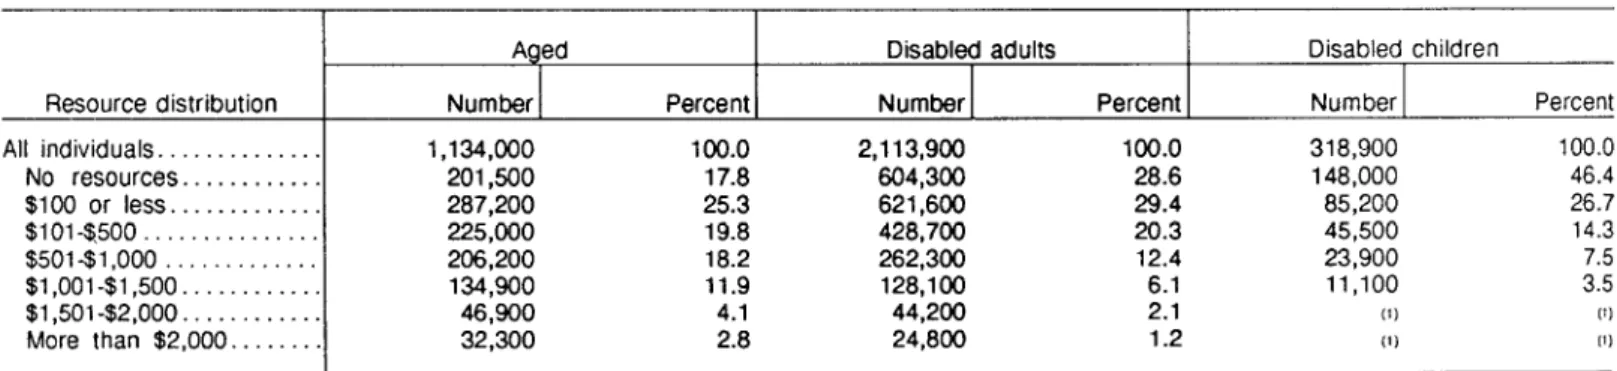
A summary of total countable resources for SSI individual
recipients (table 1) reveals that SSI recipients had very low levels of countable resources. About 43 percent of the aged individuals, 58 percent of the disabled individuals, and 73 percent of the disabled children had less than $100 in countable resources. Only 7 percent of the aged adults, 3 percent of the disabled adults, and 2 percent of the disabled children had resources near or above the limit for an individual (that is, $1,700 in 1986 and $1,800 in 1987). The Quality Assurance Review found that some individuals had resources above the limit and that those persons should have been ineligible during the sample month. The discovery of these excess resources resulted in a retroactive loss of eligibility for these individuals.
Overall, the aged individuals had higher resource levels than the
Table 1 .-Total countable resources of individuals receiving SSI payments, October 1986-September 1987
Aged Disabled adults Disabled children
Resource distribution All individuals ... No resources ... $100 or less. ... $101~$500 ... $501-$1,000 ... $l,OOl-$1,500 ... $1,501-$2,000 ... More than $2,000 ...
Number Percent Number Percent Number Percent
1,134,ooo 100.0 2,113,900 100.0 318,900 100.0 201,500 17.8 604,300 28.6 148,000 46.4 287,200 25.3 621,600 29.4 85,200 26.7 225,000 19.8 428,700 20.3 45,500 14.3 206,200 18.2 262,300 12.4 23,900 7.5 134,900 11.9 128,100 6.1 11,100 3.5 46,900 4.1 44,200 2.1 (1) 111 32,300 2.8 24,800 1.2 (1) IfI
’ Less than 7,500 persons.
disabled adults. Disabled children had the lowest resource levels of the three groups.
Couples
All recipients who live in the same household with an eligible or ineligible spouse are classified in this article as members of couples. If both members of the couple are potentially eligible because of age or disability, their combined resources are compared with the limit for a couple. During the first 3 months of the study period, this limit was $2,550; it was increased to $2,700 during the last 9 months of the study period.
If only one member of a couple is eligible, his or her resources are deemed to include the resources of the ineligible spouse. This spouse- to-spouse deeming is the most common type of deeming that affects adults. Regardless of whether or not the spouse is eligible, the total countable resources are the sum of the couple’s resources. These summed resources are also compared with the resource limit for a couple to determine eligibility.
Of the 169,200 aged couples, 2 35,200 were eligible individuals with ineligible spouses, of whom 15 percent had resources deemed from an ineligible spouse. The median amount deemed was $418. Of the 255,400 disabled couples, 163,200 were eligible individuals with ineligible spouses, of whom 16 percent had resources deemed from an ineligible spouse. The median amount deemed for disabled couples was $269.
*Some couples consisted of an aged person with a disabled spouse (or vice versa). The classification of an aged or disabled couple depends on the program category of the first person listed in the unit.
Similar to individuals receiving SSI, couples receiving SSI payments also have low levels of countable resources (table 2). About 36 percent of the aged couples and 53 percent of the disabled couples had less than $100 in countable resources. Only about 4 percent of the aged couples and 2 percent of the disabled couples were near or above the limit for a couple ($2,550 in 1986, $2,700 in 1987). Aged couples had higher amounts of resources than disabled couples.
These low levels of resources among SSI recipients ensure that relatively few individuals or couples become ineligible because their resource accumulation exceeds the statutory limitations. During 1986, for example, only 47,700 recipients had their payments suspended because their resources exceeded the limit. 3 This number represented only about 1 percent of the overall SSI caseload in June 1986. Furthermore, of the 47,700 recipients whose payments were suspended because of excess resources, only 27,500 of their records were terminated because of suspensions that lasted for a full
3 Data from the Social Security Administration’s l-percent sample file, December 1985December 1987.
year. The other recipients had their payment status reinstated within the year.
Cash on Hand, Bank
Accounts, and Other
Liquid Resources
Resources can be categorized as either liquid or nonliquid, Liquid resources are resources in the form of cash or other property that can be converted to cash within 20 workdays. Nonliquid resources are not in the form of cash and cannot be converted to cash within that timeframe. Most types of resources-such as insurance policies-may be either liquid or nonliquid. However, either type of resource counts against the statutory resource limit unless it is specifically excluded.
The most common type of countable liquid resource held by recipients was cash (table 3). About 48 percent of aged individuals and 40 percent of disabled individuals had some cash. The median amount of cash on hand was $20. Somewhat smaller percentages of aged and disabled individuals had checking or savings accounts, but the median amounts of these types of resources were much larger than for cash. Among aged individuals,
Table P.-Total countable resources of couples receiving SSI payments, October 1986-September 1987 Resource distribution All couples ... No resources. ... $100 or less. ... $lOl-$500. ... $501~$1,000 ... $l,OOl-$1,500 ... $1,501-$2,000 ... $2,001-$2,500 ... $2,501-$3,000 ... More than $3,000 ...
Aged couples Disabled couples
Number Percent Number Percent
169,200 loo.0 255,400 100.0 23,500 13.9 61,700 24.2 37,000 21.9 74,000 29.0 33,900 20.0 49,800 19.5 24,200 14.3 31,800 12.5 20,400 12.1 18,400 7.2 18,000 10.6 10,500 4.1 5,900 3.4 3,800 1.5 2,400 1.4 1,500 .6 3,900 2.3 3,900 1.5
the median amount in a checking account was $420; in a savings account, it was $488. Disabled individuals had smaller
amounts-$308 for checking and $293 for savings. Other liquid resources owned by recipients include stocks, bonds, mortgages, and promissory notes. Very few recipients had such resources.
Overall, couples and individuals had similar levels of resources. For couples, the proportions were very similar within each category-cash, checking, and savings accounts (table 4). Couples, however, did have some minor differences from individuals in the median values of their resources when the SSI program category was considered. The median value of checking accounts ($471) for the aged was nearly double the median value of accounts among the disabled ($249). The median value of savings accounts for the aged ($554) was more than double the value of such accounts for the disabled ($212).
Home and Other Real Property
The most common form of real property owned by SSI recipients was a home, which usually was excluded from countable resources when determining an individual’s or a couple’s eligibility. The recipient must have an ownership interest in the home, and must use it as his/her principal place of residence, if it is to be excluded. The home includes buildings as well as the land on which they are located. Although the survey did not include the value of the home, other data were available on home ownership. About 18 percent of all the
responding SSI recipient individuals and couples had ownership interest in a home. The aged were more likely to own their own home than
Table 3.-Countable liquid resources of individuals’ receiving SSI payments, by type of resources and program category, October 1986-September 1987
Persons with resources Type of resource and
program category Cash: Aged . . . . . . . . . . Disabled . . . Checking account: Aged... Disabled . . . . Savings account: Aged... Disabled . . . . . , . . . Other liquid: Aged... Disabled . . . .
All Number Percent
1,134,cQo 552,300 467 2,113,900 865,400 40.9 1,134,OOo 356,400 31.4 2,113,900 424,600 20.1 1,134,OOo 365,000 32.2 2,113,900 636,900 30.1 1,134,OOo 18,800 1.7 2,113,900 34,500 1.6 Median amount $20 20 420 306 488 293 595 324
’ Children are excluded here and in subsequent analyses because the specific resources they own are not
identifiable separately from the resources of their parents.
Table 4.-Countable liquid resources of couples receiving SSI payments, by type of resource and program category, October 1986September 1987
Couples with resources
Type of resource and program category Cash: Aged . . . Disabled . . . Checking account: Aged... Disabled Savings account: Aged . . . . . . . . . . . . Disabled . . . . . . . . . . . Other liquid: Aged . . . . Disabled . . .
All Number Percent
169,200 92,300 54.6 255,400 120,900 47.3 169,200 62,600 37.1 255,400 70,600 27.6 169,200 55,600 32.9 255,400 65,600 25.7 169,200 11) (1) 255,400 (1) (0 Median amount $25 20 471 249 554 212 (1) (1)
’ Less than 7.500 persons.
were the disabled, and couples were more likely to be homeowners than were individuals (table 5). 4 Most of the homes owned by these recipients were nonfarm houses or apartments. About 2 percent of SSI recipients owned trailers or mobile homes, and fewer still lived on farms.
If the real property owned by the recipient does not meet the
definition of a home, it is generally counted toward the resource limit. Less than 1 percent of all SSI recipient individuals/couples had nonhome real property. Typically, this property was in the form of unimproved land. The median market value of the property was
‘About one-third of all individuals and COuPleS receiving SSI payments who owned their homes did so jointly with other persons, usually their spouses.
$1,000.
Vehicles Used for Transportation
A second commonly held
nonliquid resource is a vehicle used for necessary transportation. About 18 percent of all SSI recipient individuals and couples in the sample owned one or more vehicles. Similar percentages of aged and disabled recipients owned vehicles (table 6). However, aged couples (44 percent) and disabled couples (61 percent) were much more likely to own vehicles than were either aged individuals (12 percent) or disabled individuals (13 percent).
One vehicle can be excluded from countable resources, regardless of its value, if it is necessary:
l In obtaining medical treatment; l In connection with
employment;
l To transport a handicapped
individual; or
l To perform necessary daily
activities, such as shopping, because of conditions including climate, terrain, or distance.
If the vehicle cannot be excluded for any of the above reasons, it may be excluded as a countable
resource if its market value does not exceed $4,500. Any market value in excess of $4,500 counts toward the resource limit.
For virtually all recipients, a first vehicle was excluded. The median market value for the first car was $600. The second vehicle generally counted as a resource to the extent of its equity value. The median value of the second car was $350.
Life Insurance
Life insurance that has a cash surrender value and is owned by an individual (or spouse) is excluded from countable resources if the total face value of all policies owned on any one person does not exceed $1,500. However, if the total face value of such insurance policies exceeds $1,500, then the cash surrender value of the insurance counts as a resource.
About 20 percent of the SSI recipient individuals and couples the sample had one insurance
in policy or more. These policies do not include term insurance, which does not have a cash surrender value. Nearly 9 percent of these SSI recipients had two or more policies. Aged recipients were only slightly
more likely to own insurance than were disabled recipients (table 7).
More than one-half of the disabled individuals/couples and aged couples who had insurance policies, had policies whose face value exceeded $1 ,500.5 About one- third of the aged individuals who had policies, had total policies with face values exceeding $1,500. The median cash surrender values were higher for aged individuals ($630) and aged couples ($1,038) than for disabled individuals ($343) and
‘Life insurance is excluded from the countable resources of couples if the total
face value of each member’s policies is less than $1,500. The survey did not provide separate totals for each member of a couple.
Table 5.-Number and percentage distribution of homeowner SSI recipients, by type of home and program category, October 1986September 1987
Home ownership Total number.. . Total percent.. Did not own home.. . . Owned home.. . . .
Nonfarm home.. . . . Farm . . . . . . . . . . Trailer or mobile home.. . . Other... Aged Individual 1,134,OOo 100.0 74.4 25.6 21.7 1.5 2.5 .l Couple 169,200 106.0 61.3 38.7 31.0 3.7 4.1 . Disabled Individual Couple 2,113,900 255,400 100.0 100.0 90.0 64.8 10.0 35.2 8.2 28.7 .3 .6 1.5 5.7 . . . .l
Table 6.-Number and percentage distribution of SSI recipients who owned vehicles, by program category and number of vehicles owned, October 1986-September 1987 Vehicle ownership All persons.. . . . . . . . Total percent.. . . . . Owned vehicles: None... l... 2 or more... Aged Individual 1,134,OOo 1cO.o 87.7 11.8 .5 Couple 169,200 100.0 56.1 37.2 6.7 Disabled Individual Couple 2,113,900 255,400 100.0 100.0 87.1 38.4 12.2 50.5 .7 10.1
Table 7.-Number and percentage distribution of SSI recipients with life insurance policies with cash surrender value, by face value of policy and program category, October 1986September 1987
Life insurance status All persons.. . . . Total percent.. . . . , No life insurance.. . . . . . . . Owned one policy or more. . .
Combined face value $1,500 or less. More than $1,500.. . . . Aged Individual 1,134,OOo 100.0 75.8 24.2 15.8 8.4 Couple 169,200 106.0 73.8 26.2 9.9 16.3 Disabled Individual Couple 2,113,800 255,400 100.0 100.0 81.5 77.9 18.5 22.1 7.4 3.9 11.1 18.2
disabled couples ($373) for those whose policies had a total face value of more than $1,500.
Burial Funds and Spaces
If an individual’s total countable resources exceed the statutory limit, up to $1,500 can be excluded for burial funds if the money is specifically set aside for the burial of an eligible individual or his/her spouse. Any type of resource may be set aside as a burial fund-cash, burial contracts, and other
properties. A maximum of $1,500 (plus an additional $1,500 for a spouse) can be excluded. B However, this $1,500 maximum is reduced by the face value of excluded insurance on the individual’s life. The maximum is also reduced by the value of any irrevocable arrangement if it is available to meet the individual’s burial expenses. If the individual does not need the burial funds exclusion to stay under the resource limit, the burial funds
‘Interest earned on excluded burial funds and accruals to value, if left to accumulate in the fund, are also excluded, even if the total value exceeds $1,500.
count toward the limit.’ The value of burial plots or spaces held for an individual or any member of his/her immediate family is excluded from resources regardless of value. This exclusion is in addition to the exclusion of burial funds and has no effect on the burial fund exclusion.
About 10 percent of the surveyed SSI individuals/couples had set aside resources or spaces for burial. About two-thirds of these resources were in the form of excluded burial plots. The remaining resources were in the form of burial funds. A few individuals/couples (about 1 percent) had two or more burial resources.
In the review process, the value of burial resources was obtained (except for excludable plots or crypts). The median values of these resources were $1,348 for disabled individuals, $1,679 for disabled couples, $1,300 for aged
individuals, and $1,279 for aged couples.
7 Effective April 1, 1988, the burial funds exclusion can apply even if resources otherwise would not exceed the limit.
Household Goods
and Personal Effects
Household goods and personal effects are counted toward the resource limit only if the individual’s equity sum exceeds $2,000.
Wedding and engagement rings and certain medical equipment are excluded. No questions were asked of the SSI recipients in this sample concerning this type of resource.
Summary
The level of resources held by the majority of SSI recipients is quite low. Most SSI recipients had less than $100 in countable resources. Only about 11.6 percent of all individual recipients had resources exceeding $1,000. Because of these low levels, few recipients have their payments suspended or terminated from the program because they exceed the resource limits. Periodic changes in the resource limits and the rules the agency uses for counting resources have only a marginal effect on eligibility for persons already on the SSI program.
Technical Note
The cases in this study were identified from the Quality
Assurance (QA) Review. The SSI- QA payment system is designed to provide statistically reliable
information about the level at which the SSI program is operating. The SSI-QA data are used by the Social
Security Administration to determine the frequency and causes of incorrect determinations of eligibility and payment amounts. A sample selection is performed monthly of approximately 1,400 cases nationally. This stratified random
sample is selected from the
Metropolitan Statistical Areas within SSA’s administrative regions. From October 1986 to September 1987, approximately 15,000 persons eligible for SSI payments were selected for this review.
An extensive interview is conducted with the recipient- including the review and verification of documentary proof. Collateral contacts are made to verify statements made during the interview. Discrepancies in case information are identified and payment error determinations are made as required. The results of the review are then transmitted to the QA computer system to generate desired statistical data.
Estimates based on the QA sample may differ from the figures that would have been obtained had all, rather than a sample, of the records been used. These differences are termed sampling variability. The standard error is a measure of sampling variability- that is, the variation that occurs by chance because a sample is used. The standard error is used to describe confidence intervals. The confidence interval represents the extent to which the sample results can be relied on to describe the results that would occur if the entire population (universe) had been used for data compilation rather than the sample.
In about 68 percent of all possible probability samples with the same selection criteria, the universe value would be included in the interval from one standard error below to one standard error above the
sample estimate. Similarly, about 95 percent of all possible samples will give estimates within two standard erfors, and about 99 percent will give estimates within 2-112 standard errors.
Tables I and II provide
approximations of standard errors of the estimates in this article.
Approximate standard errors for the estimated number of recipients from the QA sample file are presented in table I. Table II presents
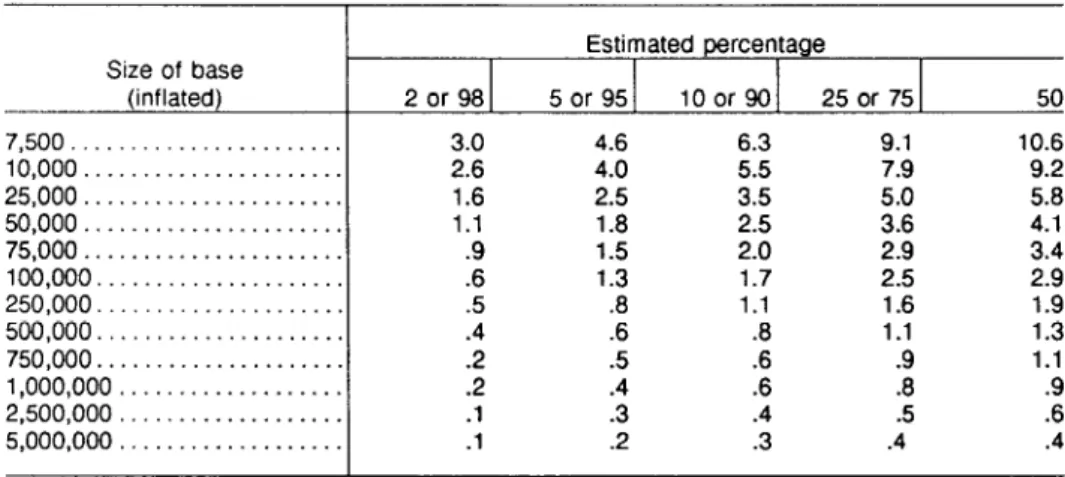
approximations of standard errors for the estimated percentage of persons from the QA sample file. The reliability of an estimated percentage depends on both the size of the percentage and the size of the number on which the
percentage is based. The standard errors are expressed as percentage points and the bases are shown as inflated to the actual size of the universe from which the sample was drawn. In both tables, linear interpolation may be used to obtain values not specifically shown.
Table I.-Approximations of standard errors of estimated numbers of persons from the Quality Assurance file
Size of estimate Standard
(inflated) error 7,500... 1,600 10,000 . . . . . . 1,850 25,000 . . . 3,000 50,000 . . . . . . . . . . . 4,300 75,000... 5,300 100,000 . . . 6,200 250,000... 10,500 500,000... 16,500 750,000... 21,800 1,000,000... 27,000 2,500,000... 56,350 5,000,000... 103,900
Table Il.-Approximations of standard errors of estimated percentages of persons from the Quality Assurance file
Size of base (inflated) 7,500... 10,000... 25,000... 50,000... 75,000... 100,000... 250,000... 500,000. . . . 750,000... 1,000,000 . . . 2,500,OOO . . . 5,000,000 . . . 2 or 98 3.0 2.6 1.6 1.1 .9 .6 .5 :Z .2 .l .l Estimated percentage 5 or 95 lOor 25 or 75 4.6 6.3 9.1 4.0 2.5 f :i 7.9 1.8 $:Z ifi 2:9 1.5 1.3 1.7 2.5 1.1 1.6 :i .8 1.1 .5 .9 :: .8 :i .4 .5 .2 .3 .4 50 10.6 9.2 5.8 4.1 3.4 2.9 1.9 1.3 1.1 .9 .6 .4