It’s not a Bug, it’s a Feature:
How Misclassification Impacts Bug Prediction
Kim Herzig
Saarland University Saarbr¨ucken, Germany [email protected]Sascha Just
Saarland University Saarbr¨ucken, Germany [email protected]Andreas Zeller
Saarland University Saarbr¨ucken, Germany [email protected]Abstract—In a manual examination of more than 7,000 issue reports from the bug databases of five open-source projects, we found 33.8% of all bug reports to be misclassified—that is, rather than referring to a code fix, they resulted in a new feature, an update to documentation, or an internal refactoring. This misclassification introduces bias in bug prediction models, confusing bugs and features: On average, 39% of files marked as defective actually never had a bug. We estimate the impact of this misclassification on earlier studies and recommend manual data validation for future studies.
Index Terms—mining software repositories; bug reports; data quality; noise; bias
I. INTRODUCTION
In empirical software engineering, it has become common-place to mine data from change and bug databases to detect where bugs have occurred in the past, or to predict where they will occur in the future. The accuracy of such measurements and predictions depends on thequality of the data.Therefore, mining software archives must take appropriate steps to assure data quality.
A general challenge in mining is to separate bugs from non-bugs. In a bug database, the majority of issue reports are classified as bugs—that is, requests for corrective code maintenance. However, an issue report may refer to “perfective and adaptive maintenance, refactoring, discussions, requests for help, and so on” [1]—that is, activities that are unrelated to errors in the code, and would therefore be classified in a non-bug category. If one wants to mine code history to locate or predict error prone code regions, one would therefore only consider issue reports classified as bugs. Such filtering needs nothing more than a simple database query.
However, all this assumes that the category of the issue report is accurate. In 2008, Antoniol et al. [1] raised the problem of misclassified issue reports—that is, reports clas-sified as bugs, but actually referring to non-bug issues. If such mix-ups (which mostly stem from issue reporters and developers interpreting “bug” differently) occured frequently and systematically they would introduce bias in data mining models threatening the external validity of any study that builds on such data: Predicting the most error-prone files, for instance, may actually yield files most prone to new features. But how often does such misclassification occur? And does it actually bias analysis and prediction?
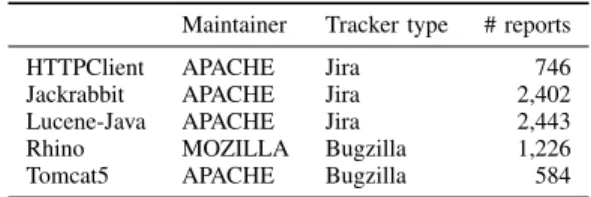
TABLE I PROJECT DETAILS.
Maintainer Tracker type # reports
HTTPClient APACHE Jira 746
Jackrabbit APACHE Jira 2,402
Lucene-Java APACHE Jira 2,443
Rhino MOZILLA Bugzilla 1,226
Tomcat5 APACHE Bugzilla 584
These are the questions we address in this paper. From five open source projects (Section II), we manually classified more than 7,000 issue reports into a fixed set of issue report categories clearly distinguishing the kind of maintenance work required to resolve the task (Section III). Our findings indicate substantial data quality issues:
Issue report classifications are unreliable. In the five bug databases investigated, more than 40% of issue reports are inaccurately classified (Section IV)
Every third bug is not a bug. 33.8% of all bug reports do not refer to corrective code maintenance (Section V). After discussing the possible sources of these misclassifica-tions (Section VI), we turn to the consequences. We find that the validity of studies regarding the distribution and prediction of bugs in code is threatened:
Files are wrongly marked to be error-prone. Due to mis-classifications, 39% of files marked as defective actually have never had a bug (Section VII).
Files are wrongly predicted to be error-prone. Between 16% and 40% of the top 10% most defect-prone files do not belong in this category after reclassification (Section VIII).
Section IXdetails studies affected and unaffected by these issues. After discussing related work (Section X) and threats to validity (Section XI), we close with conclusion and conse-quences (Section XII).
II. STUDYSUBJECTS
We conducted our study on five open-source JAVA projects described in Table I. We aimed to select projects that were under active development and were developed by teams that follow strict commit and bug fixing procedures similar to in-dustry. We also aimed to have a more or less homogenous data
Inspection Merged
All issue reports classified by first author.
Second author classifies all reports marked as misclassified by first author (without knowing the new category).
Both authors compare
classification results and merge conflicts. First author
Inspection
Second author Classification Conflicts
Fig. 1. The manual report inspection process.
set which eased the manual inspection phase. Projects from APACHE and MOZILLA seemed to fit our requirements best. Additionally, we selected the five projects such that we cover at least two different and popular bug tracking systems: Bugzilla1 and Jira2. Three out of five projects (Lucene-Java, Jackrabbit, and HTTPClient) use a Jira bug tracker. The remaining two projects (Rhino, Tomcat5) use a Bugzilla tracker.
For each of the five projects, we selected all issue re-ports that were marked as being RESOLVED, CLOSED, or VERIFIED and whose resolution was set to FIXED and performed a manual inspection on these issues. We disregarded issues with resolution in progress or not being accepted, as their features may change in the future.
The number of inspected reports per project can be found inTable I. In total, we obtained 7,401 closed and fixed issue reports. 1,810 of these reports originate from the Rhino and Tomcat5 projects and represent Bugzilla issue reports. The remaining of the 5,591 reports were filed in a Jira bug tracker.
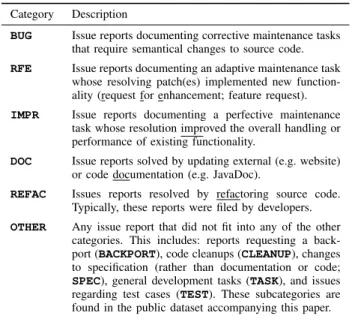
III. MANUALLYCLASSIFYINGBUGREPORTS To validate the issue categories contained in the project’s bug databases, we manually inspected all 7,401 issue reports and checked if the type of each report reflects the maintenance task the developer had to perform in order to fix the issue. For our manual inspections, we used (a) the issue report itself, (b) all the attached comments and discussions, as well as (c) the code change that was applied to the source code. We analyzed code changes if and only if neither the issue report nor its comments clarified the underlying problem of the reported issue. Each issue report was then categorized into one of eleven different issue report categories shown in Table II.
To assign issue reports to one of the categories, we used afixed set of rulesthat describe how to classify issue reports based on specific issue report properties. If none of these rules applied, and if an attached patch did not unveil the original problem, we left the original category unchanged. Hence, we favored possible original misclassification noise over new misclassification noise introduced by manual misclassification. The rule set used for classification is shown inTable III. For each category, we also present a typical real world example.
1http://www.bugzilla.org/ 2http://www.atlassian.com/JIRA
TABLE II
THE ISSUE REPORT CATEGORIES USED FOR MANUAL CLASSIFICATION. Category Description
BUG Issue reports documenting corrective maintenance tasks that require semantical changes to source code.
RFE Issue reports documenting an adaptive maintenance task whose resolving patch(es) implemented new function-ality (request for enhancement; feature request).
IMPR Issue reports documenting a perfective maintenance task whose resolution improved the overall handling or performance of existing functionality.
DOC Issue reports solved by updating external (e.g. website) or code documentation (e.g. JavaDoc).
REFAC Issues reports resolved by refactoring source code. Typically, these reports were filed by developers.
OTHER Any issue report that did not fit into any of the other categories. This includes: reports requesting a back-port (BACKPORT), code cleanups (CLEANUP), changes to specification (rather than documentation or code;
SPEC), general development tasks (TASK), and issues regarding test cases (TEST). These subcategories are found in the public dataset accompanying this paper.
The manual classification was conducted in three phases as shown inFigure 1:
1) In the first phase, the first author inspected all 7,401 issue reports and assigned a report category using the set of report classification rules.
2) In the second phase, the second author re-classified the set of issue reports that were considered to be misclassified after phase one. Again, the second author was using the fixed set of classification rules and the issue reports only; he had no access to the classification results of the first phase. Overall, 3,093 misclassification candidates got reinspected.
3) We then compared the classification results from phase one and phase two to detect classification conflicts—issue reports that were classified differently by the first and the second author. This affected 340 of the 3,093 re-inspected issue reports; the other 94% were independently classified identically by the first and second author and thus validated the accuracy and complexness of the rule set. Each classification conflict finally got resolved by a joint pair-inspection of both authors, partially inducing clarification and refinements of the rule set. (Table III
lists the final rule set.)
The first and second phase of the inspection process were processed by one individual each. This ensures that all is-sue reports across all projects are treated and categorized equally. Every issue report reported as misclassified in this paper was independently verified. We did not double check whether the first author did oversee misclassified reports. This implies that the presented misclassification ratios and impact measurements can be considered as a lower bound. The effort for the 10,884 inspections was 4 minutes per issue report on average, totaling 725 hours, or 90 working days.
TABLE III CLASSIFICATIONRULES A report is categorized asBUG(Fix Request) if. . .
1) it reports aNullpointerException(NPE).
2) the discussion concludes that code had to be changed semantically to perform a corrective maintenance task.
3) it fixes runtime or memory issues cause by defects such as endless loops.
Example:Tomcat5 report281473is categorized asRFEbut reports a bug that causes
a “JasperException for jsp files that are symbolic links”. The underlying issue was that tomcat used canonical instead of absolute paths. The applied fix touches one line replacing one method invocation. According to Rule2, we classified the applied code change as a corrective maintenance task and thus the issue report asBUG.
A report is categorized asRFE(Feature Request) if. . . 1) it requests to implement a new access/getter method. 2) it requests to add new functionality.
3) it requests to support new object types, specifications, or standards.
Example:Lucene-Java reportLUCENE-20744is categorized asBUG. But the applied
patch and the discussion unveil that a new versioning mechanism had to be implemented. The first comment by Uwe Schindler makes it explicit: “Here the patch. It uses an interface containing the needed methods to easyliy [sic] switch between both impl. The old one was deprecated [...]”. This is reclassified asRFEby Rule2.
A report is categorized asIMPR(Improvement Request) if. . .
1) it discusses resource issues (time, memory) caused by non optimal algorithms or garbage collection strategies.
2) it discusses semantics-preserving changes (typos, formatting) to code, log messages, exception messages, or property fields.
3) it requests more or fewer log messages. 4) it requests changing the content of log messages.
5) it requests changing the type and/or the message of Exceptions to be thrown.
6) it requests changes supporting new input or output formats (e.g. for backward compatibility or user satisfaction).
7) it introduces concurrent versions of already existent functionalities. 8) it suggests upgrading or patching third party libraries to overcome issues
caused by third party libraries.
9) it requests changes that correct/synchronize an already implemented feature according to specification/documentation.
Example:Jackrabbit reportJCR-28925is filed asBUGunder the title “Large fetch sizes have potentially deleterious effects on VM memory requirements when using Oracle”. The algorithm fetches data from a database with a large amount of columns and rows, which caused the Oracle driver to allocate a large buffer. The resolution was to develop a new algorithm consuming less memory. This is anIMPRaccording to Rule1since no new functionality was implemented and since the program did not contain any defect.
A report is categorized asDOC(Documentation Request) if. . .
1) its discussion unveils that the report was filed due to missing, ambigu-ous, or outdated documentation.
Example:Tomcat5 bug report300486fixes the problem“Setting compressableMimeTypes is ignored.” by “Docs updated in CVS to reflect correct spelling.” This is aDOC.
A report is categorized asREFAC(Refactoring Request) if. . .
1) it requests to move code into other packages, classes, or methods. 2) it requests to rename variables, methods, classes, packages, or
config-uration options.
Example:Tomcat5 report282867is filed asBUGand contains a patch adding a new interface SSOValve. But in comment 4, Remy Maucherat refuses to apply the patch and the idea to introduce a new interface. Instead, he commits a patch that refactors class AuthenticatorBase to allow subclassing. This is aREFACas per Rule2.
A report is categorized asOTHERif. . .
1) it reports violations of JAVA contracts without causing failures (e.g. “equals()but nohashCode()”).
2) complains about compatibility fixes (e.g. “should compile with GCJ”). 3) the task does not require changing source or documentation (like
packaging, configuration, download, etc.)
Example: Lucene-Java report LUCENE-18938complains that “classes implement
equals() but not hashCode()”. This violated JAVA contracts but does not cause failures. Lucene-Java reportLUCENE-2899requests “better support gcj compilation”. According
to our rules this is considered to be an compatibility improvement classified asOTHER.
TABLE IV
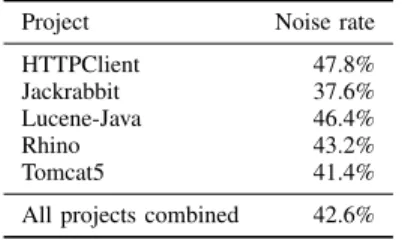
NOISE RATES FOR ALL PROJECTS AND FOR A COMBINED DATA SET.
Project Noise rate
HTTPClient 47.8%
Jackrabbit 37.6%
Lucene-Java 46.4%
Rhino 43.2%
Tomcat5 41.4%
All projects combined 42.6%
IV. AMOUNT OFDATANOISE
In this section, we show the amount of data noise and bias (with respect to issue report types) that is evident in the bug databases of the five analyzed projects (see Section II). We start analyzing the issue report data sets by measuring the false positive rates and slicing individual categories to show how many issue reports were misclassified and which categories these misclassified reports belong to. Later, we will discuss the impact and bias rates for data sets that map issue report to code changes and source files. At the end, we will show how a simple model identifying the most defect-prone files is impacted by misclassified bug reports.
As overall noise rate we measured the false positive rate. The false positive rate represents the ratio between misclassi-fied issue reports and all issue reports in the data set. The noise rate is independent from individual issue report categories. We will discuss individual categories inSection V. The higher the noise rate, the higher the threat that the noise might cause bias in approaches based on these data sets.
RQ1 Do bug databases contain data noise due to issue report misclassification, and how much?
Table IV shows the noise rate values for all five projects and for a combined data set containing the issue reports of all five projects. The noise rates for all projects lie between 37% and 47% and are surprisingly similar. The overall noise rate lies at 42.6%—that is, two out of five issue reports are wrongly typed. This unexpected high ratio raises threats to any approach based on raw issue report data sets.
Over all five projects researched, we found 42.6% of all issue reports to be wrongly typed.
The noise rates of the individual report categories and their variances are shown in Figure 2 as box plot. We excluded the categories DOC and REFAC from this plot since none of the analyzed bug tracking systems supported these report categories. The boxes representing the categories IMPR and
OTHER are based on the Jira projects only since Bugzilla does not support these report categories. The noise rate for
3https://issues.apache.org/bugzilla/show bug.cgi?id=28147 4https://issues.apache.org/jira/browse/LUCENE-2074 5https://issues.apache.org/jira/browse/JCR-2892 6https://issues.apache.org/bugzilla/show bug.cgi?id=30048 7https://issues.apache.org/bugzilla/show bug.cgi?id=28286 8https://issues.apache.org/jira/browse/LUCENE-1893 9https://issues.apache.org/jira/browse/LUCENE-289
0 20
40 60
BUG IMPR OTHER RFE
no ise ra te o ve r al l p ro je ct s
Fig. 2. The noise rates split by category over all projects. The categories
DOC and REFACare not present since none of the bug trackers supports these categories. The Bugzilla projects are only included in the analysis of
BUGandRFEreports since Bugzilla does not support any of the other issue report categories.
BUG reports is stable across all projects. Although the noise rates for IMPRreports show more variance all projects show comparable noise rates. The variance for RFEreports is huge and is partially caused by the fact that the overall number of RFE is low. Most feature requests have their origin from within the project, especially in open source projects, and it is questionable if such feature requests are documented using a bug tracker.
V. BUGS VS. FEATURES
We have seen that two out of five issue reports are misclas-sified. And we have seen that there exist misclassified BUG
reports. This is a threat for all empirical studies based on raw, unchecked bug data sets. To raise the level of detail, we sliced issue categories to show how the percentage of issue reports that were associated with a category but marked as misclassified. We also include the individual categories the reclassified bug report belongs to when using our classification rule sets shown inTable III.
RQ2 Which percentage of issue reports associated with a category was marked as misclassified? Which category do these misclassified reports actually belong to? Each slice contains the set of all issue reports originally associated to a given category and shows to which category the individual issue report actually belong to (TablesV—VII). Thus, each slice table cell contains the percentage of issue reports originally associated to a given category that were manually classified into the issue category indicated by the row name. The length of the bars behind the percentage numbers represent the individual percentage visually. The last row of each slice states the percentage of reports originally associated to the corresponding category that were assigned a different
category during manual classification. The values of this last row correspond to the category boxes in the box plot shown inFigure 2
A. Bugs
Table V contains the noise rate slice for the BUG issue category. We already discussed in Section IV that the noise rate for BUGreports is surprisingly stable across all projects. Tracking bug reports and their target categories shows that 13% ofBUG reports are manually classified into the OTHER
category containing multiple sub-categories (seeSection III). Between 13% and 6% of filed BUGreports are improvement requests and up to 10% contain documentation issues. The fraction of bug reports containing feature requests lies between 2% and 7%. The striking number, however, is that on average 33.8% of all issue reports are misclassified.
Every third bug report is no bug report.
The noise rate slice for bug reports is of great importance. Bug reports are one of the most frequently used instru-ments to measure code quality when being mapped to code changes. But feature requests, improvement requests, and even documentation issues can also be mapped to code changes implementing a new feature, implementing an improvement, or fixing code comments. Thus, we cannot rely on natural filtering mechanisms that rule out misclassified BUG reports belonging to any report category that will not cause code changes being applied to source files. Studies that use bug data sets might be impacted by data noise as shown in Table V. The noise rates in this section include issue reports that might not be mapped to code changes or files. We will discuss the bias caused by bug data noise later in this paper.
B. Feature Requests
The noise rate slice for issues originally categorized as
RFEis interesting because it shows a fundamental difference between Bugzilla and Jira trackers. As you can see inTable VI
the false positive rates for all three Jira projects lie between zero and nine percent. The corresponding false positive rates jump to 57% and 60% for Bugzilla trackers. Interpreting these values, it seems that issue reports in Bugzilla trackers are less reliable than Jira reports. This matches the fact that the false positive rates for BUG reports in Table V where larger for Bugzilla trackers, too. By default, Bugzilla trackers support less issue report types than Jira. This has the consequence that reporters and developers that file issue tickets not being bug reports use the only alternative labelRFE.
C. Improvement Requests
The last noise rate slice shows how many improvement requests were differently categorized during manual inspection (see Table VII). The columns for Bugzilla tracker projects remain zero since by default Bugzilla trackers do not sup-port these issue categories. For the remaining three projects, between 19% and 45% of improvement requests were manu-ally categorized as RFE issue reports. Only a very marginal
TABLE V
RECLASSIFICATION OF REPORTS ORIGINALLY FILED ASBUG
Classified category HTTPClient Jackrabbit Lucene-Java Rhino Tomcat5 combined
BUG 63.5% 75.1% 65.4% 59.2% 61.3% 66.2% RFE 6.6% 1.9% 4.8% 6.0% 3.1% 3.9% DOC 8.7% 1.5% 4.8% 0.0% 10.3% 5.1% IMPR 13.0% 5.9% 7.9% 8.8% 12.0% 9.0% REFAC 1.7% 0.9% 4.3% 10.2% 0.5% 2.8% OTHER 6.4% 14.7% 12.7% 15.8% 12.9% 13.0% Misclassifications 36.5% 24.9% 34.6% 40.8% 38.7% 33.8% TABLE VI
RECLASSIFICATION OF REPORTS ORIGINALLY FILED ASRFE
Classified category HTTPClient Jackrabbit Lucene-Java Rhino Tomcat5 combined
BUG 0.0% 0.7% 0.0% 3.6% 8.1% 2.8% RFE 100.0% 91.3% 97.0% 42.9% 39.6% 72.6% DOC 0.0% 2.0% 0.0% 0.0% 18.1% 5.3% IMPR 0.0% 0.7% 0.6% 19.0% 20.8% 8.6% REFAC 0.0% 0.0% 0.0% 15.5% 3.4% 3.2% OTHER 0.0% 5.3% 2.4% 19.0% 10.1% 7.5% Misclassifications 0.0% 8.6% 3.0% 57.1% 60.4% 24.7% TABLE VII
RECLASSIFICATION OF REPORTS ORIGINALLY FILED ASIMPR.
Classified category HTTPClient Jackrabbit Lucene-Java Rhino Tomcat5 combined
BUG 2.6% 2.8% 1.8% 0.0% 0.0% 2.3% RFE 45.3% 18.8% 28.6% 0.0% 0.0% 26.1% DOC 11.6% 3.7% 7.2% 0.0% 0.0% 6.2% IMPR 26.7% 45.6% 35.2% 0.0% 0.0% 38.8% REFAC 4.3% 9.2% 14.2% 0.0% 0.0% 10.9% OTHER 9.5% 19.8% 13.0% 0.0% 0.0% 29.4% Misclassifications 73.3% 54.4% 64.8% 0.0% 0.0% 61.2%
low fraction of 2% were manually classified as bug reports. On average, more than 60% of improvement requests were reclassified during manual inspection.
VI. SOURCES OFMISCLASSIFICATION
The misclassification ratios presented in the last section shed a low light on the data quality of bug databases. But why do bug tracking systems contain so many misclassified reports? For us, the main reason is that users and developers have very different views and insights on bug classification, and that classification is not rectified once a bug has been resolved.
Bug tracking systems are a communication tool that allow users to file bug reports that will be fixed by developers. But users and developers do not share the same perspective regarding the project internals. In many cases, users have no project insight at all and might not even have the ability to understand technical project details. Users tend to consider every problem as a bug. From their perspective, the software does not comply with their expectations or with the provided documentation and so they file a bug report. A user filing an issue report might not even know the difference between improvement, feature request, or bug report. But it is the reporter who assigns an issue category.
On the other side, the developer is the expert of any technical detail of the program; she designed and implemented it. This difference between reporter and resolver already is a source of uncertainty. In contrast to a reporter, a developer cer-tainly has the ability to distinguish between different problems and the required maintenance task required to solve the issue. The developer would be the right person to categorize issue reports. But this is not how bug trackers work. Of course, the developer could change the issue category after resolution— but this happens rarely. In many cases there exists no real motivation to change the issue category once the cause for a problem is found and fixed.
This conceptional problem explains many of the misclas-sification patterns we observed during manual inspection. It also explains the high misclassification noise rates for orig-inally BUG reports. Using their default configuration, many bug tracking systems set the report type to BUG by default. Combining this technical limitation with the above discussed problem that the potentially more unexperienced communica-tion partner decides which report type to be assigned, we are left with many BUG reports that should have been filed as improvement request or even feature request.
impact issue reports that can actually be mapped to source code changes and thus to source files. Consider a user filing a bug report complaining about a documentation issue. To resolve this issue, the developer might has to change the code documentation contained in the source file. So we would map a BUG into source code and count it as a bug fix although the plain source code did not change. And this is why DOC
issues originally filed as BUGare dangerous. We cannot rely on automatic filters that rule out any report that did not change any source file.
VII. IMPACT ONMAPPING
The issue report misclassification noise presented in Sec-tion IV can impact studies and tools that use these or similar data sets without validating them. As a first category, we discuss how misclassified issue reports impact approaches that map issue reports to source code changes—for instance, to identify files which had the most bugs in the past.
RQ3 What is the impact of misclassified issue reports when mapping issue reports to source code changes?
For this purpose, we followed the issue report mapping strat-egy described by Zimmermann et al. [2], a mapping method frequently replicated by many studies. Scanning through the commit messages contained in a version archive, we detect is-sue report identifiers using regular expressions and key words. Once we mapped issue reports to version archive revision, we can identify the set of issue reports that caused a change within the source file. Ignoring report severity we then count the number of distinct issue reports originally classified asBUG
(num original bugs) for each source file of a given software project. Additionally, we count the number of distinct issue reports that were classified as BUG during manual inspection (num classified bugs). We measure the issue mapping bias using five different bias measurements.
MappingBiasRate: This bias rate expresses the percentage of false positive original BUGreports that could be mapped to code files. The mappingBiasRate corresponds to the false positive rates shown in Figure 2 but is limited to
BUGreports that can be mapped to code changes. DiffBugNumRate: ThediffBugNumRaterepresents the
num-ber of files for which
num original bugs−num classified bugs6= 0.
The measure ignores source files for which the set of issue reports differ but the size remains equal. Counting the number of fixes does not require the individual report to be known.
MissDefectRate: The missDefectRateis defined as missDefectRate= numMissDefect
numZeroOriginalDefect where numMissDefect represents the number of source files for which no original bug report could be mapped but that have at least one manually classified bug report
assigned and wherenumZeroOriginalDefect is the num-ber of source files having no original bug report assigned. This is measure is important for defect classification models (distinction between has bug or has no bug). FalseDefectRate: Analog tomissDefectRate, we compute the
falseDefectRateas
falseDefectRate= numFalseDefect numOriginalDefect
wherenumFalseDefect is the number of source files that for at least one original bug report assigned but no manu-ally classified bug reports and wherenumOriginalDefect is the total number of source files that got at least one original bug report assigned.
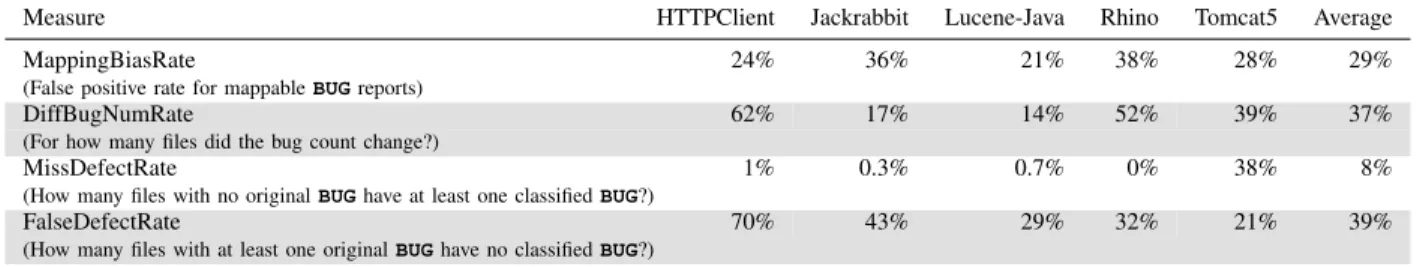
The values of these bias measures for our five target projects are shown in Table VIII along with an additional column containing the average bias measures. For all projects, the number of misclassified BUG reports that can be mapped to source files (mappingBiasRate) lies above 20%. On average, every third mappable bug report is misclassified. This is a threatening high fraction and confirms that the misclassifica-tion noise rates presented inSection IValso affect issue reports that can be mapped to source code changes. On average, the mappingBiasRateis only five percent points below the average false positive rate for bug reports shown in Table V. The mappingBiasRate is also stable across different bug tracking systems indicating that bug tracking systems and their different usage behavior seem to have no impact on the mapping bias. The second row of Table VIII shows the fraction of files having a different number of mapped bug reports. The diff-BugNumRateshows how many files will change their defect-prone ranking. This value might also have severe consequences for defect prediction models based on concrete bug count numbers (seeSection VIII). On average 37% of all source files have biased bug count numbers. For the projects HTTPClient and Rhino thediffBugNumRatewell exceeds the 50% margin. Row three and row four of Table VIII are interesting for approaches using classification models grouping source files into two groups of defect-prone and non defect-prone entities. The fractions of files that were falsely marked as defect free (missDefectRate) is very low and can be disregarded, except for Tomcat5. But the fraction of false classified defect-prone using a threshold of one to distinguish between defect-prone and non defect-prone entities (falseDefectRate) is significant. 20% to 70% of the original defect-prone marked source files contained no defect. An averagefalseDefectRateof 39% shows that mapping bias is a real threat to any defect prone classification model.
On average, 39% of all files marked as defective actually never had a bug.
To give some more details on the differences between original and classified bug counts (diffBugNumRate), Fig-ure 3 shows stacked bars displaying the distribution of bug count differences among source files. Each stacked bar rep-resents contains intervals reflecting the difference between
TABLE VIII
IMPACT OF MISCLASSIFIED ISSUE REPORTS ON MAPPING STRATEGIES AND APPROACHES
Measure HTTPClient Jackrabbit Lucene-Java Rhino Tomcat5 Average
MappingBiasRate 24% 36% 21% 38% 28% 29%
(False positive rate for mappableBUGreports)
DiffBugNumRate 62% 17% 14% 52% 39% 37%
(For how many files did the bug count change?)
MissDefectRate 1% 0.3% 0.7% 0% 38% 8%
(How many files with no originalBUGhave at least one classifiedBUG?)
FalseDefectRate 70% 43% 29% 32% 21% 39%
(How many files with at least one originalBUGhave no classifiedBUG?)
0% 25% 50% 75% 100% HTTPClient Jackrabbit Lucene-Java Rhino Tomcat
num_original_bugs - num_classified_bugs (per file)
[-5,-1] 0 1 2 [3,5] [6,10] [10,30]
% of files
(stacked bars increasingly ordered by intervals)
Fig. 3. The stacked bars show thediffBugNumRatesand their frequencies across all five projects. For files with adiffBugNumRateof zero the number of associated bugs remained equal. Files with a positive diff rate had too many bug reports assigned.
num original bugs−num classified bugs. A positive differ-ence indicates that the number of defects fixed in the corre-sponding source files is actually lower. For files showing a negative difference more defect fixes could have been found.
VIII. IMPACT ONBUGPREDICTION
The results presented in the last section indicate that defect prediction models based on bug data sets noised by bug misclassification might be severely biased. To verify this threat, we conducted an experiment that uses a simple quality model that identifies the most defect-prone source files by counting the number of distinct bug reports mapped to the corresponding file. If we can show that such a simple bug count model is affected, more complex models based on similar count or classification schemata will be affected too. RQ4 How does bug mapping bias introduced by misclassified
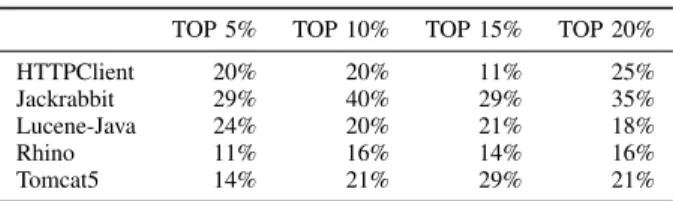
issue reports impact the TOP 5%, 10%, 15%, 20% of most defect prone source files?
The experiment to answer RQ4) is visually described in
Figure 4. We duplicate the set of source files and sort each copy by two different criteria. One set gets sorted in descending order using the number of original bug reports (num original bugs). The other set clone gets sorted in de-scending order using the number of manually classified bug reports (num classified bugs). In each set, the most defect-prone file is the top element. Comparing the top X% of
ORIGINAL RANK CLASSIFIED RANK TOP X%
Fig. 4. The cutoff difference for the top x%.
both file sets (containing the same elements but in potentially different order) allows us to reason about the impact of mapping bias on models using bug counts to identify the most defect-prone entities. Since both cutoffs are equally large (the number of source files does not change, only their ranks), we can define thecutoff difference as:
size of cutoff−size of intersection
size of cutoff .
The result is a number between zero and one where zero indicated that both cutoffs are identical and a value of one would indicate two cutoffs with an empty intersection. A low cutoff difference is desirable.
Table IXcontains thecutoff differencesfor all five projects using the top 5%, 10%, 15%, and 20%. Thecutoff differences is stable across projects and cutoff sizes. Considering the top 5% cutoff the cutoff differences lie between 11% and 29% and raise to a range between 16% and 35% for a cutoff size of 20%. The variance between the different cutoff sizes per project lies around 15% for HTTPClient and Tomcat5 and 5% for Lucene-Java and Rhino. But the bias measured for all projects and cutoffs lies well above 10%. The comparable relative stable results across all projects and cutoff sized show that quality measuring approaches using biased report to code mappings would report a false positive rate between 16% and 40% for the top 10% most defect-prone files.
When predicting the top 10% most defect-prone files, 16% to 40% of the files do not belong in this category
because of misclassification.
Table Xshows the Spearman rank correlations for all source files in the corresponding intersections. These rank correlations indicate the relative order for those files that remain in the top
TABLE IX
THE CUTOFF DIFFERENCES FOR ALL FIVE PROJECTS. TOP 5% TOP 10% TOP 15% TOP 20%
HTTPClient 20% 20% 11% 25% Jackrabbit 29% 40% 29% 35% Lucene-Java 24% 20% 21% 18% Rhino 11% 16% 14% 16% Tomcat5 14% 21% 29% 21% TABLE X
SPEARMAN RANK CORRELATIONS FOR ALL SOURCE FILES REMAINING IN THE INTERSECTION OF ORIGINAL AND CLASSIFIED MOST DEFECT-PRONE
ENTITIES.
TOP 5% TOP 10% TOP 15% TOP 20%
HTTPClient 1 0.8 0.8 0.7
Jackrabbit 0.2 0.3 0.5 0.6
Lucene-Java 0.4 0.5 0.4 0.2
Rhino −0.1 0.7 0.4 0.4
Tomcat5 0.8 0.5 0.5 0.6
X% most defect-prone source files. A correlation value of one would mean that there exist files that should not belong to the top cutoff but at least the relative order of the correctly classified files remains stable. For HTTPClient this is indeed the case. For all four cutoff sizes, the rank correlations remain above 0.7. For all other projects, the rank correlations lie below 0.7 (except Rhino top 10%) and reach correlation values close to zero and even below zero.
Misclassification also impacts the relative order of the most defect-prone files.
IX. IMPLICATIONS ONEARLIERSTUDIES
The results presented in the previous sections show that misclassified issue reports affect the assessment and prediction of code quality based on bug data sets. Hence, empirical studies that use or used bug data sets without validating them might suffer from bias.
A. Studies threatened to be biased
Mapping bugs to code changes was first introduced by Fischer et al. [3] and ˇCubrani´c et al. [4] who described procedures to created a release history database from version control and bug tracking systems and to map bug reports to code changes. These two approaches do not interpret the mapped artifacts and are per se not threatened; however, any study using one of these approaches to derived code quality measures is likely to be threatened if it did not perform additional data validation.
The list of papers affected encompasses much of the pub-lished literature in mining software archives of the past years; as of August 2012, the ACM digital library lists more than 150 published studies citing these two approaches. Zimmer-mann et al. [2] is a particular important case, as a large number of papers built on the accompanying (now found to be biased) bug data set. Taking the blame, other typical examples with one of us as co-authors are: [5], [6], [7], [8], [9].
The threat to validity for all these papers is that the bug data set they have been evaluated on contains a mix of bugs and non-bugs. Hence, in their evaluation, they map and predict non-bugs as well as bugs. Users would be generally interested in predicting bugs rather than non-bugs, however; and we now no longer know how these approaches perform and compare when using a data set consisting only of true bugs. This threatens their external validity.
Construct and internal validity remain unquestioned, though: the approaches and techniques are still original and valid, and can still provide good results. It may even be that filtering out non-bugs yields less noise in terms of predictor features, and thus generally improves results. Assessing such effects for all earlier studies is beyond the scope of this paper; however, we provide rectified data for future studies.
How about studies using industrial bug data? Since we have no insights on the data quality of industrial data sets, we do not consider studies based on such sets as threatened in the first place. In general, one might hypothesize that industry has stronger process rules and incentives (speak: measurements and goal metrics) which encourage accurate issue classification. This could also explain why predictors such as change bursts [8] or network metrics [10] work extremely well on industrial data sets, but poorly on open source data sets. Exploring the quality of such data sets and differences between industrial and open source projects again is a topic for future research.
B. Preventing misclassification threats
How can we improve the quality of bug datasets? The following approaches all help:
Test cases. Approaches like iBugs [11] validate bug reports using test cases to replicate bugs. This straight-forward filtering mechanism ensures each bug is valid. Conse-quently, studies relying on the iBugs data sets are not affected by issues discussed in this paper.
Code history. Kim et al. [12] uses version control history to verify that applied code changes are actual fixes. This approach solely relies on code evolution and thus is not sensitive to bug database issues. Again, this is a recommended procedure to prevent misclassification. Automatic classification. Automatic classification models as
described by Antoniol et al. [1] can be used to categorize issue reports based on the text of the issue report itself with precision rates between 77% and 82%. Although, constructing classification training sets requires initial human effort, such predictors should quickly reduce the required human interaction.
Rectified Data Sets. Our data sets rectified by manual bug classification are publicly available (Section XII); we encourage their use for further research.
We strongly recommend to use additional data (e.g. tests) ot human effort to reduce the high amount of misclassified issue reports. This means that the contributions of the mining software archive field can still all be applied; one just needs a bit of validation in the first place.
X. RELATEDWORK
Bug reports are a key factor of software maintenance. Many mining approaches are based on bug databases in some way, either as standalone artifact or as a combination between bug reports and code changes. The quality of bug reports is frequently topic of research studies [13], [14], [15], [16]. Many of these studies show that bug reports often contain too little or too incomplete information in order to reproduce and fix them. It is possible to automatically detect bug report duplicates [17], [18] that, when combined, might fill information gaps that prevent bug report fixes. But bug fixes have also been used to estimate development efforts [19], [20], [21], [22], bug triage [23], [24] or automatic bug assignment [25], [26].
Combining bug reports to source code changes opens the possibility to map bug fixes to individual code artifacts. Fischer et al. [3] and Cubranic and Murphy [27] were among the first that introduced heuristics that allow mapping bug reports to applied code changes. But as Mockus [28] and Liebchen and Shepperd [29] mentioned, data quality in empirical software engineering can be low and might impact the outcome of many empirical studies. Liebchen and Shepperd [29] found that only a tiny fraction of software engineering papers suggest data quality issues and their possible effect on their analysis results. Nguyen et al. [30] reported similar issues on commercial projects that usually follow more strict development guidelines compared to open source projects.
Improving the mapping strategies used to link bug reports to code changes is an important step to reduce the fraction of misclassified issue reports. Bird et al. [31] developed a tool that allows to manually annotate bug reports and code changes to reduce the overhead of manual data point inspection. Later, Wu et al. [32] developed an automatic link recovery algorithm that learn bug report and code change criteria to recover missing links between bug reports and code changes.
In 2008, Antoniol et al. [1] showed that a significant number of bug reports refer to maintenance tasks which are not cor-rective. With other words, a significant number of bug reports are not documenting software bugs but to other maintenance tasks. This is in particular important since many of the bias reducing approaches are seeking for good and correct mapping strategies but rely on the fact that reported bugs are indeed documenting corrective maintenance tasks. In this paper, we want to extend the research initial conducted by Antoniol et al. [1] by measuring the amount of data noise introduced by misclassified bug reports. We also extend their work by showing the possible impact of misclassified bug report types on bug mapping strategies and machine learning models based on such noised data sets—such as defect prediction models.
XI. THREATS TO VALIDITY
Empirical studies like this one have their own threats to validity. We identified three noteworthy threats:
Manual inspection. First and most noteworthy, the manual inspection phase is crucial. To counter the threat of us making classification mistakes, we chose a setup that
ensures that every misclassified bug report is cross-validated and that classification conflicts have to pass a third inspection. Still, we cannot rule out that the manual inspection contains errors. Additionally, we make our entire dataset available for independent assessment. Classification rules. Second, the set of classification rules is
only one possibility to classify issue reports. There exists no clear definition separating feature and improvement requests. Using a different classification rule set will certainly impact the results presented in this paper. We counter this threat by listing the complete rules verbatim. Study subjects. Third, the projects and bug tracking sys-tems investigated might not be representative, threatening the external validity of our findings. Although Jira and Bugzilla are popular bug tracking systems, we cannot ensure that other projects using the same or even other bug tracking systems contain comparable amount and distribution of misclassified issue reports.
XII. CONCLUSION ANDCONSEQUENCES
Mining software archives has long been seen as the full automation of empirical software engineering—all one needs to do is to point the mining tool at a new data source, and out pop the correlations and recommendations. The findings in this paper suggest widespread issues with the separation of bugs and non-bugs in software archives, which can severely impact the accuracy of any tool and study which leverages such data. The consequences are straight-forward:
• First and foremost, automated quantitive analysis should always include human qualitative analysis of the input data—and of the findings. Approaches relying on bug datasets should be precluded by a careful manual valida-tion of data quality; at least of a significant sample. Data quality should be discussed as a threat to validity.
• Bug prediction models trained and evaluated on biased
data sets are threatened to predict changes instead of bugs. Filtering out non-bugs when estimating code quality might even improve results.
• The categorization of bug reports is dependent on the perspective of the observer. Approaches using bug data sets should be aware of this fact and validate whether the perspective of the prediction model matches the perspective of the bug creator.
Generally, one should always be aware that not all bugs should be treated equal. Many bugs are of little to no conse-quence, while a few ones–such as security or privacy issues— can easily damage the reputation of the entire product or even threaten the existence of the company. Assessing such consequences can not be left to machines alone.
Hence, dealing with bug databases will always require human effort—an investment which, however, pays off in the end. Our motivation for this work was to have a well-classified set of bug reports and features, which we now can leverage (and share) for future research. In the long run, better data will lead to better recommendations, and better recommendations in turn will make developers more conscious of maintaining
data quality—a virtuous circle in which processes and their metrics can improve in unison.
Detailed references, all data sets (original and rectified), all slices and more information can be found at:
http://www.softevo.org/bugclassify Acknowledgments. Juan Pablo Galeotti, Eva May, and Kevin Streit provided useful feedback on earlier revisions of this paper. We also thank Brendan Murphy (Microsoft) and Christian Holler (Mozilla) for insightful discussions and feedback.
REFERENCES
[1] G. Antoniol, K. Ayari, M. Di Penta, F. Khomh, and Y.-G. Gu´eh´eneuc, “Is it a bug or an enhancement? A text-based approach to classify change requests,” inProceedings of the 2008 conference of the center for advanced studies on collaborative research: meeting of minds, ser. CASCON ’08. ACM, 2008, pp. 23:304–23:318.
[2] T. Zimmermann, R. Premraj, and A. Zeller, “Predicting defects for Eclipse,” inProceedings of the Third International Workshop on Pre-dictor Models in Software Engineering, ser. PROMISE ’07. IEEE Computer Society, 2007, pp. 9–.
[3] M. Fischer, M. Pinzger, and H. Gall, “Populating a release history database from version control and bug tracking systems,” inProceedings of the International Conference on Software Maintenance, ser. ICSM ’03. IEEE Computer Society, 2003, pp. 23–32.
[4] D. ˇCubrani´c, G. C. Murphy, J. Singer, and K. S. Booth, “Hipikat: A project memory for software development,”IEEE Trans. Softw. Eng., vol. 31, no. 6, pp. 446–465, Jun. 2005.
[5] J. ´Sliwerski, T. Zimmermann, and A. Zeller, “When do changes induce fixes?” inProceedings of the 2005 international workshop on Mining software repositories, ser. MSR ’05. ACM, 2005, pp. 1–5.
[6] S. Kim, T. Zimmermann, E. J. Whitehead Jr., and A. Zeller, “Predicting faults from cached history,” in Proceedings of the 29th international conference on Software Engineering, ser. ICSE ’07. IEEE Computer Society, 2007, pp. 489–498.
[7] R. Premraj and K. Herzig, “Network versus code metrics to predict defects: A replication study,” inProceedings of the 2011 International Symposium on Empirical Software Engineering and Measurement, ser. ESEM ’11. IEEE Computer Society, 2011, pp. 215–224.
[8] N. Nagappan, A. Zeller, T. Zimmermann, K. Herzig, and B. Murphy, “Change bursts as defect predictors,” inProceedings of the 2010 IEEE 21st International Symposium on Software Reliability Engineering, ser. ISSRE ’10. IEEE Computer Society, 2010, pp. 309–318.
[9] A. Schr¨oter, T. Zimmermann, and A. Zeller, “Predicting component fail-ures at design time,” inProceedings of the 2006 ACM/IEEE international symposium on Empirical software engineering, ser. ISESE ’06. ACM, 2006, pp. 18–27.
[10] T. Zimmermann and N. Nagappan, “Predicting defects using network analysis on dependency graphs,” inProceedings of the 30th international conference on Software engineering, ser. ICSE ’08. ACM, 2008, pp. 531–540.
[11] V. Dallmeier and T. Zimmermann, “Extraction of bug localization bench-marks from history,” inProceedings of the twenty-second IEEE/ACM international conference on Automated software engineering, ser. ASE ’07. ACM, 2007, pp. 433–436.
[12] S. Kim, E. J. Whitehead, Jr., and Y. Zhang, “Classifying software changes: Clean or buggy?” IEEE Trans. Softw. Eng., vol. 34, no. 2, pp. 181–196, Mar. 2008.
[13] P. Hooimeijer and W. Weimer, “Modeling bug report quality,” in Proceedings of the twenty-second IEEE/ACM international conference on Automated software engineering, ser. ASE ’07. ACM, 2007, pp. 34–43.
[14] N. Bettenburg, S. Just, A. Schr¨oter, C. Weiss, R. Premraj, and T. Zim-mermann, “Quality of bug reports in Eclipse,” inProceedings of the 2007 OOPSLA Workshop on Eclipse Technology eXchange, October 2007. [15] N. Bettenburg, S. Just, A. Schr¨oter, C. Weiss, R. Premraj, and T.
Zim-mermann, “What makes a good bug report?” inProceedings of the 16th ACM SIGSOFT International Symposium on Foundations of software engineering, ser. SIGSOFT ’08/FSE-16. ACM, 2008, pp. 308–318.
[16] P. J. Guo, T. Zimmermann, N. Nagappan, and B. Murphy, “Characteriz-ing and predict“Characteriz-ing which bugs get fixed: an empirical study of microsoft windows,” inProceedings of the 32nd ACM/IEEE International Confer-ence on Software Engineering - Volume 1, ser. ICSE ’10. ACM, 2010, pp. 495–504.
[17] P. Runeson, M. Alexandersson, and O. Nyholm, “Detection of duplicate defect reports using natural language processing,” inProceedings of the 29th international conference on Software Engineering, ser. ICSE ’07. IEEE Computer Society, 2007, pp. 499–510.
[18] X. Wang, L. Zhang, T. Xie, J. Anvik, and J. Sun, “An approach to detecting duplicate bug reports using natural language and execution information,” in Proceedings of the 30th international conference on Software engineering, ser. ICSE ’08, 2008, pp. 461–470.
[19] C. Weiss, R. Premraj, T. Zimmermann, and A. Zeller, “How long will it take to fix this bug?” in Proceedings of the Fourth International Workshop on Mining Software Repositories, May 2007.
[20] J. J. Amor, G. Robles, and J. M. Gonzalez-Barahona, “Effort estimation by characterizing developer activity,” inProceedings of the 2006 inter-national workshop on Economics driven software engineering research, ser. EDSER ’06. ACM, 2006, pp. 3–6.
[21] H. Zeng and D. Rine, “Estimation of software defects fix effort using neural networks,” in Proceedings of the 28th Annual International Computer Software and Applications Conference - Workshops and Fast Abstracts - Volume 02, ser. COMPSAC ’04. IEEE Computer Society, 2004, pp. 20–21.
[22] E. Giger, M. Pinzger, and H. Gall, “Predicting the fix time of bugs,” inProceedings of the 2nd International Workshop on Recommendation Systems for Software Engineering, ser. RSSE ’10. ACM, 2010, pp. 52–56.
[23] D. ˇCubrani´c, “Automatic bug triage using text categorization,” in In SEKE 2004: Proceedings of the Sixteenth International Conference on Software Engineering Knowledge Engineering. KSI Press, 2004, pp. 92–97.
[24] J. Anvik and G. C. Murphy, “Reducing the effort of bug report triage: Recommenders for development-oriented decisions,”ACM Trans. Softw. Eng. Methodol., vol. 20, no. 3, pp. 10:1–10:35, Aug. 2011.
[25] J. Anvik, L. Hiew, and G. C. Murphy, “Who should fix this bug?” in Proceedings of the 28th international conference on Software engineer-ing, ser. ICSE ’06. ACM, 2006, pp. 361–370.
[26] P. J. Guo, T. Zimmermann, N. Nagappan, and B. Murphy, ““Not my bug!” and other reasons for software bug report reassignments,” in Proceedings of the ACM 2011 conference on Computer supported cooperative work, ser. CSCW ’11. ACM, 2011, pp. 395–404. [27] D. ˇCubrani´c and G. C. Murphy, “Hipikat: recommending pertinent
software development artifacts,” inProceedings of the 25th International Conference on Software Engineering, ser. ICSE ’03. IEEE Computer Society, 2003, pp. 408–418.
[28] A. Mockus, “Missing data in software engineering,”Guide to Advanced Empirical Software Engineering, pp. 185–200, 2008.
[29] G. A. Liebchen and M. Shepperd, “Data sets and data quality in software engineering,” inProceedings of the 4th international workshop on Predictor models in software engineering, ser. PROMISE ’08. ACM, 2008, pp. 39–44.
[30] T. H. D. Nguyen, B. Adams, and A. E. Hassan, “A case study of bias in bug-fix datasets,” inProceedings of the 2010 17th Working Conference on Reverse Engineering, ser. WCRE ’10. IEEE Computer Society, 2010, pp. 259–268.
[31] C. Bird, A. Bachmann, F. Rahman, and A. Bernstein, “Linkster: en-abling efficient manual inspection and annotation of mined data,” in Proceedings of the eighteenth ACM SIGSOFT international symposium on Foundations of software engineering, ser. FSE ’10. ACM, 2010, pp. 369–370.
[32] R. Wu, H. Zhang, S. Kim, and S.-C. Cheung, “Relink: recovering links between bugs and changes,” in Proceedings of the 19th ACM SIGSOFT symposium and the 13th European conference on Foundations of software engineering, ser. ESEC/FSE ’11. ACM, 2011, pp. 15–25.