ISSN 1479-4403 31 ©Academic Conferences Ltd
Computer-adaptive Test
Mariana Lilley and Trevor Barker
University of Hertfordshire, School of Computer Science, Hatfield, United Kingdom
[email protected] [email protected]
Abstract: In this paper we report on research related to the provision of automated feedback based on a computer adaptive test (CAT), used in formative assessment. A cohort of 76 second year university undergraduates took part in a formative assessment with a CAT and were provided with automated feedback on their performance. A sample of students responded in a short questionnaire to assess their attitude to the quality of the feedback provided. In this paper, we describe the CAT and the system of automated feedback used in our research, and we also present the findings of the attitude survey. On average students reported that they had a good attitude to our automated feedback system. Statistical analysis was used to show that attitude to feedback was not related to performance on the assessment (p>0.05). We discuss this finding in the light of the requirement to provide fast, efficient and useful feedback at the appropriate level for students.
Keywords: computer-assisted assessment, formative assessment, adaptive testing
1. Introduction
The primary purpose of formative assessment is to inform students about their strengths and weaknesses (Morgan et al. 2004, Brown et al. 1997). Formative assessment focuses on providing feedback to students in order that they have opportunities to improve their learning and performance. Formative assessment does not usually contribute towards the final grade of the module or course concerned. The term summative assessment is commonly employed to describe any assessment that contributes to the final marks for a module or course. Morgan et al. (2004), Brown et al. (1997) and Yorke (2003) suggest that formative assessment and consequent formative feedback have the potential to enhance the student learning experience, even to the extent that it might contribute towards student retention (Yorke 2001). However, larger cohorts and resulting workload pressures on academic staff often result in limited opportunities for formative assessment and feedback.
A potential solution to provide an adequate provision of formative assessment opportunities would be the use of computerised formative assessment and feedback. Positive results for this approach have been reported by Charman (2002), Sly and Rennie (2002) and Steven and Hesketh (2002). In this paper we present our approach to the provision of automated formative assessment and feedback using a computer-adaptive test (CAT). Clearly, a critical consideration was whether or not the students found it useful, and this is the focus of this paper.
2. Computer-adaptive testing
Computer-adaptive test (CAT) is a form of computer-assisted assessment where the level of difficulty of the questions administered to individual test-takers is dynamically tailored to their proficiency levels. In general terms, a CAT usually starts with a question of medium difficulty. Correct responses will usually cause a more difficult question to follow. Conversely, an incorrect response will trigger a less difficult question to be administered next. CAT software applications are based on Item Response Theory (IRT). IRT is beyond the scope of this paper and the interested reader is referred to Lord (1980) and Wainer (2000).
Wainer (2000), Conejo et al. (2000), Fernandez (2003), Brusilovsky (2004) amongst others have reported on the benefits of the CAT approach across a wide range of educational settings. This paper focuses on a CAT software prototype designed, implemented and evaluated at the University of Hertfordshire (Lilley et al. 2004). The CAT software prototype introduced here comprises a graphical user interface, an adaptive algorithm based on the Three-Parameter Logistic (3-PL) model from IRT and a database of questions. The database of questions is employed to store information about question stem, distractors, key answers, topic area, recommended revision task and values for the parameters required by the 3-PL model (Lord 1980, Wainer 2000). One of the central elements of the 3-PL model is the level of difficulty of the question being answered by the test-taker. For questions with no historical data, an initial value of the difficulty parameter for each question is
defined by subject domain experts ranging from -3 (lowest) to +3 (highest). The expert calibration is based on Bloom’s taxonomy of cognitive skills (Bloom 1956) as illustrated in Table 1. The level of difficulty estimate is updated after every assessment session based on student performance per question. In general terms, questions that are answered correctly more often have their difficulty ranking lowered and questions that are answered incorrectly more frequently have their difficulty levels increased.
Table 1: Guidelines for expert calibration
Difficulty
(b) Cognitive skill Skill being assessed -3 <= b
<= -1 Knowledge Ability to recall taught material -1 <= b
<= +1
Understanding Ability to interpret and/or translate taught
+1 <= b
<= +3 Application Ability to apply taught material to novel situations
In previous work, we were able to show that the CAT approach is a useful and fair way of assessing students (Lilley and Barker 2003, Lilley and Barker 2004) and that the combination of adaptive testing and automated feedback provides an interesting opportunity to individualise feedback (Lilley et al. 2005). Our approach to the provision of individual feedback is summarised in the next section of this paper.
3. Automated feedback
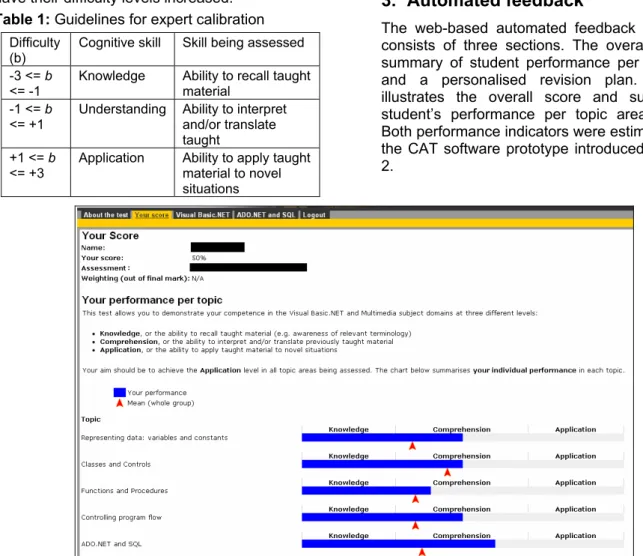
The web-based automated feedback application consists of three sections. The overall score, a summary of student performance per topic area and a personalised revision plan. Figure 1 illustrates the overall score and summary of student’s performance per topic area sections. Both performance indicators were estimated using the CAT software prototype introduced in section 2.
Figure 1: Screenshot illustrating how overall score and performance per topic were displayed within our
feedback tool. The student’s name and module have been omitted. Figures 2 and 3 show examples of personalised
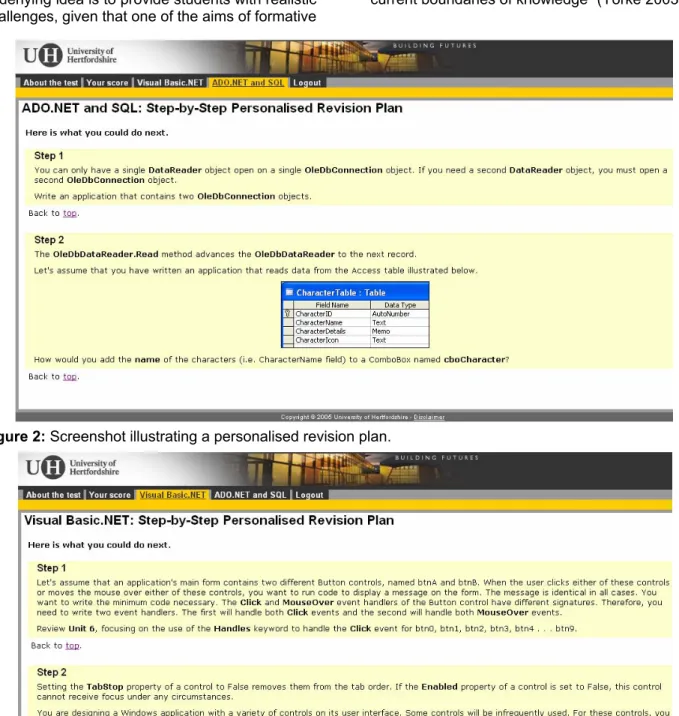
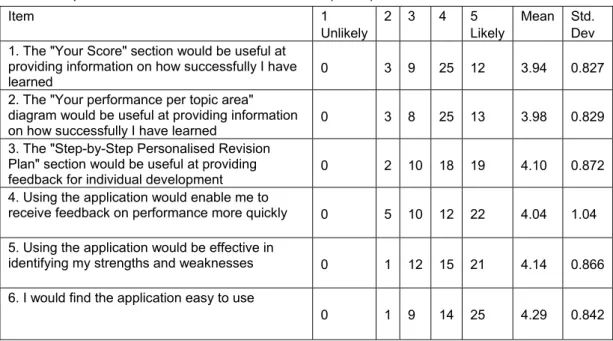
revision plans. For each question answered incorrectly by a student, the relevant revision task is retrieved from the database and listed as part of the personalised revision plan. Although based on the question’s stem, revision tasks do not duplicate the questions. It can be seen from Figures 2 and 3 that the revision tasks involve a range of activities including: writing programs from scratch, reviewing specific lecture or tutorial learning materials and using external resources such as the software vendor online library. In so doing, it is expected that students will be encouraged to learn in different ways.
As discussed in section 2, one of the aims of a computer-adaptive test is to match the level of difficulty of the questions to the proficiency level of individual students. Because students differ in proficiency levels, they are presented with a personalised set of questions. By having one revision task per question, the automated feedback tool introduced here is capable of offering individual students with a set of revision tasks that match their current level of ability within the subject domain. This ensures that less able students are not provided with revision tasks that are too hard and therefore bewildering or frustrating. Similarly, more able students are not presented with revision tasks that are
unchallenging and therefore de-motivating. The underlying idea is to provide students with realistic challenges, given that one of the aims of formative
assessment is to direct students “to go beyond the current boundaries of knowledge” (Yorke 2003).
Figure 2: Screenshot illustrating a personalised revision plan.
Figure 3: Screenshot illustrating a personalised revision plan.
4. The study
A group of 76 Computer Science undergraduates participated in a formative assessment session using our CAT software prototype as part of their regular assessment for a programming module.
The participants had 40 minutes to answer 40 objective questions within the Visual Basic.NET subject domain. The questions were organised into five topic areas, namely ‘Representing data’, ‘Classes and Controls’, ‘Functions and
Procedures’, ‘Controlling program flow’ and ‘ADO.NET’.
In this study, the proficiency levels ranged from -3 (lowest) to +3 (highest). The proficiency level mean was -0.03 (SD=1.02, N=76). All 76 participants received feedback on performance using the automated feedback application described in section 3. It was therefore important to investigate the perceived usefulness and ease of use of the automated feedback application. 4.1 Perceived usefulness and ease of use
of the automated feedback application
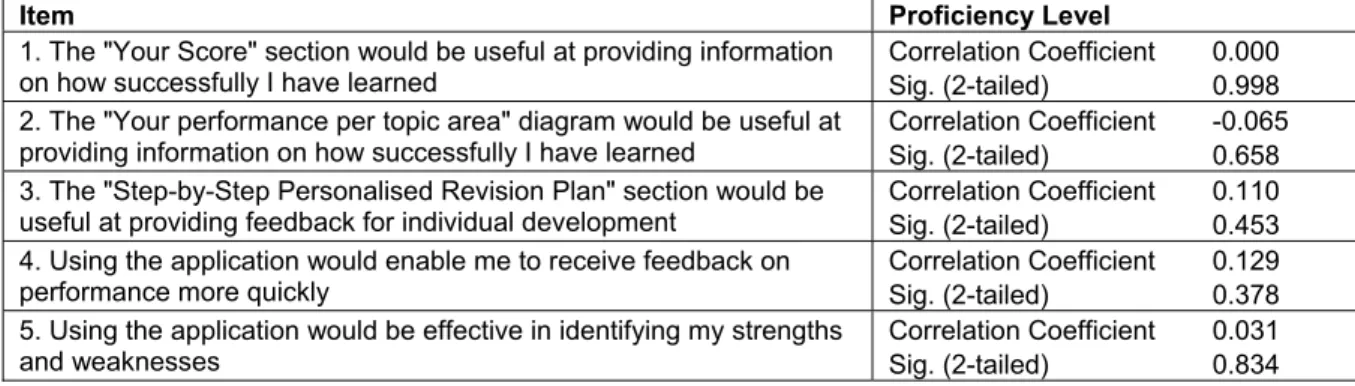
In order to investigate the perceived usefulness and ease of use of the automated feedback application, the participants were invited to complete a questionnaire in which they were asked to rate a series of statements using a Likert scale from 1 (Unlikely) to 5 (Likely). A group of 49 participants from the original group participated in the evaluation and their responses are summarised in Table 2. An important assumption
of our work was that formative assessment to be useful should be timely, support individual development and informs students about their strengths and weaknesses. The results presented in Table 2 show that the application was favourably received by the participant students – on average students thought the feedback approach to be quick and capable of providing useful information for individual development. In addition, the application was perceived as easy to use.
In Table 2, it is interesting to note that the participants deemed the performance per topic as a better indicator of how successfully they have learned than the overall score. One reason for this could be that the former is broken into different topic areas, providing a clearer indication of what has been achieved. However, anecdotal evidence from students suggests that the reason for this is the possibility to gauge how well they have performed in comparison with their fellow students as shown in Figure 1.
Table 2: Students’ perceived usefulness and ease of use (N=49)
Item 1 Unlikely
2 3 4 5 Likely
Mean Std. Dev 1. The "Your Score" section would be useful at
providing information on how successfully I have
learned 0 3 9 25 12 3.94 0.827
2. The "Your performance per topic area" diagram would be useful at providing information
on how successfully I have learned 0 3 8 25 13 3.98 0.829 3. The "Step-by-Step Personalised Revision
Plan" section would be useful at providing
feedback for individual development 0 2 10 18 19 4.10 0.872 4. Using the application would enable me to
receive feedback on performance more quickly 0 5 10 12 22 4.04 1.04 5. Using the application would be effective in
identifying my strengths and weaknesses 0 1 12 15 21 4.14 0.866 6. I would find the application easy to use
0 1 9 14 25 4.29 0.842
The results in Table 2 suggest that students’ perception of the automated feedback provided was good. Students on average found it useful in understanding how successfully they had learned, they found the revision plan helpful. The application was easy to use and the automated feedback was fast and effective in identifying strengths and weaknesses. It was also important to investigate whether or not there was any statistically significant correlation between student performance on the test and perceived usefulness of the feedback application. The student performance results and the feedback
application’s usefulness ratings were subjected to a Spearman's rank order correlation. The results in Table 3 show that there is no statistically significant correlation between student performance and perceived usefulness of the application. This was an important finding, since it is possible that attitude to feedback was related to performance on the assessment. Performing well or badly on an assessment might influence attitude to feedback and introduce bias into the score. Someone performing badly might be less impressed with feedback for example, than someone performing well. The lack of any
relationship between performance and attitude supported our view that the feedback was
acceptable to all students irrespective of their performance.
Table 3: Spearman's rho correlation between perceived usefulness of the feedback provided and
assessment performance (N=49)
Item Proficiency Level
1. The "Your Score" section would be useful at providing information on how successfully I have learned
Correlation Coefficient 0.000 Sig. (2-tailed) 0.998 2. The "Your performance per topic area" diagram would be useful at
providing information on how successfully I have learned Correlation Coefficient Sig. (2-tailed) -0.065 0.658 3. The "Step-by-Step Personalised Revision Plan" section would be
useful at providing feedback for individual development Correlation Coefficient Sig. (2-tailed) 0.110 0.453 4. Using the application would enable me to receive feedback on
performance more quickly
Correlation Coefficient 0.129 Sig. (2-tailed) 0.378 5. Using the application would be effective in identifying my strengths
and weaknesses
Correlation Coefficient 0.031 Sig. (2-tailed) 0.834 The participants were divided into three groups
according to test performance, namely ‘low’, ‘average’ and ‘high’. The data was then subjected to a Kruskal-Wallis test to assess the significance of any differences in attitude between these groups. The results of this statistical analysis are
shown in Tables 4 and 5 below. No significant differences were found between the attitudes of students performing poorly, averagely or highly, supporting the view that the automated feedback application was perceived as being useful, regardless of student performance.
Table 4: Kruskal-WallisTest (N=49)
Item Chi-Square df Asymp. Sig.
1. The "Your Score" section would be useful at providing
information on how successfully I have learned 0.235 2 0.889 2. The "Your performance per topic area" diagram would
be useful at providing information on how successfully I
have learned 1.309 2 0.520
3. The "Step-by-Step Personalised Revision Plan" section would be useful at providing feedback for individual
development 0.924 2 0.630
4. Using the application would enable me to receive
feedback on performance more quickly 0.440 2 0.803
5. Using the application would be effective in identifying my
strengths and weaknesses 0.369 2 0.832
Table 5: Kruskal-WallisTest (N=49)
Item
Student Performance
N Mean
Rank 1. The "Your Score" section would be useful at providing Low 17 25.44 information on how successfully I have learned Average 18 25.69
High 14 23.57
2. The "Your performance per topic area" diagram would Low 17 26.35 Be useful at providing information on how successfully Average 18 26.36
I have learned High 14 21.61
3. The "Step-by-Step Personalised Revision Plan" Low 17 22.47 section would be useful at providing feedback for Average 18 26.28
individual development High 14 26.43
4. Using the application would enable me to receive Low 17 24.38 feedback on performance more quickly Average 18 24.03
High 14 27.00
5. Using the application would be effective in identifying Low 17 23.65
my strengths and weaknesses Average 18 26.39
5. Summary and discussion
This paper is concerned with the use of a computer-adaptive test and automated feedback in a formative assessment context. The work reported here is an extension of a previous study by Lilley, Barker and Britton (2005). In this study, a web-based application was employed to provide students with feedback on performance in a summative assessment context. The present work offers a new perspective by reporting on the perceived usefulness of the adaptive approach and subsequent automated feedback in a formative assessment context.
It has been argued that formative assessment and feedback are central to learning. Despite the predicted benefits of formative assessment, increased class sizes often mean that the opportunities for formative assessment are limited or that the amount of tutor feedback from assessed work is reduced. The use of computer-based and online assessment is also increasing generally in Higher Education, as well as at our university. Feedback from such tests is usually restricted to providing the answers to the questions, with worked examples, either in a handout or at a remedial session in a lecture or in small groups. We argue that our approach to providing feedback provides individual feedback at exactly the level of performance for each student. Feedback provided at a level too high for a student is less than useful if they do not understand basic concepts. Equally there is no point in providing feedback on questions that a student already understands and can answer. With a CAT, students are tested at the boundary between what they understand and what they do not know. This is an important boundary as at this level students have good motivation, neither being discouraged by questions that are too hard, or de-motivated by questions that are too easy. We suggest that by providing feedback at this level, we are not only correcting errors in understanding,
but also we are able to provide links to what individual students need to achieve next in order to increase their understanding of a topic. In this way feedback is being used as scaffolding, helping students to move from what they already know into areas of uncertainty in a steady and measured way.
It is also interesting to note that in a summative assessment undertaken by the same group of students on a related topic a few weeks later, using the same CAT software and feedback application, the proficiency level mean for the summative assessment was 0.21 (SD=1.42, N=76). The mean performance was therefore higher in the summative assessment than that in the formative assessment shown above, (-0.03, SD=1.02, N=76). A paired-samples t-test was used to examine any significant differences in the means for the proficiency level obtained for both assessment sessions. The results of this analysis showed that the observed differences between the proficiency level means were significant and that the differences could not be ascribed to chance alone (t = -2.112, df= 75, Sig. 2-tailed = 0.038). We may speculate as to possible reasons for this difference in performance between the formative and summative assessment sessions. It is likely that students considered the formative assessment as a way of identifying strengths and weaknesses and providing them with information on which topics they should prepare for the summative assessment. In this case it may be argued that the formative assessment had achieved its objectives, as performance was shown to be improved in the later summative test. It is also possible, of course, that students were more likely to revise for a summative test than for a formative one. Another possibility is that students adopt different strategies during the test and that they are more meticulous in their approach when taking summative tests.
References
Bloom B S (1956) Taxonomy of educational objectives. Handbook 1, Cognitive domain: the classification of educational goals. London: Longman.
Brown G, Bull J and Pendlebury M (1997) Assessing student learning in Higher Education. . London: Routledge Falmer. Brusilovsky, P (2004) Knowledge Tree: A Distributed Architecture for Adaptive E-Learning. Proceedings of 13th World
Wide Web Conference, May 17-22, New York, New York, USA, pp. 104-113.
Charman D (2002) Issues and impacts of using computer-based assessments (CBAs) for formative assessment In S Brown, P Race and J Bull, Computer-assisted assessment in Higher Education. London: Kogan Page.
Conejo R, Millán E, Pérez-de-la-Cruz J L. and Trella M (2000) An Empirical Approach to On-Line Learning in SIETTE. Proceedings of 2000 Intelligent Tutoring Systems Conference, Lecture Notes in Computer Science 1839, pp. 605-614.
Fernandez G (2003) Cognitive Scaffolding for a Web-Based Adaptive Learning Environment. Proceedings of 2003 International Conference on Web-based Learning, Lecture Notes in Computer Science 2783, pp. 12–20. Lilley M and Barker T (2003) Comparison between Computer-Adaptive Testing and other assessment methods: An
empirical study. Proceedings of 10th International Conference of the Association for Learning Technology (ALT-C), University of Sheffield, United Kingdom.
Lilley M and Barker T (2004) A Computer-Adaptive Test that facilitates the modification of previously entered responses: An empirical study. Proceedings of 2004 Intelligent Tutoring Systems Conference, Lecture Notes in Computer Science 3220, pp. 22-33.
Lilley M, Barker T and Britton C (2004) The development and evaluation of a software prototype for computer adaptive testing. Computers and Education Journal 43(1-2), pp. 109-122.
Lilley M, Barker T and Britton C (2005) Learners’ and tutors’ perspectives on the usefulness of an automated tool for feedback on test performance. Proceedings of 4th European Conference on e-Learning, Amsterdam, 10-11
November 2005, pp. 181-189.
Lord F M (1980). Applications of Item Response Theory to practical testing problems. New Jersey: Lawrence Erlbaum Associates.
Morgan C, Dunn L, Parry S and O’Reilly M (2004) The student assessment handbook. London: Routledge Falmer. Sly L and Rennie L J (2002) Computer managed learning as an aid to formative assessment in higher education
software In S Brown, P Race and J Bull, Computer-assisted assessment in Higher Education. London: Kogan Page. Steven C and Hesketh I (2002) Increasing learner responsibility and support with the aid of adaptive formative
assessment using QM designer software In S Brown, P Race and J Bull, Computer-assisted assessment in Higher Education. London: Kogan Page.
Wainer H (2000) Computerized Adaptive Testing (A Primer). 2nd Edition. New Jersey: Lawrence Erlbaum Associates. Yorke M (2001) Formative Assessment and its Relevance to Retention. Higher Education Research and Development,
Volume 20, Number 2, 1 July 2001, pp. 115-126(12).
Yorke M (2003) Formative assessment in Higher Education: Moves towards theory and the enhancement of pedagogic practice. Higher Education 45, pp. 477–501.