c
EDP Sciences, 2009
DOI: 10.1140/epjconf/e2009-00910-3
T
HE
E
UROPEAN
P
HYSICAL
J
OURNAL
C
ONFERENCESAir quality and human welfare
K. Sundseth1, J.M. Pacyna1,2, and E.G. Pacyna1
1 Norwegian Institute for Air Research, PO Box 100, 2027 Kjeller, Norway
2 Faculty of Chemistry, Gdansk University of Technology, 11/12 G. Narutowicza Street,
80-952 Gdansk, Poland
Abstract. Human welfare is generally referring to allocation of resources to fit the well being of humans. If high standard of well-being is to be maintained, the concerns for a healthy environment must be balanced against requirements of economic growth. In a natural capital system, human welfare is best served by improving the quality and flow of desired services delivered rather than merely increasing the total money flow. An ecosystem based management of living and natural resource use will steer this progress to the best of human welfare while the efficiency of ecosystem based management depends strongly on the availabil-ity of integrated assessment tools that will combine environmental models and monitoring data with ecological economic valuation methods. In applied welfare economics, the methodological approach to assess resource allocations towards societal optimality and thereby establish criteria for government intervention is often linked to tools as Cost-effectiveness Analysis (CEA), Cost-Benefit Assess-ment (CBA) or Multi-criteria Analysis (MCA). By illustrating an assessAssess-ment on costs and benefits of the implementation of Hg emission reduction measures in the coal sector, it becomes obvious that for a full analysis of societal costs and benefits, several aspects of Hg pollution, sources, impacts and co-benefits need to be considered.
1 Introduction
The purpose of this chapter is to present some basic principles within welfare economy and to give an example on how the net benefit to the society can be affected by air quality and the introduction of emission reduction measures.
2 Some basic principles within welfare economy
and ecological economics
Environmental changes, such as atmospheric changes are directly related and affected by development of economies in its various sectors and geographical regions. Ecological economics, with its two decades of existence and development, treats economy as a subsystem of a larger ecosystem that is finite, non-growing, and materially closed, while open for energy and material flow. At its beginning, ecological economics has focused on criticizing economics from the view-point of ecology. Only recently major development of integrated models started to define in a quantitative and qualitative manner way the relationships between development of economic, energy and environment policies. It has been realized that the environment is not a minor factor of industrial production but a vehicle for the entire economy. A concept of natural capitalism system has been developed in addition to traditional capitalism system. The latter system con-cludes that concerns for a healthy environment are important but must be balanced against
Article published by EDP Sciences and available at http://www.epj-conferences.org
Waste heat
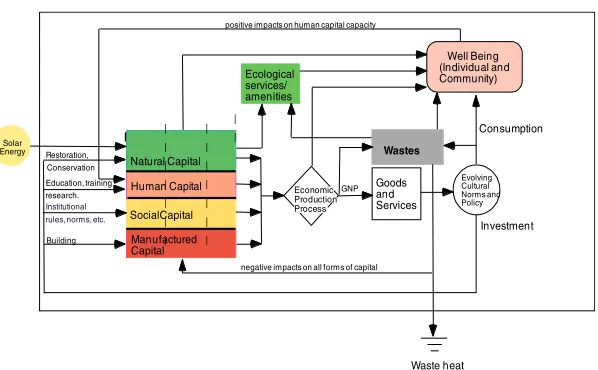
Fig. 1.A description of the expanded model of the ecological economic system.
requirements of economic growth, if high standard of well-being is to be maintained. Natural capitalism system is based on the philosophy that human welfare is best served by improving the quality and flow of desired services delivered rather than merely increasing the total money flow. Ecological economics provides a platform for definition of these services and development of methods for their quantification because these life supporting services have often no market value.
Future economic progress can best take place in democratic market based on systems of production and distribution in which natural capital, social capital, human capital and man-ufactured capital are fully valued. The ecosystem based management of living and natural resource use will steer this progress to the best of human welfare. The efficiency of this man-agement depends strongly on the availability of integrated assessment tools that will combine environmental models and monitoring data with ecological economic valuation methods. Devel-opment of these integrated assessment methods for the benefit of ecosystem based management of living and natural resources and protection of the environment is one of the key challenges for scientists at present. A description of the expanded model of the ecological economic system is presented in figure 1.
With reference from microeconomic theory, human welfare is referring to efficient allocation of resources to fit the well being of humans based on given individual preferences. A welfare improvement means that a given project is leading towards “Pareto optimality”. As defined by Hussen [1]; a “Pareto improvement states that if undertaking a project no member of the society become worse off and at least one becomes better off, the project should be accepted”, or as seen from another point of view; “Pareto improvement states that a project should be considered if, by undertaking it, the gainers from the project can compensate the losers and still remain better off in their economic conditions then they were before”. This criterion can also be referred to as the Kaldor-Hicks criterion or the net benefit criterion.
Total economic value
Use value Non use value
Direct value Benefits consumed directly e.g., -food -health e.g., -water regulation - wind protection
e.g., -biodiversity - habitats
e.g., - loss of environ. values e.g., - endangered species Indirect Functional benefits enjoyed indirectly Future direct and indirect value Value of living use and non -use value to offspring Value from knowledge of continued existence
-Stated preference methods -Revealed preference methods
-Stated preference methods
Option value Bequest value Existence value Total economic value
Use value Non use value
Direct value Benefits consumed directly e.g., -food -health e.g., -water regulation - wind protection
e.g., -biodiversity - habitats
e.g., - loss of environ. values e.g., - endangered species Indirect Functional benefits enjoyed indirectly Future direct and indirect value Value of living use and non -use value to offspring Value from knowledge of continued existence
-Stated preference methods -Revealed preference methods
-Stated preference methods
Option value Bequest value Existence value
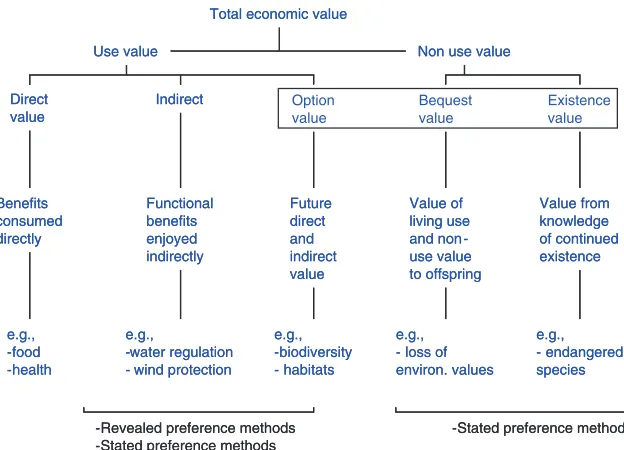
Fig. 2.Classification of economic values.
profitable or Multi-criteria Analysis (MCA) when social effects cannot be assigned to monetary values.
2.1 Monetary valuation of environmental and human health effects
To create a platform for best possible distribution of scarce resources (and thereby steer the economic progress to the best for human welfare), it is necessary to quantify the value of ecosys-tem services in cases where no market value can be (or difficult can be) obtained. Monetary valuation is basically an attempt to associate a currency unit to goods and services provided by the natural environment or damages to these. Since natural capital in most cases provides common goods and services, they are often left outside the markets sphere and they are thus not included in economic analyses.
When associating a currency unit to goods and services provided by the natural environment or their damage, there are three main groups of methods based on use values (direct and indirect) and non-use values:
1. Revealed preferences, 2. Stated preferences, 3. Marked based methods.
2.1.1 Revealed preferences
The value of non market goods can be revealed by observing the consumer’s behavior. Prefer-ences can be directly observed by allowing for market prices (for instance the value of a property or differences in wages) or it can be observed indirectly through travel costs or hedonic tech-niques. Hedonic pricing is based on the assumption that goods traded in the market contains certain attributes or characteristics that allow the consumer to differentiate between sets of goods (bundles) and thus by allowing the impacts to affect the underlying demand for a set of goods by changing the utility of the consumer.
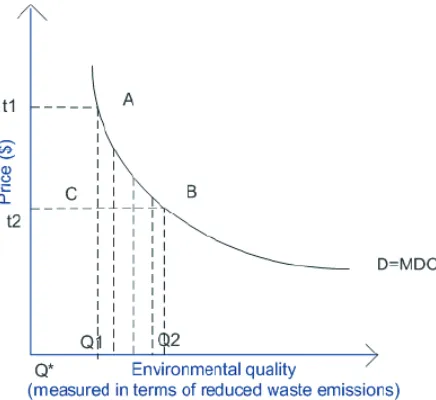
Fig. 3.Demand for improved air quality.
to an area that are not affected by such an improvement. The relationship between markets for housing can be shown by the following equation:
Ri=f(Pi, Ai, Ni, Ei) (1)
Ri represents the price of housing (i) (e.g. rent per unit of time), Pi stands for physical characteristics (e.g. house size, number of rooms etc.), Ni is the neighborhood characteris-tics (e.g. crime rate etc.) and Ei is for instance the air pollution level in the housing area. The implication of the externality will appear if holding all the parameters constant, except for Ei and thereby observing the difference in housing (i) and (j).
Other examples of revealed preferences are;
- the wage difference method which are based on the market of labor instead of the market for real property, and
- the travel cost method, usually applied to measure public recreation preferences by measuring the costs that people bear when visiting a site.
2.1.2 Stated preferences
Stated preferences can either directly be based on contingent valuation, or indirectly through choice experiments. Through interviews, the consumer is asked to choose between different alternatives whereas different characteristics of the alternative are varying due to cost and environmental load.
Contingent valuation can be used as where hypothetical markets are used to analyze the valuation. Peoples choices in a survey reveals their preferences by electing the willingness to pay for the hypothetical provision of a public good or willingness to accept compensation for its hypothetical loss. This method has become one of the most popular valuation methods in environmental economy.
Other examples of stated preferences are;
- the bidding game approach where respondents are asked for the willingness to pay or will-ingness to accept within a single bid system,
- trade-off game which gives the respondent a choice between a base option and a alternative option,
- costless choice where the respondent a is given choice between a natural resource good and an economic good. If the natural resource is chosen, the value of the economic good is the minimum value the respondent value the natural resource good, and
- Delphi techniques which is a sort of panel method which generates opinion of experts.
2.1.3 Market based methods
In reflecting the replacement costs of the lost resource, market based methods can elect peo-ples willingness to pay for avoiding damage. Indirectly, this can be done through measuring prevention costs.
Examples are;
- the human capital approachwhich measure the value of an individual life by his/her potential labor production. The assessment of an impact’s change on people or human health is in focus.
- Productivity change method reflects that the change in an environmental attribute leads to changes in the output of market goods (e.g. improved water quality can increase the quality of the fish stock living in the same lake).
2.2 Discounting costs and benefits
When selecting or deciding for projects, it is necessary to compare the costs and revenues (benefits). Often these costs and revenues are occurring at a different point of time, and it can therefore be suitable to make costs and benefits comparable regardless of when they occur. This is normally done by converting the money flows into present value (PV) terms. The net present value (NPV) is the sum of the discounted costs compared to the discounted benefits. If the discounted benefits exceed the discounted costs, the project can be said to be efficient given that all relevant information is included in the assessment.
The net present value criteria can be described by the following equation:
NP V =−I+B1−C1 1 +r +
B2−C2
(1 +r)2 +· · ·+
Bn−Cn
(1 +r)n >0 (2)
I represent the investment, B is the benefit value, C is the cost value while r is the discount factor which depends on the time value of money and the time preferences.
2.3 Who is bearing the costs?
It is a cost component involved in the assessment of options for reduction of emissions which is linked to the economic costs of introducing the necessary equipment or introducing other nec-essary actions to obtain the reduction. In general, the term “cost” is often used when referring to both private cost (PC) and social cost (SC), where the social cost is the sum of private- and external costs. When taking into account the social cost, this means that all costs in principle need to be internalized in the product price in order to give products their real price. Who is bearing this cost (the producer or the consumer) is determined by price- and market mecha-nisms often referred to as “elasticity”. In general, the analysis of environmental costs can be represented in terms of two figures presented below.
Fig. 4. Differences in prices and produced quantities for marginal private cost (MPC) and marginal social cost (MSC).
and the market demand curve represents the marginal social benefit (MSB) of the produced good. The MSC in turn is the sum of marginal private cost (MPC) and marginal damage cost (MDC) where this later is representing the negative externality caused by producing the good. Hence,
MSC = MPC + MDC.
The intersection of MSC and MSB decides the optimal production level q∗ and the optimal market equilibrium price p* and the level of damage cost is equal to p0 - p∗ leading to a reduction of the consumer surplus. The reduction level of the consumer surplus is depending on the elasticity of both the demand and supply of the product in question. For example, the more elastic the demand, the more production quantity changes and the fewer market prices change. In this case, it is difficult to shift the cost and companies bear more cost. In the case of less elastic demand, the less production quantity changes and the more market price changes. In this case, it is easy to shift the cost so consumers bear more cost. On the other hand, if the supply curve is elastic the change in market price leads to higher change in supply and vice versa.
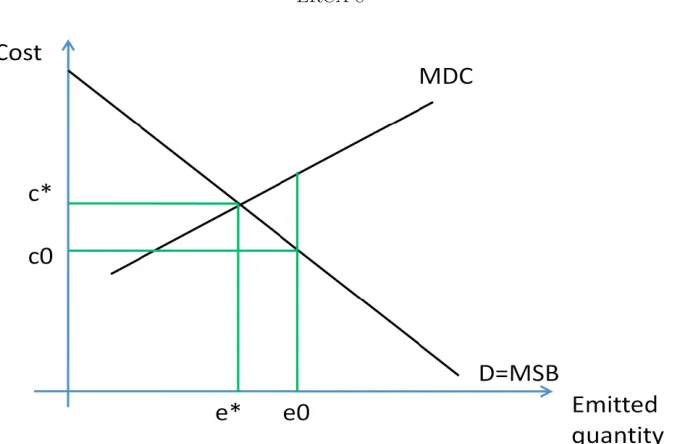
In Figure 5, the optimal pollution level corresponds to the intersection point e∗ of the marginal damage cost (MDC) and marginal abatement cost (MAC). If MSC = MSB and MAC = MDC both cost effectiveness and economic efficiency are fulfilled and the polluters do bear the cost of preventing (or generating) the externality. In the case where negative externalities are completely ignored, the production level would be q0and emissions level would be e0 and the product price would be p0. Hence, this market is not efficient.
2.4 Abatement strategy
Fig. 5.Marginal damage cost (MDC) and marginal social cost (MSC) along quantity emitted.
An abatement strategy is dependent on several steps in order to be implemented:
1. Evaluate the present situation – The first procedure is to evaluate today’s situation in order to state what kind of problems that needs to be solved, i.e. obtaining a understanding of the environmental effects and on the cause and effect of biological and/or neurological problems that might occur with increasing concentrations in the environment. Who or what is affected by the impacts?
2. Plan abatement strategy – In some cases, the planning of the abatement strategy is left to agreements between countries or within individual governments. Often, international agreements are needed to cope with anthropogenic emissions globally while financial and technological assistance may be necessary to help implementation. It is however, worth to notice that emission control has associated expenses when establishing relevant legislations and action plans. For instance, the costs to the United Nations of negotiating the Stockholm Convention were about US$ 6 million [2].
3. Implement strategy – The strategy can either consist of technological methods (remediation, pollution control or pollution prevention), non-technological methods or economic instru-ments (in form of taxation, market interference (emission trading -CO2-tax) or enforcement incentives).
4. The effect of the strategy – When monitoring the effects resulting from a given strategy, the quantification from the assessment of damage costs from negative external effects on the society or benefits for avoidance of these effects are essential.
As mentioned above, international agreements and cooperation are often needed to reduce the negative externalities from human activity. An example of ongoing work is the Governing Council (GC) of the United Nations Environment Program’s (UNEP) work on how to implement long-term measures against mercury (Hg) pollution. As an illustrative assessment on costs and benefits, the implementation of mercury abatement in the coal sector can be used as an example.
3 An illustrative cost and benefit assessment of the implementation
of mercury control in the coal power sector
3.1 Emissions (Pollutant discharges)
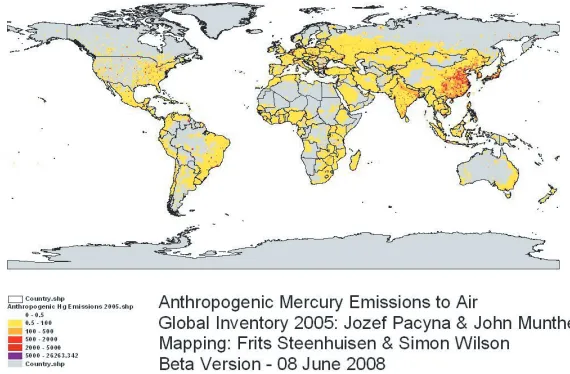
Fig. 6.Spatial distribution of Hg emissions from anthropogenic sources worldwide within 1◦by 1◦.
production and consumption of industrial goods, waste disposal and as re-emission from aquatic and terrestrial surfaces. Production of energy and industrial goods is by far the largest source category of atmospheric emissions of Hg. Processing of mineral resources at high temperatures, such as combustion of fossil fuels, roasting and smelting of non-ferrous metal ores, coke pro-duction and iron and steel foundries, as well as kilns operations in cement industry emit most of the anthropogenic Hg to the atmosphere.
About three quarters of the total anthropogenic emissions of Hg in the year 2005 estimated to be 1958 tonnes comes from sources where Hg is emitted as a by-product i.e. sources where mercury is present as a contaminant in fuel or raw material, and the rest is emitted during various applications of Hg. Nevertheless, the largest emissions of Hg to the global atmosphere occur from combustion of fossil fuels, mainly coal in utility, industrial, and residential boilers (almost 47%). The spatial distribution of the anthropogenic emissions of mercury is presented in figure 6.
3.2 Behavior in the environment
The atmosphere represents the dominant fast pathway for the transport of Hg in the environ-ment. Most Hg is emitted to the atmosphere in the form of gaseous elemental Hg (GEM), with minor amounts emitted as oxidized Hg either as oxidised Hg in the gas phase (also termed reactive gaseous Hg (RGM)) or as oxidised Hg associated with particles (total particulate Hg, TPM). GEM has a relatively long lifetime in the atmosphere (currently believed to be between 0.5 and 1.5 year), being slowly oxidized to either RGM or TPM, and thus Hg is found to be ubiquitous in the troposphere. RGM and TPM have much shorter lifetimes (hours to days) and are therefore subject to a relatively fast removal by wet or dry deposition. Schematic description of emission, chemical transformations and deposition of atmospheric Hg is shown in Figure 7.
Fig. 7. Schematic description of emission, chemical transformation and deposition of atmospheric mercury.
Atmospheric chemical transport models have been extensively applied during last decade to assess Hg levels in the ambient air and deposition fluxes both on global and regional scales. These models were also reviewed within the UNEP assessment [3]. It was concluded that contemporary models successfully reproduce elemental Hg concentration in the ambient air (uncertainty does not exceed 15–20%). Processes governing Hg deposition are poorly known and uncertainty of simulated total depositions is much higher – a factor of two. The largest contribution to the deposition uncertainty is for estimates of dry deposition. Factors that are the most significantly affecting uncertainty of Hg deposition include emissions data (anthropogenic and natural), parameters of chemical reactions leading to oxidation of elemental Hg to short-lived forms as well as characteristics of dry deposition. An important factor restraining further improvement of Hg model is lack of regular measurement data, particularly, on air concentration of short-lived Hg species, dry and wet deposition.
3.3 Environmental damage
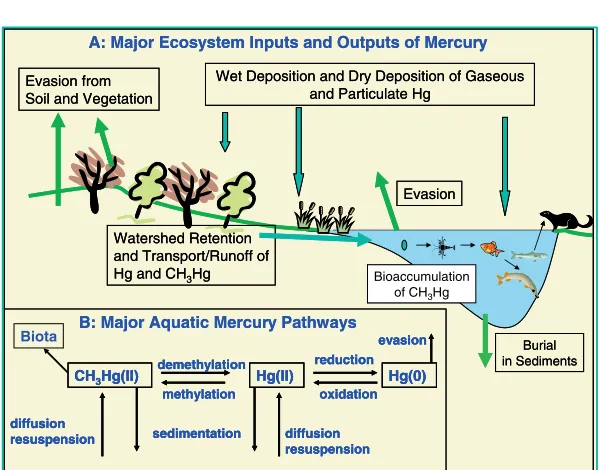
The UNEP assessment [3] concluded that concentrations of Hg in ambient air are generally too low to represent any risk of adverse health effects for humans. The concern over Hg in the atmosphere is primarily related to its potential to be transported over long distances and the fact that, following deposition, it can be taken up by biota. Furthermore, Hg can bioaccumulate and biomagnify in the form of MeHg in food-webs, particularly aquatic food-webs, to levels that can be harmful to organisms, including humans. This can result in pollution problems in otherwise clean environments far from source areas, as has been documented in the Arctic [4]. The fact that Hg can be re-emitted (see below) means that the transport pattern is complex. Consequently, it is important to investigate the surface related chemistry of Hg by determining the fluxes of different Hg species over different surfaces. An illustration of major ecosystem inputs and outputs, as well as major aquatic pathways of Hg is presented in Figure 8.
Hg(II)
methylation demethylation
CH3Hg(II)
oxidation evasion Hg(0) sedimentation reduction diffusion resuspension diffusion resuspension Burial in Sediments Hg(II) methylation demethylation
CH3Hg(II)
oxidation evasion Hg(0) sedimentation reduction diffusion resuspension diffusion resuspension Hg(II) methylation demethylation
CH3Hg(II)
oxidation evasion Hg(0) sedimentation reduction diffusion resuspension diffusion resuspension Burial in Sediments
Fig. 8.Major ecosystem inputs and outputs (A) and aquatic pathways of mercury (B).
vary by as much as 10-fold, even when atmospheric Hg levels are. Nevertheless, in a given aquatic system, the production of MeHg is believed to be approximately proportional to atmospheric Hg deposition (but with variable response time and magnitude), so it is likely that historical increases in Hg emissions have increased MeHg concentrations in fish.
Major assessment of the environmental effects of Hg has been carried out within AMAP [4]. It was concluded that piscivorous fish and wildlife experience the greatest exposure to MeHg. The fish: pike, walleye, lake trout, bass, and pickerel, the birds: loons, kingfisher, bald eagles, herons and osprey, and the mammals: otter, mink, seal, polar bear, and certain whales were found as being particularly affected.
Concerning the effects, dietary MeHg could adversely affect reproduction in wild populations of fish in surface waters containing food webs with high concentrations of MeHg. Significant neuro-chemical effects have been documented in both wild mink and in captive mink fed with currently measured levels of MeHg. Impaired reproduction of birds was documented at cur-rently measured levels of dietary MeHg intake. It is plausible that population level effects occur regionally, particularly in the most exposed cohorts of some piscivorous avian species.
3.4 Human health impacts
Consumption of fish is the major source of MeHg exposure to humans. For some populations, such as the indigenous groups in the Arctic, consumption of marine mammals such as whales is also a significant source of exposure to MeHg. Another source of exposure is consumption of animals that have been nourished with fish feed.
Various reference doses with regard to safe level of MeHg content in fish were proposed by various organizations, such as Food and Agriculture Organization (FAO), the European Commission, Health Canada, the U.S. Food and Drug Administration (FDA), the US EPA, ranging from 0.1 to 0.4µg of MeHg per kg of body weight per day. It is very important that consumers are properly advised on the safe level of MeHg in fish.
that have been affected by Hg pollution – are more highly exposed. Because the developing fetus is the most sensitive to the effects from MeHg, women of childbearing age are regarded as the population group of greatest concern.
Concerning the impacts, MeHg is a developmental neurotoxicant at current environmental levels in many regions of the world. It can cause neurological effects, including reductions in IQ (Intelligence Quotient) among children. Among adults, neurobehavioral effects can be observed at moderately elevated exposures. There is also a body of evidence indicating elevated risk for cardiovascular diseases, especially myocardial infarction. In the situation of severe exposure, there is a risk for reproductive outcomes, immune system effects and prema-ture death.
The most important studies on neurotoxic impacts due to Hg have followed cohorts of children among three populations in New Zealand, the Seychelles, and the Faroe Islands, whose diet contains a particularly large portion of seafood. Significant associations between exposure and neurotoxic impacts have been observed. For instance, based on these findings, Trasande et al. [5] consider several possible forms of the dose-response function (DRF) with and without threshold effect in estimating the societal cost of the IQ decrement in the USA. A revised function is also used in the Spadaro and Rabl [6] study. The impacts are relevant for children due to the transmission of toxic substance eaten by pregnant mother. Regarding the impacts among adults, no significant correlation with neurotoxic impacts was found due to the lower sensitiveness of the adult brain. There are other impacts due to Hg at low doses documented in the literature such as on coronary heart disease. However, the case seems to be less clear than for the neurotoxic impacts.
The slope factor, i.e. number of IQ point losses due to daily (yearly) intake of MeHg, in the Spadaro and Rabl [6] study is a product of the dose-response function for IQ loss per increase in maternal hair Hg, a ratio hair/cord blood, a ratio cord blood concentration and maternal blood concentration and a relation between intake dose of MeHg and concentration. The result is a slope factorsDR with a value of 0.036 IQ points perµg/day.
Quoting further Spadaro and Rabl [6], the lifetime impact on the offspring is only the product of the slope factor and ingestion above the threshold dose. Assuming the threshold dose of 6.7µg/day, the effect is 0.020 IQ point loss and 0.087 IQ points for zero threshold.
An important issue when discussing potential negative impacts of consumption of contami-nated fish is that fish consumptionper seis in general beneficial. Fish provides high nutritional value such as vitamins A, F, and C, protein, omega-3 fatty acids, mono-lipids, iron and zinc.
3.5 Damage costs
Information on the damage cost to society due to exposure to Hg pollution is needed for the assessment of total costs related to this pollution and to compare costs and benefits for different options of reduction of Hg pollution.
In this chapter, damage costs refer to the costs directly associated with measurable damages to human health. These damage costs are a sub-category to all the costs related to Hg pollution.
The damage costs are related directly to the dose of Hg received through inhalation of contaminated air and the ingestion of polluted food. This relation has been previously presented as the slope factor, linking IQ changes with intake of Hg containing food during pregnancy. The total damage cost related to welfare parameters of changes in development impairment have been reviewed in the DROPS project (www.drops.nilu.no). This cost includes the cost related to loss of earnings, loss of education, as well as opportunity cost while at school. Furthermore, the reduction in IQ might have a direct and indirect effect on earnings. The direct effect of reduced IQ is traced through its impact on job attainment and performance, i.e. lower IQs decrease job attainment and performance. Reduced IQ may also result in two indirect effects: reduced educational attainment, which, in turn, affects earnings and change in labor market participation.
impacts and co-benefits need to be considered. There are a number of co-benefits related to the Hg emission reduction from by product emission sources. The control technologies used to reach the emission levels stipulated in different abatement strategies for Hg are typically multi-pollutant emission reducing technologies, except for the most expensive ones. Following large reductions in mercury emissions from coal power plants there will be large emission reductions of Particulate Matter (PM) and sulphur dioxide (SO2). PM is established as related to lung and cardiovascular deceases and SO2 is since long established as the main precursor of acidification and corrosion of buildings.
In coping with the Hg emissions for the by-product emissions, electrostatic precipitators (ESPs) and fabric filters (FFs) installed and sulphur compounds also reduce emission of fine particles. In fact, it is more likely that a technology is introduced in order to deal with other, quantitative larger substances rather than dealing with Hg alone.
For Europe (which has already reduced much of SO2 emissions), the benefit/cost ratio for introducing best available technologies for SO2removal at the 100 largest coal power plants is 3.4, even though it only accounts for health effects. The techniques introduced are to a large extent identical to the techniques used to reduce Hg emissions.
From the EU DROPS project, an assessment was presented on the costs and benefits of the abatement of the heavy metals As, Cd, Hg, Ni and Pb in addition to PM2,5 for the four case countries Poland, Czech Republic, Germany and Norway in the socio-economic development scenario; Business As Usual with climate policies (BAU+climate) for the year 2020. As benefits from the reduction of both the heavy metals and the PM2,5 were included in the DROPS study; the benefits exceeded by far the abatement costs of the installed technology. The study also showed that the co-benefits were large compared to the benefits for Hg alone. For instance for Germany, the isolated beneficial effect on Hg were estimated to be 42 million Euros (63 million US2000$) per year in 2020 while the co-benefits were as high as 11,5 billion Euros (17 billion US2000$) per year, where PM2,5 (inhalation) was responsible for 92% of the value.
3.8 Costs
3.8.1 Methods of control
Higher Hg emission control efficiencies, exceeding 95%, can be obtained through a combination of flue gas desulphurization (FGD) and ESPs or FFs with “add on” type of equipment, specific for removal of Hg from the flue gases, including carbon filter beds and activated carbon injection. However, the combined solutions are very expensive and they are used only at a few sites around the globe.
energy production through a co-generation of electricity and heat in coal-fired power plants. Other potential measures affecting Hg emissions also comprise prevention options, aimed at reducing Hg in wastes and material separation, labeling of Hg containing products, and input taxes on the use of Hg in products.
There are a number of technological and non-technological solutions available which could be employed at present in order to reduce Hg emissions. Of course, it is expected that even more technological measures will be available in the near future, particularly in the field of application of renewable sources of energy production and the improvement of Hg removal using the “add on” measures in addition to ESPs/FFs combined with FGDs. There is also a great potential for improvement of non-technological measures such as decrease in the use of Hg in the future, and development of incentives for application of measures aiming at reduction of Hg emissions to the environment.
In terms of monetary cost, reducing Hg from coal combustion and other industrial processes is dependent on a variety of factors. The cost varies substantially depending on factors such as the type of coal used, the type of combustion unit, the type of control devices already in place to control other pollutants, the facility configuration, and the percent reductions expected. For example, wet scrubbers installed primarily for Hg have been estimated to cost between US$ 76,000 and US$ 174,000 per pound of Hg removed. This result is very close to the cost of 150,000 e(US$ 220,000) per kg of Hg removed. This cost is a marginal cost for Hg and it relates primarily to the application of ESPs in combination with wet scrubbers.
When more advanced removal technology will be in place, including the sorbent injection in addition to the combination of ESPs/FFs and FGD, then the Hg removal costs will be higher. On the basis of information presented in the UNEP GLOMER project [3], the cost of Hg removal within the Maximum Feasible Technology Reduction (MFTR) scenario would be around US$ 330,000 per kg of Hg removed in the developed regions and US$ 220,000 per kg of Hg removed in the developing regions.
The cost of 150,000 e(US$ 220,000) per kg of Hg abated was estimated for combustion of coal in power plants. This cost is a bit higher for industrial combustion (168,000eor US$ 250,000 per kg Hg abated) and a bit lower for cement industry (144,000.00eor US$ 210,000 per kg Hg abated).
Actual costs of abatement would also be affected by the policy to be implemented in order to achieve the proposed reductions. The cost of abatement can potentially differ for the different parts of the word due to operational costs dependent on labor costs etc. However, it seems like the price of energy is more relevant to regional differences.
4 Final remarks
Throughout this chapter, some basics principles within welfare economics and ecological eco-nomics have been presented. In general, a welfare improvement means that the net benefit criterion is fulfilled and if undertaking a project, no member of the society become worse off and at least one becomes better off. In applied welfare economics, the methodological approach to assess resource allocations towards societal optimality and thereby establish criteria for gov-ernment intervention is often linked to tools as Cost-effectiveness Analysis (CEA), Cost-Benefit Assessment (CBA) or Multi-criteria Analysis (MCA).
The benefits for society that would result from reduced emissions of Hg involve a number of health effects as well as a number of environmental effects. It is important to remember that the benefit on IQ-levels presented in this chapter is only a sub-effect of all the benefits associated with reduced Hg pollution. For a full analysis of societal costs and benefits, several aspects of Hg pollution, sources, impacts and co-benefits need to be considered.